<strong>Report</strong> Date: 3/11/2014 3:32:44 PMPage : 26COUNTY: 11 CHEROKEEDISTNODISTRICT NAMESCHOOL DISTRICT NET VALUATIONSUSED IN 20<strong>13</strong>-2014 ESTIMATE OF NEEDSAS CERTIFIED TO STATE BOARD OF EQUALIZATIONVALUE OF VALUE OF VALUE OF VAL. LEVIES GENERAL FUND GEN. FUNDREAL PERSONAL PUBLIC TOTAL OF PER CAP GEN. BLDG SINK EXPENDITURE BALANCEPROPERTY PROPERTY SERVICES VALUATION RAW FUND FUND FUND JUNE 30, 20<strong>13</strong> JULY 1, 20<strong>13</strong>ADAC010 LOWREY 3,687,789 508,<strong>13</strong>3 107,<strong>13</strong>8 4,303,060 29,572 35.00 5.00 0.00 1,369,564 415,958C014 NORWOOD 4,205,827 339,596 481,836 5,027,259 28,6<strong>13</strong> 35.00 5.00 0.00 1,434,179 500,249C021 WOODALL 3,447,360 787,012 166,666 4,401,038 9,124 35.00 5.00 <strong>13</strong>.83 3,726,749 1,103,968C026 SHADY GROVE 2,419,445 226,081 32,631 2,678,157 21,181 35.00 5.00 0.00 1,472,916 284,933C031 PEGGS 3,779,284 548,227 210,473 4,537,984 18,037 35.00 5.00 0.00 2,016,880 465,696C034 GRAND VIEW 11,282,278 797,625 178,526 12,258,429 25,992 35.00 5.00 9.29 4,140,4<strong>13</strong> 467,794C044 BRIGGS 6,376,228 764,870 758,259 7,899,357 19,220 35.00 5.00 0.00 3,625,069 959,241C066 TENKILLER 3,571,947 767,402 120,409 4,459,758 15,5<strong>13</strong> 35.00 5.00 0.00 2,810,200 4<strong>13</strong>,187I006 KEYS 25,695,446 2,243,857 682,009 28,621,312 34,301 35.00 5.00 8.86 5,552,950 385,278I016 HULBERT 10,023,426 1,294,626 459,852 11,777,904 21,546 35.00 5.00 0.00 4,671,943 459,020I035 TAHLEQUAH 68,760,336 10,222,869 2,824,642 81,807,847 24,789 35.00 5.00 24.63 27,727,538 7,550,146TOTAL 143,249,366 18,500,298 6,022,441 167,772,105 23,855 - - - 58,548,401 <strong>13</strong>,005,471In addition to the levies shown, all schools receive another 4 mIlls.(County 4 mill levy-article x-section 9-constitution of Oklahoma)Includes all functions from OCAS expenditure data.COUNTY: 11 CHEROKEEDISTNODISTRICT NAMERAWADA*STATISTICAL AND FINANCIAL INFORMATIONTOTAL REVENUE RECEIVED BY SCHOOL DISTRICT<strong>2012</strong>-20<strong>13</strong>RAWADM*WGHTADM**LOCALANDCOUNTYSTATE REVENUES TOTAL REVENUESTATE STATE FEDERAL REVENUE PER CAPDEDICATED APPROPIATEDRECEIVED WGHT ADMC010 LOWREY 145.51 154.48 287.41 701,047 89,926 745,115 249,434 1,785,523 6,212C014 NORWOOD 175.70 181.22 332.74 632,970 59,155 890,579 351,724 1,934,428 5,814C021 WOODALL 482.36 516.54 806.29 1,881,537 87,974 2,488,707 371,793 4,830,010 5,990C026 SHADY GROVE 126.44 129.61 307.04 510,376 56,215 880,945 310,3<strong>13</strong> 1,757,848 5,725C031 PEGGS 251.59 264.52 477.07 762,821 95,343 1,388,724 235,688 2,482,576 5,204C034 GRAND VIEW 471.63 499.24 877.08 884,789 115,262 2,528,921 1,079,235 4,608,207 5,254C044 BRIGGS 411.00 436.26 854.97 1,296,206 1<strong>13</strong>,294 2,476,488 697,819 4,583,808 5,361C066 TENKILLER 287.49 297.11 596.05 659,267 99,339 1,798,369 666,412 3,223,387 5,408I006 KEYS 834.41 869.53 1,374.49 1,423,977 438,943 3,331,278 744,030 5,938,228 4,320I016 HULBERT 546.65 607.85 950.90 1,<strong>13</strong>9,302 389,336 2,535,556 1,066,769 5,<strong>13</strong>0,963 5,396I035 TAHLEQUAH 3,300.19 3,520.82 5,806.69 12,834,754 1,918,2<strong>13</strong> 15,406,521 5,107,686 35,267,175 6,074TOTAL 7,032.97 7,477.18 12,670.73 22,727,046 3,463,000 34,471,203 10,880,905 71,542,154 5,646State appropriated revenue for sponsoring district includes charter school flow through funds.* Taken from final audit <strong>2012</strong>-20<strong>13</strong>** Used <strong>2012</strong>-20<strong>13</strong> State Aid Formula to calculate foundation & salary incentive aidRevenue Per Capita is calculated by using the weighted ADM to better reflect the distribution of revenue by districtRemainder of information taken from school district Estimate of Needs and financial statement. Includes all Revenue Sources from OCAS.
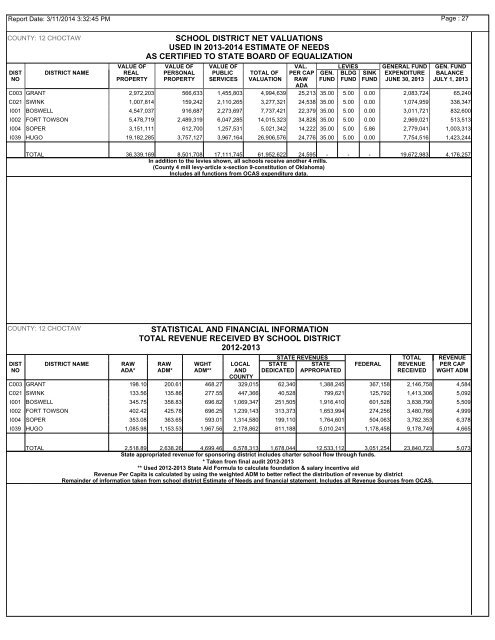
<strong>Report</strong> Date: 3/11/2014 3:32:45 PMPage : 27COUNTY: 12 CHOCTAWDISTNODISTRICT NAMESCHOOL DISTRICT NET VALUATIONSUSED IN 20<strong>13</strong>-2014 ESTIMATE OF NEEDSAS CERTIFIED TO STATE BOARD OF EQUALIZATIONVALUE OF VALUE OF VALUE OF VAL. LEVIES GENERAL FUND GEN. FUNDREAL PERSONAL PUBLIC TOTAL OF PER CAP GEN. BLDG SINK EXPENDITURE BALANCEPROPERTY PROPERTY SERVICES VALUATION RAW FUND FUND FUND JUNE 30, 20<strong>13</strong> JULY 1, 20<strong>13</strong>ADAC003 GRANT 2,972,203 566,633 1,455,803 4,994,639 25,2<strong>13</strong> 35.00 5.00 0.00 2,083,724 65,240C021 SWINK 1,007,814 159,242 2,110,265 3,277,321 24,538 35.00 5.00 0.00 1,074,959 338,347I001 BOSWELL 4,547,037 916,687 2,273,697 7,737,421 22,379 35.00 5.00 0.00 3,011,721 832,600I002 FORT TOWSON 5,478,719 2,489,319 6,047,285 14,015,323 34,828 35.00 5.00 0.00 2,969,021 5<strong>13</strong>,5<strong>13</strong>I004 SOPER 3,151,111 612,700 1,257,531 5,021,342 14,222 35.00 5.00 5.86 2,779,041 1,003,3<strong>13</strong>I039 HUGO 19,182,285 3,757,127 3,967,164 26,906,576 24,776 35.00 5.00 0.00 7,754,516 1,423,244TOTAL 36,339,169 8,501,708 17,111,745 61,952,622 24,595 - - - 19,672,983 4,176,257In addition to the levies shown, all schools receive another 4 mIlls.(County 4 mill levy-article x-section 9-constitution of Oklahoma)Includes all functions from OCAS expenditure data.COUNTY: 12 CHOCTAWDISTNODISTRICT NAMERAWADA*STATISTICAL AND FINANCIAL INFORMATIONTOTAL REVENUE RECEIVED BY SCHOOL DISTRICT<strong>2012</strong>-20<strong>13</strong>RAWADM*WGHTADM**LOCALANDCOUNTYSTATE REVENUES TOTAL REVENUESTATE STATE FEDERAL REVENUE PER CAPDEDICATED APPROPIATEDRECEIVED WGHT ADMC003 GRANT 198.10 200.61 468.27 329,015 62,340 1,388,245 367,158 2,146,758 4,584C021 SWINK <strong>13</strong>3.56 <strong>13</strong>5.86 277.55 447,366 40,528 799,621 125,792 1,4<strong>13</strong>,306 5,092I001 BOSWELL 345.75 358.83 696.82 1,069,347 251,505 1,916,410 601,528 3,838,790 5,509I002 FORT TOWSON 402.42 425.78 696.25 1,239,143 3<strong>13</strong>,373 1,653,994 274,256 3,480,766 4,999I004 SOPER 353.08 363.65 593.01 1,314,580 199,110 1,764,601 504,063 3,782,353 6,378I039 HUGO 1,085.98 1,153.53 1,967.56 2,178,862 811,188 5,010,241 1,178,458 9,178,749 4,665TOTAL 2,518.89 2,638.26 4,699.46 6,578,3<strong>13</strong> 1,678,044 12,533,112 3,051,254 23,840,723 5,073State appropriated revenue for sponsoring district includes charter school flow through funds.* Taken from final audit <strong>2012</strong>-20<strong>13</strong>** Used <strong>2012</strong>-20<strong>13</strong> State Aid Formula to calculate foundation & salary incentive aidRevenue Per Capita is calculated by using the weighted ADM to better reflect the distribution of revenue by districtRemainder of information taken from school district Estimate of Needs and financial statement. Includes all Revenue Sources from OCAS.