


Create successful ePaper yourself
Turn your PDF publications into a flip-book with our unique Google optimized e-Paper software.
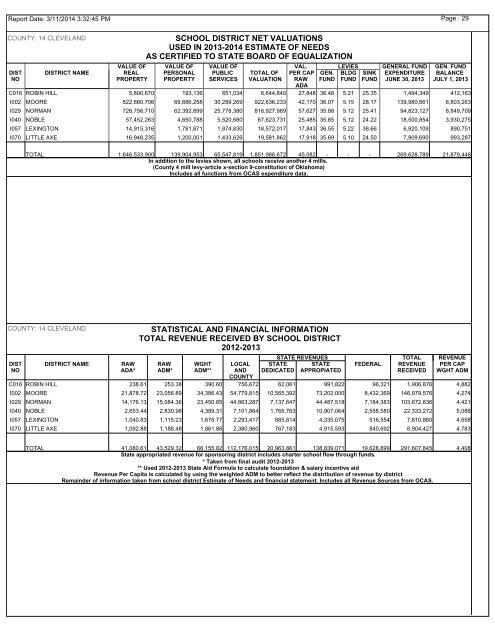
<strong>Report</strong> Date: 3/11/2014 3:32:45 PMPage : 29COUNTY: 14 CLEVELANDDISTNODISTRICT NAMESCHOOL DISTRICT NET VALUATIONSUSED IN 20<strong>13</strong>-2014 ESTIMATE OF NEEDSAS CERTIFIED TO STATE BOARD OF EQUALIZATIONVALUE OF VALUE OF VALUE OF VAL. LEVIES GENERAL FUND GEN. FUNDREAL PERSONAL PUBLIC TOTAL OF PER CAP GEN. BLDG SINK EXPENDITURE BALANCEPROPERTY PROPERTY SERVICES VALUATION RAW FUND FUND FUND JUNE 30, 20<strong>13</strong> JULY 1, 20<strong>13</strong>ADAC016 ROBIN HILL 5,800,670 193,<strong>13</strong>6 651,034 6,644,840 27,848 36.48 5.21 25.35 1,494,349 412,163I002 MOORE 822,660,706 69,686,258 30,289,269 922,636,233 42,170 36.07 5.15 28.17 <strong>13</strong>9,980,661 6,803,263I029 NORMAN 728,756,710 62,392,899 25,778,380 816,927,989 57,627 35.88 5.12 25.41 94,823,127 8,849,709I040 NOBLE 57,452,263 4,650,788 5,520,680 67,623,731 25,485 35.85 5.12 24.22 18,500,854 3,930,275I057 LEXINGTON 14,915,316 1,781,871 1,874,830 18,572,017 17,843 36.55 5.22 38.66 6,920,109 890,751I070 LITTLE AXE 16,948,235 1,200,001 1,433,626 19,581,862 17,918 35.69 5.10 24.50 7,909,690 993,287TOTAL 1,646,533,900 <strong>13</strong>9,904,953 65,547,819 1,851,986,672 45,082 - - - 269,628,789 21,879,448In addition to the levies shown, all schools receive another 4 mIlls.(County 4 mill levy-article x-section 9-constitution of Oklahoma)Includes all functions from OCAS expenditure data.COUNTY: 14 CLEVELANDDISTNODISTRICT NAMERAWADA*STATISTICAL AND FINANCIAL INFORMATIONTOTAL REVENUE RECEIVED BY SCHOOL DISTRICT<strong>2012</strong>-20<strong>13</strong>RAWADM*WGHTADM**LOCALANDCOUNTYSTATE REVENUES TOTAL REVENUESTATE STATE FEDERAL REVENUE PER CAPDEDICATED APPROPIATEDRECEIVED WGHT ADMC016 ROBIN HILL 238.61 253.38 390.60 756,672 62,061 991,822 96,321 1,906,876 4,882I002 MOORE 21,878.72 23,056.89 34,386.43 54,779,815 10,565,392 73,202,000 8,432,369 146,979,576 4,274I029 NORMAN 14,176.<strong>13</strong> 15,084.36 23,450.85 44,863,287 7,<strong>13</strong>7,647 44,487,518 7,184,383 103,672,836 4,421I040 NOBLE 2,653.44 2,830.98 4,389.31 7,101,864 1,765,763 10,907,064 2,558,580 22,333,272 5,088I057 LEXINGTON 1,040.83 1,115.23 1,676.77 2,293,417 665,814 4,335,075 516,554 7,810,860 4,658I070 LITTLE AXE 1,092.88 1,188.48 1,861.86 2,380,960 767,183 4,915,593 840,692 8,904,427 4,783TOTAL 41,080.61 43,529.32 66,155.82 112,176,015 20,963,861 <strong>13</strong>8,839,071 19,628,899 291,607,845 4,408State appropriated revenue for sponsoring district includes charter school flow through funds.* Taken from final audit <strong>2012</strong>-20<strong>13</strong>** Used <strong>2012</strong>-20<strong>13</strong> State Aid Formula to calculate foundation & salary incentive aidRevenue Per Capita is calculated by using the weighted ADM to better reflect the distribution of revenue by districtRemainder of information taken from school district Estimate of Needs and financial statement. Includes all Revenue Sources from OCAS.