<strong>Report</strong> Date: 3/11/2014 3:32:44 PMPage : 24COUNTY: 09 CANADIANDISTNODISTRICT NAMESCHOOL DISTRICT NET VALUATIONSUSED IN 20<strong>13</strong>-2014 ESTIMATE OF NEEDSAS CERTIFIED TO STATE BOARD OF EQUALIZATIONVALUE OF VALUE OF VALUE OF VAL. LEVIES GENERAL FUND GEN. FUNDREAL PERSONAL PUBLIC TOTAL OF PER CAP GEN. BLDG SINK EXPENDITURE BALANCEPROPERTY PROPERTY SERVICES VALUATION RAW FUND FUND FUND JUNE 30, 20<strong>13</strong> JULY 1, 20<strong>13</strong>ADAC029 RIVERSIDE 11,587,083 8,880,075 1,606,540 22,073,698 <strong>13</strong>2,115 36.01 5.14 0.00 1,226,496 451,596C031 BANNER 15,449,<strong>13</strong>6 12,154,736 4,601,854 32,205,726 176,848 36.12 5.16 0.00 1,201,319 640,345C070 DARLINGTON 4,601,400 21,707,159 629,581 26,938,140 119,348 36.65 5.24 0.00 2,295,099 1,175,839C162 MAPLE 5,223,679 41,226,353 3,189,<strong>13</strong>6 49,639,168 328,041 36.98 5.28 8.90 1,501,798 808,671I022 PIEDMONT 110,696,193 4,245,786 6,950,317 121,892,296 41,5<strong>13</strong> 36.75 5.25 32.08 16,282,944 2,732,432I027 YUKON 246,636,056 39,549,611 11,074,189 297,259,856 40,067 36.53 5.22 29.04 48,570,409 6,525,314I034 EL RENO 45,186,337 28,364,274 4,383,319 77,933,930 33,181 36.01 5.14 30.34 17,759,165 3,166,621I057 UNION CITY 8,016,239 6,525,074 875,889 15,417,202 55,654 36.17 5.17 14.77 2,<strong>13</strong>4,059 367,830I069 MUSTANG 337,943,247 29,387,183 19,917,655 387,248,085 43,095 36.31 5.19 24.80 53,708,143 4,573,862I076 CALUMET 5,641,<strong>13</strong>0 45,956,260 1,397,228 52,994,618 175,671 36.37 5.20 9.97 2,186,694 758,560TOTAL 790,980,500 237,996,511 54,625,708 1,083,602,719 47,123 - - - 146,866,126 21,201,069In addition to the levies shown, all schools receive another 4 mIlls.(County 4 mill levy-article x-section 9-constitution of Oklahoma)Includes all functions from OCAS expenditure data.COUNTY: 09 CANADIANDISTNODISTRICT NAMERAWADA*STATISTICAL AND FINANCIAL INFORMATIONTOTAL REVENUE RECEIVED BY SCHOOL DISTRICT<strong>2012</strong>-20<strong>13</strong>RAWADM*WGHTADM**LOCALANDCOUNTYSTATE REVENUES TOTAL REVENUESTATE STATE FEDERAL REVENUE PER CAPDEDICATED APPROPIATEDRECEIVED WGHT ADMC029 RIVERSIDE 167.08 177.58 301.27 1,264,140 32,652 323,072 58,662 1,678,526 5,572C031 BANNER 182.11 189.61 295.30 1,620,876 31,582 103,236 101,507 1,857,201 6,289C070 DARLINGTON 225.71 239.22 414.28 1,294,462 49,333 1,122,709 1,004,433 3,470,938 8,378C162 MAPLE 151.32 157.03 239.76 2,088,750 70,590 107,406 43,723 2,310,469 9,637I022 PIEDMONT 2,936.27 3,075.55 4,319.83 8,095,645 1,187,466 9,073,624 658,186 19,014,921 4,402I027 YUKON 7,419.10 7,818.16 11,389.38 22,121,620 4,187,010 24,194,129 4,592,963 55,095,722 4,837I034 EL RENO 2,348.74 2,512.02 4,036.94 7,547,656 1,670,872 9,629,515 2,072,<strong>13</strong>5 20,920,179 5,182I057 UNION CITY 277.02 287.95 473.49 1,112,123 239,972 870,475 279,320 2,501,889 5,284I069 MUSTANG 8,985.97 9,555.79 <strong>13</strong>,828.51 23,067,388 4,560,602 28,767,747 1,886,268 58,282,005 4,215I076 CALUMET 301.67 309.82 489.24 1,449,312 229,787 707,992 557,520 2,944,6<strong>13</strong> 6,019TOTAL 22,994.99 24,322.73 35,788.00 69,661,973 12,259,866 74,899,907 11,254,717 168,076,463 4,696State appropriated revenue for sponsoring district includes charter school flow through funds.* Taken from final audit <strong>2012</strong>-20<strong>13</strong>** Used <strong>2012</strong>-20<strong>13</strong> State Aid Formula to calculate foundation & salary incentive aidRevenue Per Capita is calculated by using the weighted ADM to better reflect the distribution of revenue by districtRemainder of information taken from school district Estimate of Needs and financial statement. Includes all Revenue Sources from OCAS.
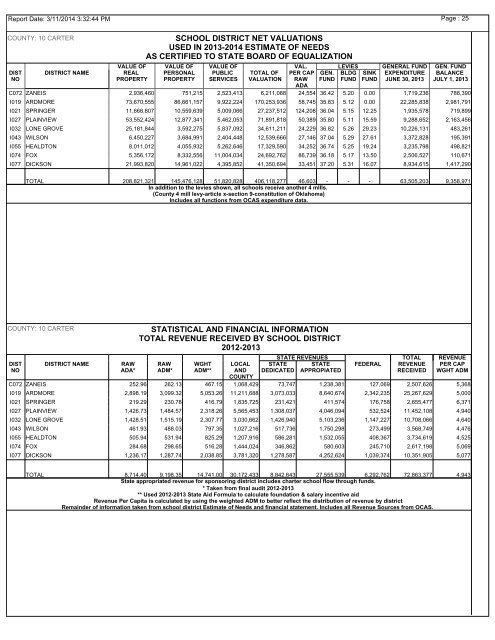
<strong>Report</strong> Date: 3/11/2014 3:32:44 PMPage : 25COUNTY: 10 CARTERDISTNODISTRICT NAMESCHOOL DISTRICT NET VALUATIONSUSED IN 20<strong>13</strong>-2014 ESTIMATE OF NEEDSAS CERTIFIED TO STATE BOARD OF EQUALIZATIONVALUE OF VALUE OF VALUE OF VAL. LEVIES GENERAL FUND GEN. FUNDREAL PERSONAL PUBLIC TOTAL OF PER CAP GEN. BLDG SINK EXPENDITURE BALANCEPROPERTY PROPERTY SERVICES VALUATION RAW FUND FUND FUND JUNE 30, 20<strong>13</strong> JULY 1, 20<strong>13</strong>ADAC072 ZANEIS 2,936,460 751,215 2,523,4<strong>13</strong> 6,211,088 24,554 36.42 5.20 0.00 1,719,236 788,390I019 ARDMORE 73,670,555 86,661,157 9,922,224 170,253,936 58,745 35.83 5.12 0.00 22,285,838 2,981,791I021 SPRINGER 11,668,807 10,559,639 5,009,066 27,237,512 124,208 36.04 5.15 12.25 1,935,578 719,899I027 PLAINVIEW 53,552,424 12,877,341 5,462,053 71,891,818 50,389 35.80 5.11 15.59 9,288,652 2,163,456I032 LONE GROVE 25,181,844 3,592,275 5,837,092 34,611,211 24,229 36.82 5.26 29.23 10,226,<strong>13</strong>1 483,261I043 WILSON 6,450,227 3,684,991 2,404,448 12,539,666 27,146 37.04 5.29 27.61 3,372,828 195,391I055 HEALDTON 8,011,012 4,055,932 5,262,646 17,329,590 34,252 36.74 5.25 19.24 3,235,798 498,821I074 FOX 5,356,172 8,332,556 11,004,034 24,692,762 86,739 36.18 5.17 <strong>13</strong>.50 2,506,527 110,671I077 DICKSON 21,993,820 14,961,022 4,395,852 41,350,694 33,451 37.20 5.31 16.07 8,934,615 1,417,290TOTAL 208,821,321 145,476,128 51,820,828 406,118,277 46,603 - - - 63,505,203 9,358,971In addition to the levies shown, all schools receive another 4 mIlls.(County 4 mill levy-article x-section 9-constitution of Oklahoma)Includes all functions from OCAS expenditure data.COUNTY: 10 CARTERDISTNODISTRICT NAMERAWADA*STATISTICAL AND FINANCIAL INFORMATIONTOTAL REVENUE RECEIVED BY SCHOOL DISTRICT<strong>2012</strong>-20<strong>13</strong>RAWADM*WGHTADM**LOCALANDCOUNTYSTATE REVENUES TOTAL REVENUESTATE STATE FEDERAL REVENUE PER CAPDEDICATED APPROPIATEDRECEIVED WGHT ADMC072 ZANEIS 252.96 262.<strong>13</strong> 467.15 1,068,429 73,747 1,238,381 127,069 2,507,626 5,368I019 ARDMORE 2,898.19 3,099.32 5,053.26 11,211,688 3,073,033 8,640,674 2,342,235 25,267,629 5,000I021 SPRINGER 219.29 230.78 416.79 1,835,725 231,421 411,574 176,758 2,655,477 6,371I027 PLAINVIEW 1,426.73 1,484.57 2,318.26 5,565,453 1,308,037 4,046,094 532,524 11,452,108 4,940I032 LONE GROVE 1,428.51 1,515.19 2,307.77 3,030,662 1,426,940 5,103,236 1,147,227 10,708,066 4,640I043 WILSON 461.93 488.03 797.35 1,027,216 517,736 1,750,298 273,499 3,568,749 4,476I055 HEALDTON 505.94 531.94 825.29 1,207,916 586,281 1,532,055 408,367 3,734,619 4,525I074 FOX 284.68 298.65 516.28 1,444,024 346,862 580,603 245,710 2,617,198 5,069I077 DICKSON 1,236.17 1,287.74 2,038.85 3,781,320 1,278,587 4,252,624 1,039,374 10,351,905 5,077TOTAL 8,714.40 9,198.35 14,741.00 30,172,433 8,842,643 27,555,539 6,292,762 72,863,377 4,943State appropriated revenue for sponsoring district includes charter school flow through funds.* Taken from final audit <strong>2012</strong>-20<strong>13</strong>** Used <strong>2012</strong>-20<strong>13</strong> State Aid Formula to calculate foundation & salary incentive aidRevenue Per Capita is calculated by using the weighted ADM to better reflect the distribution of revenue by districtRemainder of information taken from school district Estimate of Needs and financial statement. Includes all Revenue Sources from OCAS.