<strong>Report</strong> Date: 3/11/2014 3:32:47 PMPage : 36COUNTY: 21 DELAWAREDISTNODISTRICT NAMESCHOOL DISTRICT NET VALUATIONSUSED IN 20<strong>13</strong>-2014 ESTIMATE OF NEEDSAS CERTIFIED TO STATE BOARD OF EQUALIZATIONVALUE OF VALUE OF VALUE OF VAL. LEVIES GENERAL FUND GEN. FUNDREAL PERSONAL PUBLIC TOTAL OF PER CAP GEN. BLDG SINK EXPENDITURE BALANCEPROPERTY PROPERTY SERVICES VALUATION RAW FUND FUND FUND JUNE 30, 20<strong>13</strong> JULY 1, 20<strong>13</strong>ADAC006 CLEORA 36,853,783 1,038,983 359,904 38,252,670 325,305 36.77 5.26 0.00 1,409,162 1,797,740C014 LEACH 2,088,492 372,601 118,245 2,579,338 17,066 37.77 5.40 0.00 1,203,958 344,749C030 KENWOOD 404,559 167,653 42,129 614,341 5,453 37.19 5.31 0.00 1,128,925 43,071C034 MOSELEY 7,066,415 1,091,274 238,461 8,396,150 38,483 36.77 5.25 0.00 1,837,350 736,212I001 JAY 38,291,926 4,741,154 4,528,960 47,562,040 29,884 36.61 5.23 10.85 <strong>13</strong>,312,871 611,951I002 GROVE 168,325,035 14,021,009 4,369,751 186,715,795 78,759 36.40 5.20 12.52 16,019,057 2,029,603I003 KANSAS 11,096,929 970,612 312,354 12,379,895 14,828 37.06 5.29 27.26 7,400,297 643,893I004 COLCORD 6,916,643 1,183,936 329,751 8,430,330 14,245 37.74 5.39 19.19 4,397,520 2<strong>13</strong>,392I005 OAKS-MISSION 3,393,500 591,286 142,057 4,126,843 18,117 37.05 5.29 0.00 2,181,682 190,710TOTAL 274,437,282 24,178,508 10,441,612 309,057,402 49,717 - - - 48,890,822 6,611,321In addition to the levies shown, all schools receive another 4 mIlls.(County 4 mill levy-article x-section 9-constitution of Oklahoma)Includes all functions from OCAS expenditure data.COUNTY: 21 DELAWAREDISTNODISTRICT NAMERAWADA*STATISTICAL AND FINANCIAL INFORMATIONTOTAL REVENUE RECEIVED BY SCHOOL DISTRICT<strong>2012</strong>-20<strong>13</strong>RAWADM*WGHTADM**LOCALANDCOUNTYSTATE REVENUES TOTAL REVENUESTATE STATE FEDERAL REVENUE PER CAPDEDICATED APPROPIATEDRECEIVED WGHT ADMC006 CLEORA 117.59 122.32 197.71 2,969,809 40,373 107,417 89,303 3,206,902 16,220C014 LEACH 151.14 159.52 267.10 439,877 40,448 756,556 311,826 1,548,707 5,798C030 KENWOOD 112.67 122.77 216.82 216,790 22,965 697,363 231,039 1,168,156 5,388C034 MOSELEY 218.18 233.34 473.38 1,052,728 60,4<strong>13</strong> 1,174,598 285,823 2,573,562 5,437I001 JAY 1,591.58 1,732.25 2,858.78 3,972,741 1,011,205 7,122,088 1,799,940 <strong>13</strong>,905,974 4,864I002 GROVE 2,370.72 2,531.77 3,948.39 9,907,226 1,211,875 5,631,680 1,408,148 18,158,930 4,599I003 KANSAS 834.89 894.85 1,614.97 1,560,165 459,229 4,632,798 1,381,159 8,033,352 4,974I004 COLCORD 591.79 633.19 1,012.44 881,329 370,429 2,818,289 540,150 4,610,198 4,554I005 OAKS-MISSION 227.79 242.23 467.53 464,499 214,493 1,236,427 456,973 2,372,392 5,074TOTAL 6,216.35 6,672.24 11,057.12 21,465,164 3,431,431 24,177,217 6,504,361 55,578,173 5,026State appropriated revenue for sponsoring district includes charter school flow through funds.* Taken from final audit <strong>2012</strong>-20<strong>13</strong>** Used <strong>2012</strong>-20<strong>13</strong> State Aid Formula to calculate foundation & salary incentive aidRevenue Per Capita is calculated by using the weighted ADM to better reflect the distribution of revenue by districtRemainder of information taken from school district Estimate of Needs and financial statement. Includes all Revenue Sources from OCAS.
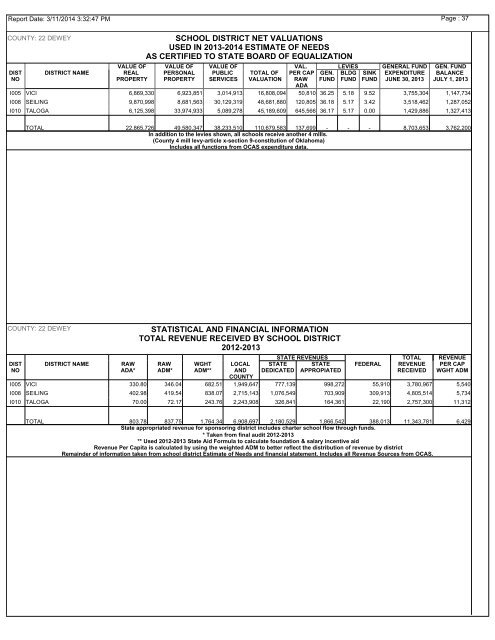
<strong>Report</strong> Date: 3/11/2014 3:32:47 PMPage : 37COUNTY: 22 DEWEYDISTNODISTRICT NAMESCHOOL DISTRICT NET VALUATIONSUSED IN 20<strong>13</strong>-2014 ESTIMATE OF NEEDSAS CERTIFIED TO STATE BOARD OF EQUALIZATIONVALUE OF VALUE OF VALUE OF VAL. LEVIES GENERAL FUND GEN. FUNDREAL PERSONAL PUBLIC TOTAL OF PER CAP GEN. BLDG SINK EXPENDITURE BALANCEPROPERTY PROPERTY SERVICES VALUATION RAW FUND FUND FUND JUNE 30, 20<strong>13</strong> JULY 1, 20<strong>13</strong>ADAI005 VICI 6,869,330 6,923,851 3,014,9<strong>13</strong> 16,808,094 50,810 36.25 5.18 9.52 3,755,304 1,147,734I008 SEILING 9,870,998 8,681,563 30,129,319 48,681,880 120,805 36.18 5.17 3.42 3,518,462 1,287,052I010 TALOGA 6,125,398 33,974,933 5,089,278 45,189,609 645,566 36.17 5.17 0.00 1,429,886 1,327,4<strong>13</strong>TOTAL 22,865,726 49,580,347 38,233,510 110,679,583 <strong>13</strong>7,699 - - - 8,703,653 3,762,200In addition to the levies shown, all schools receive another 4 mIlls.(County 4 mill levy-article x-section 9-constitution of Oklahoma)Includes all functions from OCAS expenditure data.COUNTY: 22 DEWEYDISTNODISTRICT NAMERAWADA*STATISTICAL AND FINANCIAL INFORMATIONTOTAL REVENUE RECEIVED BY SCHOOL DISTRICT<strong>2012</strong>-20<strong>13</strong>RAWADM*WGHTADM**LOCALANDCOUNTYSTATE REVENUES TOTAL REVENUESTATE STATE FEDERAL REVENUE PER CAPDEDICATED APPROPIATEDRECEIVED WGHT ADMI005 VICI 330.80 346.04 682.51 1,949,647 777,<strong>13</strong>9 998,272 55,910 3,780,967 5,540I008 SEILING 402.98 419.54 838.07 2,715,143 1,076,549 703,909 309,9<strong>13</strong> 4,805,514 5,734I010 TALOGA 70.00 72.17 243.76 2,243,908 326,841 164,361 22,190 2,757,300 11,312TOTAL 803.78 837.75 1,764.34 6,908,697 2,180,529 1,866,542 388,0<strong>13</strong> 11,343,781 6,429State appropriated revenue for sponsoring district includes charter school flow through funds.* Taken from final audit <strong>2012</strong>-20<strong>13</strong>** Used <strong>2012</strong>-20<strong>13</strong> State Aid Formula to calculate foundation & salary incentive aidRevenue Per Capita is calculated by using the weighted ADM to better reflect the distribution of revenue by districtRemainder of information taken from school district Estimate of Needs and financial statement. Includes all Revenue Sources from OCAS.