eruptive and passive degassing of sulphur dioxide at nyiragongo ...
eruptive and passive degassing of sulphur dioxide at nyiragongo ...
eruptive and passive degassing of sulphur dioxide at nyiragongo ...

You also want an ePaper? Increase the reach of your titles
YUMPU automatically turns print PDFs into web optimized ePapers that Google loves.
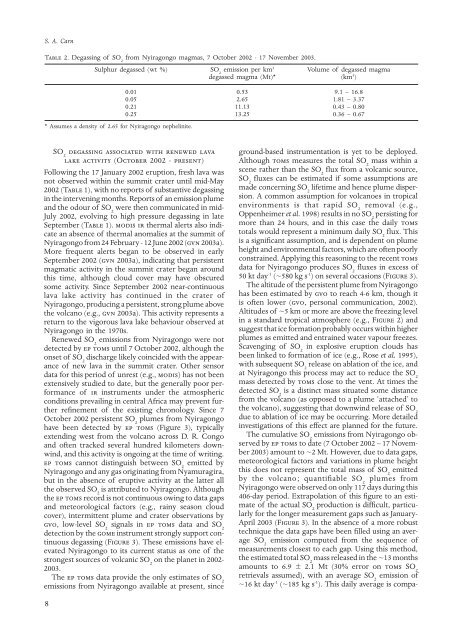
S. A. CarnTable 2. Degassing <strong>of</strong> SO 2from Nyiragongo magmas, 7 October 2002 - 17 November 2003.Sulphur degassed (wt %) SO 2emission per km 3 Volume <strong>of</strong> degassed magmadegassed magma (Mt)* (km 3 )* Assumes a density <strong>of</strong> 2.65 for Nyiragongo nephelinite.0.01 0.53 9.1 – 16.80.05 2.65 1.81 – 3.370.21 11.13 0.43 – 0.800.25 13.25 0.36 – 0.67SO 2<strong>degassing</strong> associ<strong>at</strong>ed with renewed lavalake activity (October 2002 - present)Following the 17 January 2002 eruption, fresh lava wasnot observed within the summit cr<strong>at</strong>er until mid-May2002 (Table 1), with no reports <strong>of</strong> substantive <strong>degassing</strong>in the intervening months. Reports <strong>of</strong> an emission plume<strong>and</strong> the odour <strong>of</strong> SO 2were then communic<strong>at</strong>ed in mid-July 2002, evolving to high pressure <strong>degassing</strong> in l<strong>at</strong>eSeptember (Table 1). modis ir thermal alerts also indic<strong>at</strong>ean absence <strong>of</strong> thermal anomalies <strong>at</strong> the summit <strong>of</strong>Nyiragongo from 24 February - 12 June 2002 (gvn 2003a).More frequent alerts began to be observed in earlySeptember 2002 (gvn 2003a), indic<strong>at</strong>ing th<strong>at</strong> persistentmagm<strong>at</strong>ic activity in the summit cr<strong>at</strong>er began aroundthis time, although cloud cover may have obscuredsome activity. Since September 2002 near-continuouslava lake activity has continued in the cr<strong>at</strong>er <strong>of</strong>Nyiragongo, producing a persistent, strong plume abovethe volcano (e.g., gvn 2003a). This activity represents areturn to the vigorous lava lake behaviour observed <strong>at</strong>Nyiragongo in the 1970s.Renewed SO 2emissions from Nyiragongo were notdetected by ep toms until 7 October 2002, although theonset <strong>of</strong> SO 2discharge likely coincided with the appearance<strong>of</strong> new lava in the summit cr<strong>at</strong>er. Other sensord<strong>at</strong>a for this period <strong>of</strong> unrest (e.g., modis) has not beenextensively studied to d<strong>at</strong>e, but the generally poor performance<strong>of</strong> ir instruments under the <strong>at</strong>mosphericconditions prevailing in central Africa may prevent furtherrefinement <strong>of</strong> the existing chronology. Since 7October 2002 persistent SO 2plumes from Nyiragongohave been detected by ep toms (Figure 3), typicallyextending west from the volcano across D. R. Congo<strong>and</strong> <strong>of</strong>ten tracked several hundred kilometers downwind,<strong>and</strong> this activity is ongoing <strong>at</strong> the time <strong>of</strong> writing.ep toms cannot distinguish between SO 2emitted byNyiragongo <strong>and</strong> any gas origin<strong>at</strong>ing from Nyamuragira,but in the absence <strong>of</strong> <strong>eruptive</strong> activity <strong>at</strong> the l<strong>at</strong>ter allthe observed SO 2is <strong>at</strong>tributed to Nyiragongo. Althoughthe ep toms record is not continuous owing to d<strong>at</strong>a gaps<strong>and</strong> meteorological factors (e.g., rainy season cloudcover), intermittent plume <strong>and</strong> cr<strong>at</strong>er observ<strong>at</strong>ions bygvo, low-level SO 2signals in ep toms d<strong>at</strong>a <strong>and</strong> SO 2detection by the gome instrument strongly support continuous<strong>degassing</strong> (Figure 3). These emissions have elev<strong>at</strong>edNyiragongo to its current st<strong>at</strong>us as one <strong>of</strong> thestrongest sources <strong>of</strong> volcanic SO 2on the planet in 2002-2003.The ep toms d<strong>at</strong>a provide the only estim<strong>at</strong>es <strong>of</strong> SO 2emissions from Nyiragongo available <strong>at</strong> present, sinceground-based instrument<strong>at</strong>ion is yet to be deployed.Although toms measures the total SO 2mass within ascene r<strong>at</strong>her than the SO 2flux from a volcanic source,SO 2fluxes can be estim<strong>at</strong>ed if some assumptions aremade concerning SO 2lifetime <strong>and</strong> hence plume dispersion.A common assumption for volcanoes in tropicalenvironments is th<strong>at</strong> rapid SO 2removal (e.g.,Oppenheimer et al. 1998) results in no SO 2persisting formore than 24 hours, <strong>and</strong> in this case the daily tomstotals would represent a minimum daily SO 2flux. Thisis a significant assumption, <strong>and</strong> is dependent on plumeheight <strong>and</strong> environmental factors, which are <strong>of</strong>ten poorlyconstrained. Applying this reasoning to the recent tomsd<strong>at</strong>a for Nyiragongo produces SO 2fluxes in excess <strong>of</strong>50 kt day -1 (~580 kg s -1 ) on several occasions (Figure 3).The altitude <strong>of</strong> the persistent plume from Nyiragongohas been estim<strong>at</strong>ed by gvo to reach 4-6 km, though itis <strong>of</strong>ten lower (gvo, personal communic<strong>at</strong>ion, 2002).Altitudes <strong>of</strong> ~5 km or more are above the freezing levelin a st<strong>and</strong>ard tropical <strong>at</strong>mosphere (e.g., Figure 2) <strong>and</strong>suggest th<strong>at</strong> ice form<strong>at</strong>ion probably occurs within higherplumes as emitted <strong>and</strong> entrained w<strong>at</strong>er vapour freezes.Scavenging <strong>of</strong> SO 2in explosive eruption clouds hasbeen linked to form<strong>at</strong>ion <strong>of</strong> ice (e.g., Rose et al. 1995),with subsequent SO 2release on abl<strong>at</strong>ion <strong>of</strong> the ice, <strong>and</strong><strong>at</strong> Nyiragongo this process may act to reduce the SO 2mass detected by toms close to the vent. At times thedetected SO 2is a distinct mass situ<strong>at</strong>ed some distancefrom the volcano (as opposed to a plume ‘<strong>at</strong>tached’ tothe volcano), suggesting th<strong>at</strong> downwind release <strong>of</strong> SO 2due to abl<strong>at</strong>ion <strong>of</strong> ice may be occurring. More detailedinvestig<strong>at</strong>ions <strong>of</strong> this effect are planned for the future.The cumul<strong>at</strong>ive SO 2emissions from Nyiragongo observedby ep toms to d<strong>at</strong>e (7 October 2002 – 17 November2003) amount to ~2 Mt. However, due to d<strong>at</strong>a gaps,meteorological factors <strong>and</strong> vari<strong>at</strong>ions in plume heightthis does not represent the total mass <strong>of</strong> SO 2emittedby the volcano; quantifiable SO 2plumes fromNyiragongo were observed on only 117 days during this406-day period. Extrapol<strong>at</strong>ion <strong>of</strong> this figure to an estim<strong>at</strong>e<strong>of</strong> the actual SO 2production is difficult, particularlyfor the longer measurement gaps such as January-April 2003 (Figure 3). In the absence <strong>of</strong> a more robusttechnique the d<strong>at</strong>a gaps have been filled using an averageSO 2emission computed from the sequence <strong>of</strong>measurements closest to each gap. Using this method,the estim<strong>at</strong>ed total SO 2mass released in the ~13 monthsamounts to 6.9 ± 2.1 Mt (30% error on toms SO 2retrievals assumed), with an average SO 2emission <strong>of</strong>~16 kt day -1 (~185 kg s -1 ). This daily average is compa-8