Thermal monitoring of volcanoes from space
Thermal monitoring of volcanoes from space
Thermal monitoring of volcanoes from space

Create successful ePaper yourself
Turn your PDF publications into a flip-book with our unique Google optimized e-Paper software.
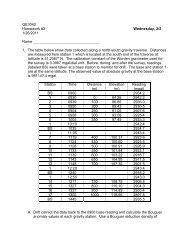
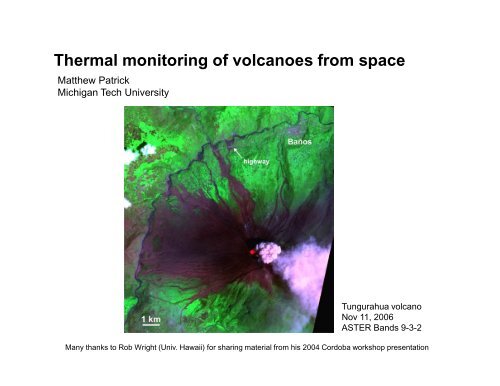
<strong>Thermal</strong> <strong>monitoring</strong> <strong>of</strong> <strong>volcanoes</strong> <strong>from</strong> <strong>space</strong>Matthew PatrickMichigan Tech UniversityTungurahua volcanoNov 11, 2006ASTER Bands 9-3-2Many thanks to Rob Wright (Univ. Hawaii) for sharing material <strong>from</strong> his 2004 Cordoba workshop presentation
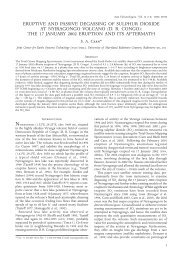
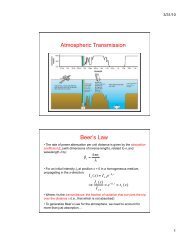
What can satellite thermal <strong>monitoring</strong> provide?2) Identifying precursory activity: Santa Ana, El Salvador, 2005MODVOLC (MODIS) anomaliesCourtesy <strong>of</strong> SNET and Smithsonian Inst.• Only 3 MODVOLC anomalies have ever been observed at Santa Ana: July 27, 2005; Aug 27, 2005; Aug 30,2005. Major eruption occurred on Oct 1, 2005.• Anomalies corresponded with RSAM peak and anomalous ground observations (incandescent fumaroles)
Outline1) What can thermal <strong>monitoring</strong> tell us about volcanism?2) Basic principles <strong>of</strong> thermal <strong>monitoring</strong>3) Current satellite sensors and data available4) High-resolution versus low-resolution data5) Monitoring and detecting thermal anomalies6) MODVOLC: automated <strong>monitoring</strong> using MODIS7) Univ. Hawaii GOES system8) Final remarks
Basic principles <strong>of</strong> thermal <strong>monitoring</strong>1) Radiant heat output: determined by Planck equationPlanck equation:Hotter objects have peak emission at shorter wavelengthsM =Ml = spectral radiant exitance (W m -2 µm -1 )C1 = 3.74151 × 10 8 W m -2 µm -4C2 = 1.43879 × 10 4 µm Kλ= wavelength (µm)C 1λ 5 [exp(C 2 /λT)-1]
Basic principles <strong>of</strong> thermal <strong>monitoring</strong>2) Radiant heat output: determined by Planck equation• Planck’s Blackbody Radiation Law: spectral distribution <strong>of</strong> energy radiated by a blackbody as a function <strong>of</strong>temperatureWien’s Law: turning point <strong>of</strong> the Planck functionStefan’s Law: integral <strong>of</strong> the Planck functionCourtesy R. Wright
Basic principles <strong>of</strong> thermal <strong>monitoring</strong>3) Stefan-Boltzmann and Wein’s displacement lawStefan-Boltzmann law: to calculate total emitted radiant heat flux (<strong>from</strong> integrating Planck function)M T = T M T = W m -2 = 5.669 × 10 -8 W m -2 K -4Wein’s displacement law: to calculate wavelength <strong>of</strong> peak emission (<strong>from</strong> derivative <strong>of</strong> Planckfunction set to zero)λ m = b/Tλ m = µmb = 2898 µm KWhat is peak emission wavelength <strong>of</strong>:• Earth (15 o C)?• Active lava (1000 o C)?• Sun (5500 o C)?Courtesy R. Wright
Basic principles <strong>of</strong> thermal <strong>monitoring</strong>4) Electromagnetic spectrumFor <strong>monitoring</strong> temperatures (<strong>of</strong> lava and background Earth), we areinterested in wavelengths <strong>from</strong> 1 to 14 µm
Basic principles <strong>of</strong> thermal <strong>monitoring</strong>5) Satellites use narrow-band detectorsExample: Landsat ETM+
Basic principles <strong>of</strong> thermal <strong>monitoring</strong>6) Bands are chosen based on atmospheric transmissionExample: ASTER and Landsat ETM+ satellite bandsτ
Basic principles <strong>of</strong> thermal <strong>monitoring</strong>7) Calculating apparent temperature <strong>from</strong> measured radiance• Invert modified Planck function to obtain temperature <strong>from</strong> spectral radianceT =C 2λln[1+ C 1 /(λ 5 L )]• λ is the band’s central wavelength (a reasonable approx. for narrow bands)• L λ is spectral radiance, as measured by the satelliteSo far, so good, but…….1) Planck’s blackbody radiation law describes the spectral emissive power <strong>of</strong> a blackbody2) Formula does not account for radiance absorbed by atmosphereCourtesy R. Wright
Basic principles <strong>of</strong> thermal <strong>monitoring</strong>8) Real surfaces are not blackbodies (but can be pretty close)• Blackbody: Emits energy at all wavelengths and in all directions at maximum rate possiblefor given temperature – Ideal radiator (emissivity=1)• Emissivity: ratio <strong>of</strong> emitted energy to that <strong>of</strong> a blackbody at the same kinetic temperatureCourtesy R. Wright
Basic principles <strong>of</strong> thermal <strong>monitoring</strong>9) Calculating real (kinetic) surface temperature <strong>from</strong> measured radiance• Inversion <strong>of</strong> Planck function only gives Apparent Radiant Temperature• Apparent Radiant Temperature < True Kinetic Temperature• Must account for emissivity AND the imperfect transmission <strong>of</strong> radiance by theatmosphereT kin =c 2ln[1+ c 1 /( 5 L )]This provides kinetic temperature for pixel as a whole – i.e. assumesuniform temperature distribution within pixelCourtesy R. Wright
Basic principles <strong>of</strong> thermal <strong>monitoring</strong>10) Mixed pixel problem• Volcanic surfaces rarely thermally homogenous• Measured L l integrated over all radiators presentwithin the pixel at the time <strong>of</strong> samplingnL n (λ) = f i L(λ, T i )i=1• A single temperature will fail to describe the actualsub-pixel temperature distribution• Simple and more complicated methods exist for unmixingthe mixed thermal emission spectrum – however,all make major assumptionsIn operational <strong>monitoring</strong>, unmixing pixels is not practical – thus, focus istypically on relative changes in “apparent” (i.e. whole pixel) temperaturesCourtesy R. Wright
Basic principles <strong>of</strong> thermal <strong>monitoring</strong>11) Reflection versus emission (nighttime versus daytime)The problem:Shortwave IR bands (2-4 microns) have highest sensitivity to emitted radiation <strong>from</strong>high temperature volcanic surfaces (e.g. active lava)But...Those bands contain significant amounts <strong>of</strong> reflected radiation <strong>from</strong> sunSolution:In daytime imagery: Recognize potential impact <strong>of</strong> reflected radiation, and decreasedsensitivity to volcanic signal (due to higher ‘noise’ levels)Or use nighttime imagery: no reflected radiation at night, obviouslyLongwave IR bands (8-12 microns) are not sensitive to reflected radiation, but theyare less sensitive to small areas <strong>of</strong> high temperature volcanic surfaces
Basic principles <strong>of</strong> thermal <strong>monitoring</strong>12) Other practical limitationsa) Satellite repeat periodsHigh spatial resolution (tens <strong>of</strong> m) = low temporal resolution (tens <strong>of</strong> days)Low spatial resolution (1 km) = high temporal resolution (daily)b) Cloud cover: Dense clouds can completely block IR <strong>from</strong> even large, activelava flows• A limitation in Central America, varies by seasonc) Saturation/response-pixel – pixels over active lava surfaces <strong>of</strong>ten saturate(reach highest measurable value), which affects neighboring pixels
Outline1) What can thermal <strong>monitoring</strong> tell us about volcanism?2) Basic principles <strong>of</strong> thermal <strong>monitoring</strong>3) Current satellite sensors and data available4) High-resolution versus low-resolution data5) Monitoring and detecting thermal anomalies6) MODVOLC: automated <strong>monitoring</strong> using MODIS7) Univ. Hawaii GOES system8) Final remarks
Current satellite sensors and data availableHigh resolution thermal dataASTERVisible (3 bands): 15 mShortwave (6 bands): 30 m<strong>Thermal</strong> (5 bands): 90 mLandsat ETM+Visible (1 band): 15 mVisible (3 bands): 30 mShortwave (4 bands): 30 m<strong>Thermal</strong> (1 band): 60 mSanta AnaSanta AnaFeb 3, 2001 May 3, 2005Repeat period: on demand (sporadic)Cost: 80 USD/sceneRepeat period: 14 daysCost: 250 USD/sceneData after May 30, 2003 have scanline corrector problem
Current satellite sensors and data availableLandsat Thematic Mapper• 7 bandpasses (3 VIS, 1 NIR, 2 SWIR, 1 TIR)• LEO• 30-m IFOV (TIR = 120-m)• 16 day repeat; 185 km swath• 8-bit data• Large archive <strong>of</strong> volcano data• Very, very few night-time data sets• Still going strongCourtesy R. Wright
Current satellite sensors and data availableLandsat Enhanced Thematic Mapper Plus• ETM+: like TM but enhanced• LEO• 15-m PAN band• 60-m TIR band (high & low gain)• Scanning mechanism malfunctioned inMay 03Courtesy R. Wright
Current satellite sensors and data availableAdvanced Spaceborne <strong>Thermal</strong> Emission andReflection Radiometer• ASTER: “Landsat-class” instrument• LEO• 14 bandpasses (2 VIS, 1 NIR, 6 SWIR, 5TIR)• 30-m IFOV (VIS & NIR); 30-m (SWIR);90-m (TIR)• Stereoscopic capability (NIR)• 60 km swath• VIS/NIR/SWIR = 8-bit; TIR=12-bit• Limited duty cycle but a lot <strong>of</strong> volcanodata including night-time scenes• Not experimental, but no replacementplannedCourtesy R. Wright
Current satellite sensors and data availableEarth Observing-1 Hyperion• Only commercially available <strong>space</strong>-based hyperspectralimager• LEO• 242 contiguous wavebands between 0.357 – 2.479µm (196 unique calibrated wavebands)• 30-m IFOV• 7.5 km swath• 12-bit data• Very low duty cycle (experimental satellite)• Regular night-time data takes over active<strong>volcanoes</strong>
Current satellite sensors and data availableLow resolution dataAVHRR MODIS GOES• Polar orbiting• 1 km pixel size• 5 bands• Multiple operatingsatellites (>1 scene/day)• Polar orbiting• Visible: 250 m pixel size• <strong>Thermal</strong>: 1 km pixel size• 36 bands• Two operating satellites(Terra and Aqua)• Geostationary• Visible: 1 km pixel size• <strong>Thermal</strong>: 4 km pixel size• 5 bands• Image every 15-30 min.• Only westernhemisphere
Current satellite sensors and data availableAdvanced Very High Resolution Radiometer• LEO• Meteorological/environmental <strong>monitoring</strong> sensor• 5 bandpasses (NOAA 12+). 1 VIS, 1 NIR, 1 SWIR,2 TIR• IFOV = 1.1 km at nadir (much large <strong>of</strong>f-nadir)• 10-bit dataCourtesy R. Wright
Current satellite sensors and data availableGeostationary Operational Environmental Satellite• GOES: meteorological satellite• Geostationary orbit• 5 bandpasses (GOES 8-10). 1 VIS, 1 SWIR, 1MIR, 2 TIR• 1-km IFOV (VIS); 4-km (SWIR, TIR); 8 km (MIR)• 10-bit data• Temporal resolution: 7.5-30 min.Courtesy R. Wright
Current satellite sensors and data availableModerate Resolution Imaging Spectroradiometer• MODIS: environmental <strong>monitoring</strong> sensor• LEO• 36 bandpasses: 11 VIS; 5 NIR; 10 SWIR; 10 TIR)• 250-m IFOV (bands 1 & 2); 500-m (bands 3-7);1000-m (bands 8-36)• 12-bit data• 48-hour repeat frequency (sort <strong>of</strong>….)• Two MODIS sensors currently in orbitCourtesy R. Wright
Outline1) What can thermal <strong>monitoring</strong> tell us about volcanism?2) Basic principles <strong>of</strong> thermal <strong>monitoring</strong>3) Current satellite sensors and data available4) High-resolution versus low-resolution data5) Monitoring and detecting thermal anomalies6) MODVOLC: automated <strong>monitoring</strong> using MODIS7) Univ. Hawaii GOES system8) Final remarks
High-resolution versus low-resolution dataHigh resolution thermal dataStrength 1: Gives an idea <strong>of</strong> eruption style (not just presence <strong>of</strong> activity)Example: Mount Belinda (Montagu Island) eruption, South Sandwich IslandsMODIS (1 km) ASTER thermal-visible composite (15-30 m)Appears to be erupting...butstyle unknown90 m wide lava flow sourced <strong>from</strong>summit crater extending 3.5 km toreach the sea
High-resolution versus low-resolution dataHigh resolution thermal dataStrength 2: Provides view <strong>of</strong> passive heat emission (e.g. fumaroles)Hightemperaturefumaroles inSanta AnacraterSanta AnaLowtemperaturefumaroles onIzalco summitIzalcoASTER nighttime thermal IR image: 16 Jan 2006
High-resolution versus low-resolution dataHigh resolution thermal dataWeakness 1: Temporal resolution is poor (tens <strong>of</strong> days – if cloud free)Weakness 2: Costly (80-250 USD per scene)Example: Search for ASTER data over Fuego volcano over last 7 months – just 4 scenes
High-resolution versus low-resolution dataLow resolution thermal dataStrength 1: Excellent temporal resolutionExample: 36 MODIS images for Fuego over two weeks (May 20 and June 3, 2007)Strength 2: Often free (AVHRR and MODIS)
High-resolution versus low-resolution dataWeakness 1: Low resolution!Low resolution thermal dataExample: Mount Belinda (Montagu Island) eruption, South Sandwich IslandsMODIS (1 km) ASTER thermal-visible composite (15-30 m)Appears to be erupting...butstyle unknown90 m wide lava flow erupted <strong>from</strong>summit crater, extending 3.5 km toreach the sea
Outline1) What can thermal <strong>monitoring</strong> tell us about volcanism?2) Basic principles <strong>of</strong> thermal <strong>monitoring</strong>3) Current satellite sensors and data available4) High-resolution versus low-resolution data5) Monitoring and detecting thermal anomalies6) MODVOLC: automated <strong>monitoring</strong> using MODIS7) Univ. Hawaii GOES system8) Final remarks
<strong>Thermal</strong> <strong>monitoring</strong> approachesMethods:Manual:1) Detection by eye and recordingAutomated:2) Simple threshold3) Band differential (shortwave IR minus longwave IR)4) Comparison with average background (RATS)
<strong>Thermal</strong> <strong>monitoring</strong> approaches‘High’ versus ‘low’ spatial resolution data• Many <strong>space</strong>-based resources available that acquiredata in the important 4 and 12 µm bandpasses• High spatial resolution data can detect smaller, lessintense thermal anomalies, but…..ATSR – 1 km pixels• Their low temporal resolution, low duty cycle, datavolume make them (largely) impractical as volcano<strong>monitoring</strong> tools (but possible OK as a volcano“surveying tool”; see work <strong>of</strong> Rick Wessels)• Low spatial, high temporal resolutionenvironmental/meteorological satellites are the bestbetLandsat TM – 30 m pixelsCourtesy R. Wright
<strong>Thermal</strong> <strong>monitoring</strong> approachesMethod 1: Brute force• Acquire, enhance and manually inspect the imagesMODIS band 22 (3.959 µm)Courtesy R. Wright
<strong>Thermal</strong> <strong>monitoring</strong> approachesMethod 2: Simple thresholding <strong>of</strong> the 4 mm radiance signal• Pixels with a 4 µm radiance > pre-determined threshold are classified as hot-spots•Totally insensitive to variations in ambient background temperature (season, geography…)• We need methods that account for variation <strong>of</strong> non-volcanic sources <strong>of</strong> scene radianceCourtesy R. Wright
<strong>Thermal</strong> <strong>monitoring</strong> approachesMethod 3: The Spectral Comparison MethodBT λ =C 2λln[1+ C 1 /(λ 5 L )]• Calculate T for each pixel• Automatically accounts for variance in ambient background• Flag pixel as a ‘hot-spot’ pixel if T > chosen threshold• Detects sub-pixel temperature ‘contrasts’, BUT….• Needs to include more checks to avoid returning ‘false positives’caused by cloud edges, non-uniform surface emissivity,atmospheric transmissivity….)Courtesy R. Wright
<strong>Thermal</strong> <strong>monitoring</strong> approachesMethod 4: A multi-temporal approach• Pergola et al. (2004) use a multi-temporal approach at Etna and StromboliT 4 (x,y,t) =T 4 (x,y,t) – T 4ref (x,y)σT 4 (x,y)• ‘Stack’ co-registered images <strong>of</strong> an area <strong>of</strong>interest• Characterise the thermal ‘behaviour’ <strong>of</strong>each pixel over an extended period <strong>of</strong>time• Hot-spots identified when a pixel beginsto behave (thermally) ‘differently’ than ithas in the past• Great potential for detecting lowtemperature events Courtesy R. Wright
<strong>Thermal</strong> <strong>monitoring</strong> approachesWhat kind <strong>of</strong> activity can we detect?• Ability to detect the thermal emission associated with volcanic activity depends on:• The temperature <strong>of</strong> the lava/process• The area it covers• Its longevityEasierBasaltic lava flowsBasaltic lava lakesBlock lava flowsLava domesHarderStrombolian activityPhreatic activityPhreatomagmatic activityFumarolic activity
<strong>Thermal</strong> <strong>monitoring</strong> approachesCase study 1: Cycles <strong>of</strong> dome growth at Popocatepetl• Dome growth resumed at Popocatepetl in 1996• Satellite remote sensing only method useful for routine observations <strong>of</strong> the crater interior• GOES images summit crater once every 15 minutes• High temporal but low spatial resolution: what can we learn?Courtesy R. Wright
<strong>Thermal</strong> <strong>monitoring</strong> approachesCase study 1: Dome growth at Popo• 10 × 10 kernal centred at Popo’s summit• Record the peak radiance <strong>from</strong> the group (P r ) and the mean <strong>of</strong> the remainder (B r )• In the absence <strong>of</strong> any time-independent forcing mechanism, P r and B r should be well correlatedCourtesy R. WrightWright et al., 2002
<strong>Thermal</strong> <strong>monitoring</strong> approachesCase study 1: Dome growth at Popo• However, a volcanic radiance source, radiance <strong>from</strong> which is time-independent will cause P rand B r to de-couple• Use adjacent inactive volcano to normalise for environmental effects• Easy to identify volcanic activity in GOES radiance time-seriesCourtesy R. WrightWright et al., 2002
<strong>Thermal</strong> <strong>monitoring</strong> approachesCase study 1: Dome growth at Popo• Elevated GOES radiancecoincides temporally with periods<strong>of</strong> heightened explosivity <strong>of</strong> thedome• Periods <strong>of</strong> heightened explosivityfollow substantial decreases inSO 2 flux• Restricted degassing =overpressure = explosionsCourtesy R. WrightWright et al., 2002
<strong>Thermal</strong> <strong>monitoring</strong> approachesCase study 2: Dome growth at LascarWooster and Rothery, 1997• Cyclic activity described in terms <strong>of</strong> generation <strong>of</strong> overpressure within the dome due todegassing induced decreases in permeability and compaction• Satellite measurements <strong>of</strong> radiance corroborate physical modelCourtesy R. Wright
<strong>Thermal</strong> <strong>monitoring</strong> approachesCase study 3: Estimating lava eruption ratesHarris et al, 1997• Very easy to detect lava flows• Spectral radiance <strong>from</strong> the flowsurface is related to the area <strong>of</strong>lava at a given temperaturewithin the field <strong>of</strong> view• In other words….the higher theeruption rate the greater arealava will be able to spread beforeit cools to a given temperature,and the higher the correspondingat-satellite radiance will be• Pieri and Baloga (1986)• Harris et al. (1997)• Wright et al. (2001)Courtesy R. Wright
Outline1) What can thermal <strong>monitoring</strong> tell us about volcanism?2) Basic principles <strong>of</strong> thermal <strong>monitoring</strong>3) Current satellite sensors and data available4) High-resolution versus low-resolution data5) Monitoring and detecting thermal anomalies6) MODVOLC: automated <strong>monitoring</strong> using MODIS7) Univ. Hawaii GOES system8) Final remarks
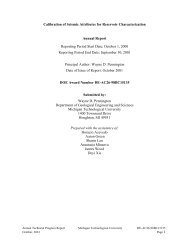
MODVOLCWhat does it do? Detects high temperature pixels (<strong>from</strong> <strong>volcanoes</strong>, vegetationfires and industrial activity) in MODIS imagery. MODIS images every spot onthe Earth about twice a day.Who developed it? Rob Wright, Luke Flynn and others at Hawaii Institute <strong>of</strong>Geophysics and Planetology, University <strong>of</strong> HawaiiWright R, Flynn LP, Garbeil H, Harris AJL, & Pilger E. 2004. MODVOLC: near-real-timethermal <strong>monitoring</strong> <strong>of</strong> global volcanism. Journal <strong>of</strong> Volcanology and GeothermalResearch, 135, 29-49.Where are the data?http://modis.higp.hawaii.edu
MODVOLCHow does it work? Uses a spectral comparison approach (shortwave IR minuslongwave IR) to isolate high temperature pixels. Spectral comparison result isnormalized to reduce false positives.Normalized temperature index:NTI =Band 22 – Band 32Band 22 + Band 32Band 22: 4 micronsBand 32: 12 micronsIf NTI is greater than -0.8, pixel is tagged as alert pixel
MODVOLC
MODVOLCStrengths:• Daily coverage <strong>of</strong> every volcano on Earth• Easy to use interface• Free, available over internetLimitations:• Threshold is high: can only detect significant eruptive activity• Threshold is high: can only detect significant eruptive activity• Typically does not detect ash-rich activity – better suited for effusive eruptions• As with all low-resolution sensors: Sometimes difficult to discriminate brush fires<strong>from</strong> volcanic activity• As with all infrared systems: clouds
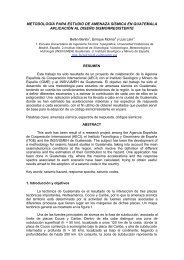
MODVOLC: strengths – worldwide coverage, easy to use interface
MODVOLC: limitations1) Discriminating volcanic activity <strong>from</strong> brush firesTwo things to consider:1) Proximity to knownactive vents2) Time <strong>of</strong> year
MODVOLC: limitationsBrush fires much more common in Central America in March-May2000-2005
MODVOLC: limitations2) Alerts may be seasonally biased, presumably due to cloud cover2000-2005
MODVOLC: limitations3) Eruptions can go undetected if any or all <strong>of</strong> the following are true:a) Eruption is short: consider repeat period <strong>of</strong> MODIS=12hoursb) Eruption is small: scale <strong>of</strong> eruptive products is minimalc) Eruption is ash-rich: ash plumes cool quicklyd) Eruption occurs underneath heavy cloud cover
MODVOLCPerformance in Central America, 2000-2007Eruptive activity detected at:1) Santiaguito: persistent dome extrusion2) Fuego: persistent effusive/explosive activity beginning Jan 20023) Pacaya: effusive/explosive activity starting in Jan 20054) Santa Ana (?): pre-eruptive intensification <strong>of</strong> fumarole field, 1 month before Oct 1, 2005phreatomagmatic eruption5) Arenal: persistent effusive/explosive activityEruptive activity missed at:1) Santa Ana: phreatomagmatic eruption on Oct 1, 20052) San Miguel: ash emissions in 2000-2007, minor ash eruption Jan 2002.3) San Cristobal: minor explosive activity and ash emission4) Concepcion: minor explosive eruptions Jan 2005, Feb-Apr 20075) Telica: minor ash-gas eruption in early 2000, small eruption in Nov 20046) Masaya: visible incandescence in Santiago crater, minor explosion in 2001
MODVOLCTwo useful derivative products <strong>from</strong> MODVOLCExample 1: Santiaguito-Short-term fluctuations likely due tocloud cover- No clear trends in above data-Pixel size is 1 km – so normal errorin location is about 1 km- Example above consistent withcentral vent activity
MODVOLCTwo useful derivative products <strong>from</strong> MODVOLCExample 2: Fuego- Large scale fluctuations aresignificant- High amplitude peaks aresignificant – note log scale – andcorrelate with distal alerts-Distal alerts (up to 4.5 km) aresignificant – exceed 1 km pixel size- Central vent activity punctuated bylava/pyroclastic flows
MODVOLC- Those plots show total radiative heat loss – but MODVOLC only outputs Band22 (4 microns) and 32 (12 microns) radiance.- How can total radiative heat loss be determined <strong>from</strong> two wavelength-specificradiances?Solution: empirical relation for these particular bands, courtesy <strong>of</strong>Kaufmann et al. (1998)E = 4.34 x 10 -19 (T 4h8 -T 4b8 )E = radiative heat loss in MWT 4h = 4 micron temperature <strong>of</strong> alert pixelT 4b = 4 micron temperature <strong>of</strong> backgroundKaufman, Y.J., Justice, C.O., Flynn, L.P., Kendall, J.D., Prins, E.M., Giglio, L., Ward, D.E., Menzel, W.P., Setzer, A.W.,1998. Potential global fire <strong>monitoring</strong> <strong>from</strong> EOS-MODIS. J. Geophys.Res. 103, 32215– 32238.
Outline1) What can thermal <strong>monitoring</strong> tell us about volcanism?2) Basic principles <strong>of</strong> thermal <strong>monitoring</strong>3) Current satellite sensors and data available4) High-resolution versus low-resolution data5) Monitoring and detecting thermal anomalies6) MODVOLC: automated <strong>monitoring</strong> using MODIS7) Univ. Hawaii GOES system8) Final remarks
Univ. Hawaii GOES systemWhat does it do? Monitors radiance in GOES images, focusing on small areascentered around active <strong>volcanoes</strong>. GOES images every spot in the WesternHemisphere once every 15-30 minutes.Who developed it? Andy Harris others at Hawaii Institute <strong>of</strong> Geophysics andPlanetology, University <strong>of</strong> HawaiiHarris, A.J.L., Pilger, E., and Flynn, L.P., 2002. Web-based hot spot <strong>monitoring</strong> using GOES: what itis and how it works. Advances in Environmental Monitoring and Modeling, (http://www.kcl.ac.uk/ kis/schools/ hums/ geog/ advemm/ vol1no3.html) 1(3), 5-36.Harris, A.J.L., Pilger, E., Flynn, L.P., and Rowland, S.K., 2002. Real-Time Hot Spot Monitoring usingGOES: Case Studies <strong>from</strong> 1997-2000. Advances in Environmental Monitoring and Modeling,(http://www.kcl.ac.uk/kis/schools/hums/geog/advemm/vol1no3.html) 1(3), 134-151.Where are the data?http://goes.higp.hawaii.edu
Univ. Hawaii GOES system1) Example: Fuego volcano, GuatemalaSmithsonian GVN Weekly Bulletins, <strong>from</strong> INSIVUMEH:14-20 March 2007: Strombolian activity, lava flows, pyroclastic flows18-24 April 2007: Strombolian activity, lava overtopping crater, pyroclastic flows
Outline1) What can thermal <strong>monitoring</strong> tell us about volcanism?2) Basic principles <strong>of</strong> thermal <strong>monitoring</strong>3) Current satellite sensors and data available4) High-resolution versus low-resolution data5) Monitoring and detecting thermal anomalies6) MODVOLC: automated <strong>monitoring</strong> using MODIS7) Univ. Hawaii GOES system8) Final remarks