IDL Wavelet Toolkit User's Guide
IDL Wavelet Toolkit User's Guide
IDL Wavelet Toolkit User's Guide

You also want an ePaper? Increase the reach of your titles
YUMPU automatically turns print PDFs into web optimized ePapers that Google loves.
<strong>IDL</strong> <strong>Wavelet</strong><strong>Toolkit</strong> User’s<strong>Guide</strong><strong>IDL</strong> Version 7.1May 2009 EditionCopyright © ITT Visual Information SolutionsAll Rights Reserved0509<strong>IDL</strong>71WV
Restricted Rights NoticeThe <strong>IDL</strong>®, <strong>IDL</strong> Advanced Math and Stats, ENVI ® , and ENVI Zoom software programs and the accompanying procedures,functions, and documentation described herein are sold under license agreement. Their use, duplication, and disclosure are subject tothe restrictions stated in the license agreement. ITT Visual Information Solutions reserves the right to make changes to this documentat any time and without notice.Limitation of WarrantyITT Visual Information Solutions makes no warranties, either express or implied, as to any matter not expressly set forth in thelicense agreement, including without limitation the condition of the software, merchantability, or fitness for any particular purpose.ITT Visual Information Solutions shall not be liable for any direct, consequential, or other damages suffered by the Licensee or anyothers resulting from use of the software packages or their documentation.Permission to Reproduce this ManualIf you are a licensed user of these products, ITT Visual Information Solutions grants you a limited, nontransferable license toreproduce this particular document provided such copies are for your use only and are not sold or distributed to third parties. All suchcopies must contain the title page and this notice page in their entirety.Export Control InformationThe software and associated documentation are subject to U.S. export controls including the United States Export AdministrationRegulations. The recipient is responsible for ensuring compliance with all applicable U.S. export control laws and regulations. Theselaws include restrictions on destinations, end users, and end use.AcknowledgmentsENVI ® and <strong>IDL</strong> ® are registered trademarks of ITT Corporation, registered in the United States Patent and Trademark Office. ION, ION Script,ION Java, and ENVI Zoom are trademarks of ITT Visual Information Solutions.ESRI ® , ArcGIS ® , ArcView ® , and ArcInfo ® are registered trademarks of ESRI.Portions of this work are Copyright © 2008 ESRI. All rights reserved.Numerical Recipes is a trademark of Numerical Recipes Software. Numerical Recipes routines are used by permission.GRG2 is a trademark of Windward Technologies, Inc. The GRG2 software for nonlinear optimization is used by permission.NCSA Hierarchical Data Format (HDF) Software Library and Utilities. Copyright © 1988-2001, The Board of Trustees of the University of Illinois. Allrights reserved.NCSA HDF5 (Hierarchical Data Format 5) Software Library and Utilities. Copyright © 1998-2002, by the Board of Trustees of the University ofIllinois. All rights reserved.CDF Library. Copyright © 2002, National Space Science Data Center, NASA/Goddard Space Flight Center.NetCDF Library. Copyright © 1993-1999, University Corporation for Atmospheric Research/Unidata.HDF EOS Library. Copyright © 1996, Hughes and Applied Research Corporation.SMACC. Copyright © 2000-2004, Spectral Sciences, Inc. and ITT Visual Information Solutions. All rights reserved.This software is based in part on the work of the Independent JPEG Group.Portions of this software are copyrighted by DataDirect Technologies, © 1991-2003.BandMax ® . Copyright © 2003, The Galileo Group Inc.Portions of this computer program are copyright © 1995-1999, LizardTech, Inc. All rights reserved. MrSID is protected by U.S. Patent No. 5,710,835.Foreign Patents Pending.Portions of this software were developed using Unisearch’s Kakadu software, for which ITT has a commercial license. Kakadu Software. Copyright ©2001. The University of New South Wales, UNSW, Sydney NSW 2052, Australia, and Unisearch Ltd, Australia.This product includes software developed by the Apache Software Foundation (www.apache.org/).MODTRAN is licensed from the United States of America under U.S. Patent No. 5,315,513 and U.S. Patent No. 5,884,226.QUAC and FLAASH are licensed from Spectral Sciences, Inc. under U.S. Patent No. 6,909,815 and U.S. Patent No. 7,046,859 B2.Portions of this software are copyrighted by Merge Technologies Incorporated.Support Vector Machine (SVM) is based on the LIBSVM library written by Chih-Chung Chang and Chih-Jen Lin (www.csie.ntu.edu.tw/~cjlin/libsvm),adapted by ITT Visual Information Solutions for remote sensing image supervised classification purposes.<strong>IDL</strong> <strong>Wavelet</strong> <strong>Toolkit</strong> Copyright © 2002, Christopher Torrence.IMSL is a trademark of Visual Numerics, Inc. Copyright © 1970-2006 by Visual Numerics, Inc. All Rights Reserved.Other trademarks and registered trademarks are the property of the respective trademark holders.
ContentsChapter 1Introduction to the <strong>IDL</strong> <strong>Wavelet</strong> <strong>Toolkit</strong> ................................................. 5What Is the <strong>IDL</strong> <strong>Wavelet</strong> <strong>Toolkit</strong>? .................................................................................... 6<strong>IDL</strong> <strong>Wavelet</strong> <strong>Toolkit</strong> Architecture .................................................................................... 9Chapter 2Using the <strong>IDL</strong> <strong>Wavelet</strong> <strong>Toolkit</strong> .............................................................. 11Starting the <strong>Wavelet</strong> <strong>Toolkit</strong> ........................................................................................... 12<strong>Wavelet</strong> <strong>Toolkit</strong> Menu Description ................................................................................. 14<strong>Wavelet</strong> <strong>Toolkit</strong> Preferences ........................................................................................... 18<strong>Wavelet</strong> <strong>Toolkit</strong> Dataset Viewer ..................................................................................... 20Importing Data into the <strong>Wavelet</strong> <strong>Toolkit</strong> ........................................................................ 25<strong>Wavelet</strong> Viewer ............................................................................................................... 28<strong>Wavelet</strong> Power Spectrum ............................................................................................... 32Multiresolution Analysis in the <strong>Wavelet</strong> <strong>Toolkit</strong> ............................................................ 39<strong>Wavelet</strong> <strong>Toolkit</strong> Denoise Tool ........................................................................................ 41<strong>IDL</strong> <strong>Wavelet</strong> <strong>Toolkit</strong> 3
4Adding User Tools to the <strong>Wavelet</strong> <strong>Toolkit</strong> ...................................................................... 45Chapter 3Theory and Examples .......................................................................... 47<strong>Wavelet</strong> Transform .......................................................................................................... 48<strong>Wavelet</strong> Power Spectrum ................................................................................................. 49Denoise ............................................................................................................................ 51Multiresolution Analysis .................................................................................................. 54Bibliography .................................................................................................................... 55Chapter 4<strong>IDL</strong> <strong>Wavelet</strong> <strong>Toolkit</strong> Reference ............................................................. 57List of Commands by Functionality ................................................................................ 58WV_APPLET .................................................................................................................. 60WV_CW_WAVELET ..................................................................................................... 62WV_CWT ........................................................................................................................ 66WV_DENOISE ................................................................................................................ 69WV_DWT ........................................................................................................................ 74WV_FN_COIFLET ......................................................................................................... 78WV_FN_DAUBECHIES ................................................................................................ 80WV_FN_GAUSSIAN ...................................................................................................... 82WV_FN_HAAR .............................................................................................................. 85WV_FN_MORLET ......................................................................................................... 87WV_FN_PAUL ............................................................................................................... 90WV_FN_SYMLET .......................................................................................................... 93WV_IMPORT_DATA ..................................................................................................... 96WV_IMPORT_WAVELET ............................................................................................ 99WV_PLOT3D_WPS ...................................................................................................... 100WV_PLOT_MULTIRES ............................................................................................... 103WV_PWT ...................................................................................................................... 106WV_TOOL_DENOISE ................................................................................................. 108Index .................................................................................................... 111Contents<strong>IDL</strong> <strong>Wavelet</strong> <strong>Toolkit</strong>
Chapter 1Introduction to the <strong>IDL</strong><strong>Wavelet</strong> <strong>Toolkit</strong>This chapter discusses the following topics:What Is the <strong>IDL</strong> <strong>Wavelet</strong> <strong>Toolkit</strong>? . . . . . . . . . 6 <strong>IDL</strong> <strong>Wavelet</strong> <strong>Toolkit</strong> Architecture . . . . . . . . 9<strong>IDL</strong> <strong>Wavelet</strong> <strong>Toolkit</strong> 5
6 Chapter 1: Introduction to the <strong>IDL</strong> <strong>Wavelet</strong> <strong>Toolkit</strong>What Is the <strong>IDL</strong> <strong>Wavelet</strong> <strong>Toolkit</strong>?The <strong>IDL</strong> <strong>Wavelet</strong> <strong>Toolkit</strong> consists of a set of graphical user interfaces (GUI) and <strong>IDL</strong>routines for wavelet analysis of multi-dimensional data.MotivationUsers<strong>Wavelet</strong> analysis is becoming a popular technique for data and image analysis. Bydecomposing a signal using a particular wavelet function, one can construct a pictureof the energy within the signal as a function of both spatial dimension (or time) andwavelet scale (or frequency). The wavelet transform is used in numerous fields suchas geophysics (seismic events), medicine (EKG and medical imaging), astronomy(image processing), and computer science (object recognition and imagecompression). The technique is flexible and robust, yet it is fast enough to be used inreal-time image processing.A set of standard wavelet techniques have been developed which make it possible forthe average user to apply the wavelet method with confidence. Recent advances insignificance testing and cross-wavelet analysis have also enhanced the acceptabilityof wavelet analysis within the scientific community. Nevertheless, the calculation ofthe wavelet transform and the display of the output requires considerable experience.The <strong>IDL</strong> <strong>Wavelet</strong> <strong>Toolkit</strong> is designed for a wide audience, ranging from the casualuser who wishes to explore the possibilities of wavelet analysis, to the scientist orengineer who wants to produce robust and complex results.Potential users and their applications include:• Students— introduction to wavelets, graphical analysis;• Engineers— data analysis, signal processing, data compression;• Scientists— data analysis, filtering and denoising, cross-wavelet;• Computer scientists— image compression, speed of operations;• Mathematicians— explore wavelet families, test out new analysis techniques.ApplicationsExamples of specific applications are:What Is the <strong>IDL</strong> <strong>Wavelet</strong> <strong>Toolkit</strong>?<strong>IDL</strong> <strong>Wavelet</strong> <strong>Toolkit</strong>
Chapter 1: Introduction to the <strong>IDL</strong> <strong>Wavelet</strong> <strong>Toolkit</strong> 7Features• Time-series analysis— time-scale power spectrum, noise filtering,multiresolution analysis;• Self-similar series— fractals, long-memory processes;• Turbulence— detection of coherent structures;• Signal processing— filtering and denoising;• Image processing— edge detection, compression, enhancement.The <strong>IDL</strong> <strong>Wavelet</strong> <strong>Toolkit</strong> has the following features:<strong>Wavelet</strong> AppletThe <strong>Toolkit</strong> Applet lets you manage your projects, import data and wavelets,visualize the results, and add your own user tools.Continuous <strong>Wavelet</strong> TransformAllows you to compute the continuous wavelet transform on one-dimensionalvectors. This routine is written in <strong>IDL</strong> .pro code.Discrete <strong>Wavelet</strong> TransformAllows you to compute the discrete wavelet transform (partial or full) on multidimensionaldata. These routines are written in C and contained in the <strong>IDL</strong> waveletdlm.<strong>Wavelet</strong> FunctionsThe <strong>Toolkit</strong> comes with several wavelet functions that are accessible both inside theApplet and from your own programs. You can easily add your own wavelet functionsto the <strong>Toolkit</strong>.3D <strong>Wavelet</strong> Power SpectrumCallable from within the Applet and from your own programs, the visualizer plots thewavelet power as a three-dimensional surface, with optional contour lines. You canrotate, translate, and find the power at a particular location.Multiresolution AnalysisStand alone or callable from the Applet, this routine produces plots for the smooth(low pass), detail (band-pass), and rough (high-pass) components of your data.<strong>IDL</strong> <strong>Wavelet</strong> <strong>Toolkit</strong>What Is the <strong>IDL</strong> <strong>Wavelet</strong> <strong>Toolkit</strong>?
8 Chapter 1: Introduction to the <strong>IDL</strong> <strong>Wavelet</strong> <strong>Toolkit</strong>Denoise ToolThis widget tool enables you to denoise your vector or image array by thresholding(hard or soft) either by cumulative power or coefficient number.Dataset ViewerManage the datasets within each project by importing new data, viewing data values,and customizing the data fields.Import DataYou can import data from a variety of file formats: ASCII, binary, image (BMP,JPEG, PNG, PPM, SRF, TIFF, DICOM), and WAV audio. Image files can be eitherindexed color (8- or 16-bit) or TrueColor (24-bit). You can also import data directlyfrom the <strong>IDL</strong>> command prompt.User ToolsYou can extend the functionality of the <strong>IDL</strong> <strong>Wavelet</strong> <strong>Toolkit</strong> by adding your owntools.What Is the <strong>IDL</strong> <strong>Wavelet</strong> <strong>Toolkit</strong>?<strong>IDL</strong> <strong>Wavelet</strong> <strong>Toolkit</strong>
Chapter 1: Introduction to the <strong>IDL</strong> <strong>Wavelet</strong> <strong>Toolkit</strong> 9<strong>IDL</strong> <strong>Wavelet</strong> <strong>Toolkit</strong> ArchitectureFile OrganizationThe <strong>Toolkit</strong> consists of the following components:• Source (.pro) files in the wavelet directory;• A bitmaps subdirectory with button bitmaps;• The data subdirectory with sample data files;• The Online help manual in the <strong>IDL</strong> help directory;• The DLM (Dynamically Loadable Module) in the <strong>IDL</strong> bin directory.NoteYou are encouraged to view the source files for details on implementation andtechnique. You are also welcome to modify the source files, however, it is stronglyencouraged that you copy the files to your own directory first. By modifying the<strong>IDL</strong> !PATH variable you can ensure that your routines are compiled first. See“!PATH” (<strong>IDL</strong> Reference <strong>Guide</strong>) for more information.StructureThe <strong>IDL</strong> <strong>Wavelet</strong> <strong>Toolkit</strong> consists of three layers. The topmost layer is the <strong>Wavelet</strong>Applet, which allows you to import data and wavelet functions, and access variousvisualization and tool routines. The middle layer is the set of compound widgets andwidget tools for visualization and analysis. These tools are accessible both from the<strong>Wavelet</strong> Applet and from your own routines. The lowest layer are the wavelet API(application programming interface) that consist of the wavelet functions, the wavelettransform, and the import data routine.<strong>IDL</strong> <strong>Wavelet</strong> <strong>Toolkit</strong><strong>IDL</strong> <strong>Wavelet</strong> <strong>Toolkit</strong> Architecture
10 Chapter 1: Introduction to the <strong>IDL</strong> <strong>Wavelet</strong> <strong>Toolkit</strong><strong>IDL</strong> <strong>Wavelet</strong> <strong>Toolkit</strong> Architecture<strong>IDL</strong> <strong>Wavelet</strong> <strong>Toolkit</strong>
Chapter 2Using the <strong>IDL</strong> <strong>Wavelet</strong><strong>Toolkit</strong>This chapter discusses the following topics:Starting the <strong>Wavelet</strong> <strong>Toolkit</strong> . . . . . . . . . . . . 12<strong>Wavelet</strong> <strong>Toolkit</strong> Menu Description . . . . . . . 14<strong>Wavelet</strong> <strong>Toolkit</strong> Preferences . . . . . . . . . . . . 18<strong>Wavelet</strong> <strong>Toolkit</strong> Dataset Viewer . . . . . . . . . 20Importing Data into the <strong>Wavelet</strong> <strong>Toolkit</strong> . . . 25<strong>Wavelet</strong> Viewer . . . . . . . . . . . . . . . . . . . . . . 28<strong>Wavelet</strong> Power Spectrum . . . . . . . . . . . . . . 32Multiresolution Analysis in the <strong>Wavelet</strong> <strong>Toolkit</strong>39<strong>Wavelet</strong> <strong>Toolkit</strong> Denoise Tool . . . . . . . . . . 41Adding User Tools to the <strong>Wavelet</strong> <strong>Toolkit</strong> . 45<strong>IDL</strong> <strong>Wavelet</strong> <strong>Toolkit</strong> 11
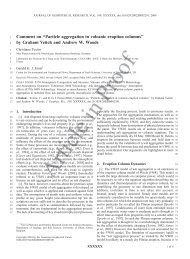
12 Chapter 2: Using the <strong>IDL</strong> <strong>Wavelet</strong> <strong>Toolkit</strong>Starting the <strong>Wavelet</strong> <strong>Toolkit</strong>To start the <strong>IDL</strong> <strong>Wavelet</strong> <strong>Toolkit</strong> type the following at the <strong>IDL</strong>> command prompt:wv_appletThis action compiles the wv_applet routines and starts up the main window, shownin the following figure. For other startup options see “WV_APPLET” on page 60.The window consists of Menu Items, the Toolbar, the Dataset Viewer, and a StatusBar at the bottom.Menu ItemsThe menu items, located at the top of the <strong>IDL</strong> <strong>Wavelet</strong> <strong>Toolkit</strong> window, allow you toperform various actions. These menu items are described in the next section.ToolbarThe toolbar is divided into five sections: File, Import, Edit, Visualize, and Help. Thetoolbar buttons allow you to easily access various menu items.When you position the mouse pointer over a toolbar the Status Bar displays adescription of its function.Dataset ViewerThe variables contained in your dataset are displayed in the dataset table, described in“<strong>Wavelet</strong> <strong>Toolkit</strong> Dataset Viewer” on page 20.Status BarThe Status Bar displays descriptions of the Toolbar buttons and the status of variousactions such as Open, Import, and Save. The Status Bar also provides warnings if, forexample, you select “Visualize...” without selecting a variable.Starting the <strong>Wavelet</strong> <strong>Toolkit</strong><strong>IDL</strong> <strong>Wavelet</strong> <strong>Toolkit</strong>
Chapter 2: Using the <strong>IDL</strong> <strong>Wavelet</strong> <strong>Toolkit</strong> 13Figure 2-1: The main <strong>Wavelet</strong> <strong>Toolkit</strong> window.<strong>IDL</strong> <strong>Wavelet</strong> <strong>Toolkit</strong>Starting the <strong>Wavelet</strong> <strong>Toolkit</strong>
14 Chapter 2: Using the <strong>IDL</strong> <strong>Wavelet</strong> <strong>Toolkit</strong><strong>Wavelet</strong> <strong>Toolkit</strong> Menu DescriptionThe main window has five items: File Menu, Edit Menu, Visualize Menu, ToolsMenu, and Help Menu. Each menu and its submenus is described below.File MenuThe File menu accesses and manipulates files.New AppletThis menu item or button starts a new <strong>Wavelet</strong> <strong>Toolkit</strong> applet with an empty dataset.Open Dataset...This menu item or button closes the current dataset and allows you to open up adifferent dataset. <strong>Wavelet</strong> datasets have the default filename suffix .sav and arewritten in <strong>IDL</strong> SAVE format. For more information, see “SAVE” (<strong>IDL</strong> Reference<strong>Guide</strong>).If the previous dataset has not been saved, then you will be prompted to save theprevious dataset first.SaveSelect this menu item or button to save the current dataset and preferences. If thedataset has not yet been saved, then you are prompted for a filename with the Save Asdialog.Save As...This menu item allows you to choose a new filename for the current dataset using theSave As dialog, and then saves the dataset to this file.Import...Select this menu item to import an external data file into the current dataset. Detailson allowable file formats and import options can be found in “<strong>Wavelet</strong> <strong>Toolkit</strong>Dataset Viewer” on page 20. You can also import data from the current <strong>IDL</strong> sessionusing the WV_IMPORT_DATA procedure.Preferences...This menu item opens up a Preferences dialog in which you can customize yourinteraction with the <strong>Wavelet</strong> <strong>Toolkit</strong>. The Default button restores the built-in default<strong>Wavelet</strong> <strong>Toolkit</strong> Menu Description<strong>IDL</strong> <strong>Wavelet</strong> <strong>Toolkit</strong>
Chapter 2: Using the <strong>IDL</strong> <strong>Wavelet</strong> <strong>Toolkit</strong> 15Exitoptions for all of the preferences. The OK button keeps all of the changes toPreferences. The Cancel button discards all of the changes.This menu item will close the current <strong>Wavelet</strong> <strong>Toolkit</strong> applet. Other <strong>Wavelet</strong> applets(either started from the command line or via the “New Applet” menu item) areunaffected.If you have made changes to the current dataset, then you will be prompted to savethe dataset before exiting.Edit MenuThe Edit Menu manipulates the Dataset Viewer.Move Variable LeftSelect this menu item or button to move the currently-selected variable to the left.Move Variable RightSelect this menu item or button to move the currently-selected variable to the right.View Data ValuesThis menu item or button displays the values for the currently-selected variable.Delete VariableSelect this menu item or button to delete the currently-selected variable or variables.You are asked for confirmation before the variables are removed.Visualize MenuThe Visualize Menu contains methods to graphically display and manipulate thewavelet transform.<strong>Wavelet</strong>sThis menu item or button starts up the wavelet compound widget, which allows youdisplay the available wavelet functions and their properties. You can also start thewavelet viewer using the WV_CW_WAVELET function from the <strong>IDL</strong>> commandprompt. The wavelet widget is described in “<strong>Wavelet</strong> Viewer” on page 28.<strong>IDL</strong> <strong>Wavelet</strong> <strong>Toolkit</strong><strong>Wavelet</strong> <strong>Toolkit</strong> Menu Description
16 Chapter 2: Using the <strong>IDL</strong> <strong>Wavelet</strong> <strong>Toolkit</strong><strong>Wavelet</strong> Power SpectrumThis menu item or button starts the three-dimensional viewer for the wavelet powerspectrum, using the currently-selected variable. You can also start the viewer usingthe WV_PLOT3D_WPS function from the <strong>IDL</strong>> command prompt. For moreinformation, see “WV_PLOT3D_WPS” on page 100. The wavelet power spectrumviewer is described in “<strong>Wavelet</strong> Power Spectrum” on page 32.Multiresolution AnalysisThis menu item or button starts the viewer for multiresolution analysis of thecurrently-selected variable. You can also start the viewer using theWV_PLOT_MULTIRES function from the <strong>IDL</strong>> command prompt. TheMultiresolution viewer is described in “Multiresolution Analysis in the <strong>Wavelet</strong><strong>Toolkit</strong>” on page 39.Tools MenuThe Tools Menu contains built-in and user-defined tools.DenoiseThis menu item starts the widget for denoising, filtering, and compression of thecurrently-selected variable. You can also start the viewer from the <strong>IDL</strong>> commandprompt by using the WV_TOOL_DENOISE function. The Denoise tool is describedin “<strong>Wavelet</strong> <strong>Toolkit</strong> Denoise Tool” on page 41.Other user tools...If you have added other tools then they will be displayed here. The currently-selectedvariable will be passed to the tool function. See “Adding User Tools to the <strong>Wavelet</strong><strong>Toolkit</strong>” on page 45.Help MenuThe Help Menu provides various help functions.<strong>IDL</strong> HelpThis menu item will start up the <strong>IDL</strong> Online Help manual.<strong>Wavelet</strong> <strong>Toolkit</strong> Menu Description<strong>IDL</strong> <strong>Wavelet</strong> <strong>Toolkit</strong>
Chapter 2: Using the <strong>IDL</strong> <strong>Wavelet</strong> <strong>Toolkit</strong> 17<strong>IDL</strong> <strong>Wavelet</strong> <strong>Toolkit</strong> HelpThis menu item or button will start up the online help manual for the <strong>IDL</strong> <strong>Wavelet</strong><strong>Toolkit</strong>.<strong>Wavelet</strong> ReadmeThis menu item will display the Readme file included with the <strong>Toolkit</strong>.<strong>Wavelet</strong> Release NotesThis menu item will display the Release Notes file included with the <strong>Toolkit</strong>.About <strong>IDL</strong> <strong>Wavelet</strong> <strong>Toolkit</strong>...Select this menu item to display information about the current version of <strong>IDL</strong> and the<strong>IDL</strong> <strong>Wavelet</strong> <strong>Toolkit</strong>.<strong>IDL</strong> <strong>Wavelet</strong> <strong>Toolkit</strong><strong>Wavelet</strong> <strong>Toolkit</strong> Menu Description
18 Chapter 2: Using the <strong>IDL</strong> <strong>Wavelet</strong> <strong>Toolkit</strong><strong>Wavelet</strong> <strong>Toolkit</strong> PreferencesThe Preferences dialog, under the File Menu, allows you to set various defaultpreferences and options for the currently active dataset.NoteThe Preferences are saved within each dataset rather than in a separate preferencesfile; each dataset can therefore have its own set of preferences. Note, however, thatopening a new dataset may change the current preferences. These new preferenceswill remain in effect until changed either via the Preferences window or by openinga different dataset.Default DirectorySet this option to your working directory. The <strong>Wavelet</strong> <strong>Toolkit</strong> will start all file openor save dialogs in this directory. This directory may be overridden if “RememberCurrent Directory” is set.Remember Current DirectorySet this option to cause the <strong>Wavelet</strong> <strong>Toolkit</strong> to store the directory selected within anyfile open or save dialogs, and to use this directory for future dialogs. If this option isnot set, the “Default Directory” will be used.Confirm ExitIf this option is set, the <strong>Wavelet</strong> <strong>Toolkit</strong> will ask you for confirmation when you exitthe <strong>Toolkit</strong>.Compress Save FilesSet this option to use file compression when saving dataset files. Compressed fileswill occupy less disk space than uncompressed files, but may be slower to save andopen.Stride FactorWhen importing large data arrays, the <strong>IDL</strong> <strong>Wavelet</strong> <strong>Toolkit</strong> will automaticallycalculate the X and Y stride values by dividing the length of vector arrays by the“Vector” stride factor, and each dimension of two-dimensional arrays by the “Array”stride factor. After the data is imported, you may change the X and Y stride values onthe Dataset Viewer. The minimum stride factor is 2.<strong>Wavelet</strong> <strong>Toolkit</strong> Preferences<strong>IDL</strong> <strong>Wavelet</strong> <strong>Toolkit</strong>
Chapter 2: Using the <strong>IDL</strong> <strong>Wavelet</strong> <strong>Toolkit</strong> 19TipTo force the stride values to always be set to 1 when importing data, set the stridefactors to a value larger than the maximum dimension for your data.“Defaults” ButtonPress this button to restore all of the preferences to their default settings.<strong>IDL</strong> <strong>Wavelet</strong> <strong>Toolkit</strong><strong>Wavelet</strong> <strong>Toolkit</strong> Preferences
20 Chapter 2: Using the <strong>IDL</strong> <strong>Wavelet</strong> <strong>Toolkit</strong><strong>Wavelet</strong> <strong>Toolkit</strong> Dataset ViewerYour dataset can consist of several different variables, each with a different dataformat. The Dataset Viewer, located in the middle of the <strong>Wavelet</strong> <strong>Toolkit</strong> applet,allows you to organize and manipulate your dataset.The variables are assigned a number and a name derived from the Variable name.You can sort the variables using the Move Variable Left and Move Variable Rightbuttons.Variable InformationEach variable contains a one-dimensional vector or two-dimensional array of datavalues. The data values can be of any numeric type, such as BYTE, INTEGER,FLOAT, etc.The variable also has several descriptor fields which you can modify, describedbelow and summarized in the table below. To modify a field, double-click with theleft-mouse button on the field. After editing the field, press the key to keepyour changes or, click outside of the table to discard your changes.TypeThis string shows the numeric type and the array size of the data. It is not modifiableby the user.TitleThis string contains the overall name of the variable. The Title field is used to labelthe <strong>Wavelet</strong> Power Spectrum and Multiresolution widgets. The default is the null('') string.VariableThis string provides a short name for the variable. The Variable is used to label plots,and for the labels in the Dataset Viewer. For a one-dimensional vector (e.g. a timeseries), the Variable is equivalent to Ytitle. The default is either the name of theimport file, or 'Data' if imported from the <strong>IDL</strong>> command prompt.UnitsThis string gives the units of the variable, and is used to label various plots. For aone-dimensional vector (e.g. a time series), the Units is equivalent to the Yunits. Thedefault is the null ('') string.<strong>Wavelet</strong> <strong>Toolkit</strong> Dataset Viewer<strong>IDL</strong> <strong>Wavelet</strong> <strong>Toolkit</strong>
Chapter 2: Using the <strong>IDL</strong> <strong>Wavelet</strong> <strong>Toolkit</strong> 21XnameField Type Example (1D vector) Example (2D array)Title STRING Wave audio recording IEEE Test ImageVariable STRING Channel1 IEEEtestUnits STRING Amplitude intensityXname STRING Time XXunits STRING seconds pixelsXstart STRING 0 0Dx STRING 1d0/22050 1Yname STRING YYunits STRING pixelsYstart STRING 0Dy STRING 1Xoffset LONG 0 0Xcount LONG 16384 256Xstride LONG 1 2Yoffset LONG 0Ycount LONG 256Ystride LONG 2Source STRING wavelet/data/hello.wav wavelet/data/IEEEtest.tifNotes STRING Voice saying ‘hello’ IEEE test imageTable 2-1: Data fields in the Dataset Viewer .This string is the name of the independent variable for the first data dimension (“X”),and is used to label the x-axis. The default is the null ('') string.<strong>IDL</strong> <strong>Wavelet</strong> <strong>Toolkit</strong><strong>Wavelet</strong> <strong>Toolkit</strong> Dataset Viewer
22 Chapter 2: Using the <strong>IDL</strong> <strong>Wavelet</strong> <strong>Toolkit</strong>XunitsThis string gives the units of X. The default is the null ('') string.XstartDxThis string gives the value of the first X coordinate. The default is '0'. Xstart cancontain complicated mathematical expressions, although the result must be a scalarnumber.This string gives the sampling interval between the X coordinates. The default is '1'.Dx can contain complicated mathematical expressions, although the result must be ascalar number.YnameThis string is the name of the independent variable for the second data dimension(“Y”), and is used to label the y-axis (for a one-dimensional variable this is actuallyequivalent to the name of the dependent Variable). The default is the null ('') string.YunitsThis string gives the units of Y. The default is the null ('') string.YstartDyThis string gives the value of the first Y coordinate. The default is '0'. Ystart cancontain complicated mathematical expressions, although the result must be a scalarnumber.This string gives the sampling interval between the Y coordinates. The default is '1'.Dy can contain complicated mathematical expressions, although the result must be ascalar number.XoffsetThe offset along the first data dimension at which to start. The default is 0L.XcountThe number of data points to use along the first data dimension. The default is thesize of the first dimension.<strong>Wavelet</strong> <strong>Toolkit</strong> Dataset Viewer<strong>IDL</strong> <strong>Wavelet</strong> <strong>Toolkit</strong>
Chapter 2: Using the <strong>IDL</strong> <strong>Wavelet</strong> <strong>Toolkit</strong> 23XstrideThe sampling interval along the first data dimension. The default is 1L.YoffsetThis long integer gives the offset along the second data dimension at which to start.The default is 0L.YcountThis long integer gives the number of data points to use along the second datadimension. The default is the size of the second dimension.YstrideThis long integer gives the sampling interval along the second data dimension. Thedefault is 1L.SourceThis string describes the original source or location of the data. The default is eitherthe full filename (if the data was from a file) or ’Imported’ (if the data was fromthe <strong>IDL</strong>> command prompt).NotesYou can enter miscellaneous information into the Notes string. The default is the null('') string.Mathematical ExpressionsFor Xstart, Dx, Ystart, and Dy, it is highly recommended that whenever possible youenter mathematical expressions, rather than converting to numbers. For example, inthe above table, the sampling rate for hello.wav is 22050 Hz. One could have enteredDx as 0.00004535 rather than ‘1d0/22050’. Nevertheless, the latter is not only moreaccurate (limited only by your computer’s precision) but is also much moreinformative. (Note that the ‘1d0’ forces the computation to be done in doubleprecision.)You may also enter <strong>IDL</strong> functions in these strings. For example, if your X coordinatewas in Julian days, starting from say 29 February 2000, you could setXstart = 'JULDAY(2,29,2000)'.<strong>IDL</strong> <strong>Wavelet</strong> <strong>Toolkit</strong><strong>Wavelet</strong> <strong>Toolkit</strong> Dataset Viewer
24 Chapter 2: Using the <strong>IDL</strong> <strong>Wavelet</strong> <strong>Toolkit</strong>Selecting VariablesTo select a particular variable for visualization or some other action, click the mouseon any field for that variable, or click the mouse on the Table row label to highlightthe entire row.To select multiple variables for deletion, click the mouse on any field and drag downto select the list of variables, or click once on the row label, scroll down and hold the key while clicking on the last row label.<strong>Wavelet</strong> <strong>Toolkit</strong> Dataset Viewer<strong>IDL</strong> <strong>Wavelet</strong> <strong>Toolkit</strong>
Chapter 2: Using the <strong>IDL</strong> <strong>Wavelet</strong> <strong>Toolkit</strong> 25Importing Data into the <strong>Wavelet</strong> <strong>Toolkit</strong>You can import data in multiple file formats into the <strong>IDL</strong> <strong>Wavelet</strong> <strong>Toolkit</strong>.ASCII FilesSelect this menu item or button to import data from an ASCII text file. After choosingthe file using the Select Import File dialog, you can specify the particular format forthe ASCII_TEMPLATE dialog. See “ASCII_TEMPLATE” (<strong>IDL</strong> Reference <strong>Guide</strong>)for more information.The ASCII_TEMPLATE routine handles ASCII files consisting of an optional headerof a fixed number of lines, followed by columnar data. The procedure consists ofthree steps:1. “Define Data Type/Range”— Specify whether the data is in fixed widthcolumns or separated by commas or spaces. The first 50 lines are displayed.Choose the first line of data and click on the Next > button;2. “Define Fields”— Choose the number of fields per line and then click Next >;3. “Field Specification”— You can change the names and data types for thevarious fields. The Field names can also be changed once the data is importedinto the <strong>Toolkit</strong>. Click on the Finish button to import the data into the <strong>Wavelet</strong><strong>Toolkit</strong>.Once the data is successfully imported, you can change the default names for thevariable Title, Variable, etc.Independent VariableFor ASCII files with multiple columns, if the first column is determined to bemonotonically increasing in value, or is assigned the field name “TIME” within theASCII_TEMPLATE, then it is assumed to be the “independent variable.” In this casethe remaining columns are then imported as the “dependent variables.”NoteYou may change the name “TIME” after the data has been imported into the<strong>Wavelet</strong> <strong>Toolkit</strong>.Two-Dimensional ArraysBy default, each column within the file will be imported into the <strong>IDL</strong> <strong>Wavelet</strong><strong>Toolkit</strong> as a separate variable. To import a two-dimensional array of data, you should<strong>IDL</strong> <strong>Wavelet</strong> <strong>Toolkit</strong>Importing Data into the <strong>Wavelet</strong> <strong>Toolkit</strong>
26 Chapter 2: Using the <strong>IDL</strong> <strong>Wavelet</strong> <strong>Toolkit</strong>use the Group All button within the ASCII_TEMPLATE dialog to connect all of thecolumns into one field.Binary FilesSelect this menu item or button to import data from a binary data file. After choosingthe file using the Select Import File dialog, you can specify the particular format forthe file using the BINARY_TEMPLATE dialog. See “BINARY_TEMPLATE” (<strong>IDL</strong>Reference <strong>Guide</strong>) for more information.The BINARY_TEMPLATE routine handles raw binary files consisting of headersand multiple data fields. The dialog consists of a Binary Template window where youcan define various fields within the file. Each field will be imported into the <strong>Wavelet</strong><strong>Toolkit</strong> as a separate variable.Image FilesSelect this menu item or button to import an image file. The functionDIALOG_READ_IMAGE is used to select the image file. For files with multipleimages you can choose the particular image you wish to import. See“DIALOG_READ_IMAGE” (<strong>IDL</strong> Reference <strong>Guide</strong>) for more information.For TrueColor (24-bit) images, you will then be asked how you wish to convert thethree channels into a single two-dimensional image. You have the option to scale thedata into an intensity from 0–255, quantize the 24-bit colors down to 256 colors, orsplit the three channels into separate red, green, and blue images.WAV Audio FilesSelect this menu item or button to import a .WAV (RIFF) audio file as a onedimensionalvector. The file must be in uncompressed PCM format. Multiplechannels are imported as separate variables, one for each channel.<strong>IDL</strong> Command LineYou can also import data directly from the <strong>IDL</strong>> command prompt using theWV_IMPORT_DATA command:WV_IMPORT_DATA, variablewhere variable is either a data vector or array, or a structure of data tags (see“WV_IMPORT_DATA” on page 96 for tag information).Importing Data into the <strong>Wavelet</strong> <strong>Toolkit</strong><strong>IDL</strong> <strong>Wavelet</strong> <strong>Toolkit</strong>
Chapter 2: Using the <strong>IDL</strong> <strong>Wavelet</strong> <strong>Toolkit</strong> 27If there is more than one <strong>Wavelet</strong> <strong>Toolkit</strong> applet currently running, then variables areentered into the one that was most-recently active.<strong>IDL</strong> <strong>Wavelet</strong> <strong>Toolkit</strong>Importing Data into the <strong>Wavelet</strong> <strong>Toolkit</strong>
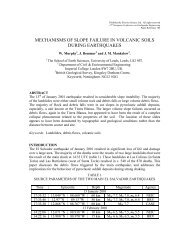
28 Chapter 2: Using the <strong>IDL</strong> <strong>Wavelet</strong> <strong>Toolkit</strong><strong>Wavelet</strong> ViewerThe <strong>Wavelet</strong> Viewer is accessible from the Visualize menu or button, and can also bestarted from the <strong>IDL</strong>> command prompt using the WV_CW_WAVELET function:wId = WV_CW_WAVELET()For more information, see “WV_CW_WAVELET” on page 62.The <strong>Wavelet</strong> Viewer consists of a graph of the currently-selected wavelet function, aselection area for the wavelet function, and an information area, shown in thefollowing figure:<strong>Wavelet</strong> and Scaling FunctionsThe wavelet consists of two components, the scaling function which describes thelow-pass filter for the wavelet transform, and the wavelet function which describesthe band-pass filter for the transform.Changing <strong>Wavelet</strong>sFigure 2-2: The <strong>Wavelet</strong> Viewer.The droplist contains the names of all currently-available wavelets. The Familyrefers to the overall properties of the wavelet, while the Order determines theparticular wavelet within each family.<strong>Wavelet</strong> Viewer<strong>IDL</strong> <strong>Wavelet</strong> <strong>Toolkit</strong>
Chapter 2: Using the <strong>IDL</strong> <strong>Wavelet</strong> <strong>Toolkit</strong> 29<strong>Wavelet</strong> InformationAfter you select a wavelet family and order, the following information will bedisplayed:Discrete/ContinuousDiscrete wavelet functions are used with the discrete wavelet transform, whichprovides the most compact representation of the data. The discrete transform is veryfast and is best suited for image processing, filtering, and large arrays.Continuous wavelet functions are used to approximate the continuous wavelettransform, which provides a highly-redundant transformation of the data. Thecontinuous wavelet transform is much smoother than the discrete transform and isbetter suited for time-series analysis on small arrays (less than 20000 data points).Orthogonal/NonorthogonalOrthogonal wavelet functions will have no overlap with each other (zero correlation)when computing the wavelet transform, while nonorthogonal wavelets will havesome overlap (nonzero correlation). Using an orthogonal wavelet, you can transformto wavelet space and back with no loss of information.Nonorthogonal wavelet functions tend to artificially add in energy (due to theoverlap) and require renormalization to conserve the information.In general, discrete wavelets are orthogonal while continuous wavelets arenonorthogonal.SymmetryThis flag describes the symmetry of the wavelet function about the midpoint.Symmetric wavelets show no preferred direction in “time,” while asymmetricwavelets give unequal weighting to different directions.Compact SupportThis value measures the effective width of the wavelet function. A narrow waveletfunction such as the Daubechies order 2 (compact support=3) is fast to compute, butthe narrowness in “time” implies a very large width in “frequency.” Conversely,wavelets with large compact support such as the Daubechies order 24 (compactsupport=47) are smoother, have finer frequency resolution and are usually moreefficient at denoising.<strong>IDL</strong> <strong>Wavelet</strong> <strong>Toolkit</strong><strong>Wavelet</strong> Viewer
30 Chapter 2: Using the <strong>IDL</strong> <strong>Wavelet</strong> <strong>Toolkit</strong>Vanishing MomentsAn important property of a wavelet function is the number of vanishing moments,which describes the effect of the wavelet on various signals. A wavelet such as theDaubechies 2 with vanishing moment=2 has zero mean and zero linear trend. Whenthe Daubechies 2 wavelet is used to transform a data series, both the mean and anylinear trend are filtered out of the series. A higher vanishing moment implies thatmore moments (quadratic, cubic, etc.) will be removed from the signal.RegularityThe regularity gives an approximate measure of the number of continuous derivativesthat the wavelet function possesses. The regularity therefore gives a measure of thesmoothness of the wavelet function with higher regularity implying a smootherwavelet.e-Folding Time (Continuous <strong>Wavelet</strong>s Only)The e-folding time is a measure of the wavelet width, relative to the wavelet scale s.Using the wavelet transform of a spike, the e-folding time is defined as the distance atwhich the wavelet power falls to 1/e^2, where e = 2.71828. Larger e-folding timeimplies more spreading of the wavelet power.User-Defined <strong>Wavelet</strong>sYou can easily extend the <strong>IDL</strong> <strong>Wavelet</strong> <strong>Toolkit</strong> by adding more wavelet functions.These wavelet functions should follow the same calling mechanism as the built-inwavelet functions such as “WV_FN_DAUBECHIES” on page 80. In addition, yourwavelet function should begin with the prefix 'wv_fn_'.1. Let’s say you would like to add a wavelet function called “Spline” giving theDaubechies “Spline” wavelets. To do this, first create a wavelet function toreturn the wavelet coefficients and the information structure:FUNCTION wv_fn_spline, Order, Scaling, <strong>Wavelet</strong>, Ioff, Joff; compute coefficients here......; find support, moments, and regularity...info = {family:'Spline', $order_name:'Order', $order_range:[1,5,1], $order:order, $discrete:1, $orthogonal:1, $<strong>Wavelet</strong> Viewer<strong>IDL</strong> <strong>Wavelet</strong> <strong>Toolkit</strong>
Chapter 2: Using the <strong>IDL</strong> <strong>Wavelet</strong> <strong>Toolkit</strong> 31symmetric:0, $support:support, $moments:moments, $regularity:regularity}RETURN, infoEND2. Save this function in a file 'wv_fn_spline.pro' that is accessible from yourcurrent <strong>IDL</strong> path.3. Now start the <strong>Wavelet</strong> <strong>Toolkit</strong> with your new wavelet function:WV_APPLET, WAVELETS='Spline'Or, if you are already running the <strong>Wavelet</strong> <strong>Toolkit</strong>:WV_IMPORT_WAVELET, 'Spline'Your new wavelet function should appear in the list of current wavelet functions, andshould be accessible from any of the wavelet tools.<strong>IDL</strong> <strong>Wavelet</strong> <strong>Toolkit</strong><strong>Wavelet</strong> Viewer
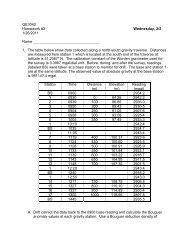
32 Chapter 2: Using the <strong>IDL</strong> <strong>Wavelet</strong> <strong>Toolkit</strong><strong>Wavelet</strong> Power SpectrumThe wavelet transform converts the data array into a series of wavelet coefficients,each of which represents the amplitude of the wavelet function at a particular locationwithin the array and for a particular wavelet scale.The <strong>Wavelet</strong> Power Spectrum viewer, shown in the following figure, allows you tovisualize the wavelet power as a three-dimensional surface plot, where the height ofthe surface represents the magnitude of the wavelet coefficients.Figure 2-3: The <strong>Wavelet</strong> Power Spectrum 3D viewer.<strong>Wavelet</strong> Power Spectrum<strong>IDL</strong> <strong>Wavelet</strong> <strong>Toolkit</strong>
Chapter 2: Using the <strong>IDL</strong> <strong>Wavelet</strong> <strong>Toolkit</strong> 33File MenuOpen State...This menu item opens a previously saved “state” file into a new window.Save State...This menu item saves the current state of the <strong>Wavelet</strong> Power Spectrum into a file.Export To...• Bitmap File [Windows only]: The bitmap file saves the current image as abitmap.• Vector Metafile [Windows only]: The vector metafile produces a scalableimage file, but may not be able to accurately reproduce the 3D geometry.• Bitmap Pict [Macintosh only]: The bitmap pict saves the current image as abitmap.• Bitmap Postscript: The bitmap postscript format saves the current image as abitmap.• Vector Postscript: The vector postscript format takes less disk space thanbitmap, and is scalable, but may not be able to accurately reproduce the 3Dgeometry.• VRML: The Virtual Reality Markup Language produces a three-dimensionaloutput file suitable for web publication.NoteIt is not always possible to translate the complicated 3D geometry produced by <strong>IDL</strong>object graphics into equivalent VRML code.PrintThis menu item will output the image to a printer.CloseThis menu item closes the <strong>Wavelet</strong> Power Spectrum viewer.<strong>IDL</strong> <strong>Wavelet</strong> <strong>Toolkit</strong><strong>Wavelet</strong> Power Spectrum
34 Chapter 2: Using the <strong>IDL</strong> <strong>Wavelet</strong> <strong>Toolkit</strong>Edit MenuUndoThis menu item will undo the previous rotation, scaling, or translation of the model.Copy To ClipboardThis menu item makes a copy of the current graphics image and places it on thesystem clipboard.View MenuColor TableSelecting this item brings up the XLOADCT color table editor. You can then choosedifferent color tables for the graphics image. See “XLOADCT” (<strong>IDL</strong> Reference<strong>Guide</strong>) for more information.Drag QualityThis submenu has three different settings that affect the drawing speed during objectmanipulations:• Low— only the axes are exposed for graphics manipulation such as rotationand translation;• Medium— low resolution graphics are used for graphics manipulation;• High— full resolution is used for all graphics manipulations<strong>Wavelet</strong> OptionsIf you select this menu item, the <strong>Wavelet</strong> Options panel will be hidden. Select thismenu item again to show the panel.View OptionsIf you select this menu item, the View Options panel will be hidden. Select this menuitem again to show the panel.Help MenuThis menu contains Help items for the <strong>Wavelet</strong> Power Spectrum and for <strong>IDL</strong>.<strong>Wavelet</strong> Power Spectrum<strong>IDL</strong> <strong>Wavelet</strong> <strong>Toolkit</strong>
Chapter 2: Using the <strong>IDL</strong> <strong>Wavelet</strong> <strong>Toolkit</strong> 35<strong>Wavelet</strong> OptionsYou can change the current wavelet family or the order. The plot will beautomatically updated.NoteFor two-dimensional input data, only the discrete wavelet functions are available.View Options3DTurn this button off to rotate the image so it appears flat. Turn this button on to rotatethe image to a three-dimensional perspective. For vector data, this button alsocontrols whether the data series and global wavelet plot are flat or vertical.NoteThe surface will remain three-dimensional; only the viewpoint is changed.Color BarTurn this button off to remove the color bar at the bottom. Turn this button on torestore the color bar.Data Plot [One-dimensional only]Turn this button off to remove the data series plot at the back. Turn this button on torestore the plot.Global [One-dimensional only]Turn this button off to remove the plot of the global wavelet. Turn the button on torestore the plot.Zero Phase Lines [Complex wavelet functions only]Turn this button on to add the zero wavelet phase lines to the surface plot.Energy ScalingThese buttons control the scaling of the wavelet magnitude in the Z-direction.<strong>IDL</strong> <strong>Wavelet</strong> <strong>Toolkit</strong><strong>Wavelet</strong> Power Spectrum
36 Chapter 2: Using the <strong>IDL</strong> <strong>Wavelet</strong> <strong>Toolkit</strong>PowerThe power is the absolute-value-squared of the wavelet coefficients. The height ofeach point measures the contribution to the total energy.This scaling emphasizes large peaks and sharp discontinuities, and de-emphasizeslow-amplitude background noise.MagnitudeThe magnitude is the absolute value of the wavelet coefficients, and provides ameasure of the relative amplitude of each point.This scaling reduces the weighting given to large peaks and can bring out finer-detailfeatures.DecibelsThe power can also be displayed in decibels, normalized relative to the mean of thewavelet power spectrum.Since decibels are a logarithmic scale, the smallest wavelet coefficients are given justas much weight as the largest coefficients. This scaling is most useful for data thatcontain a broad range of energy, or that contain a single sharp spike embedded insmall-amplitude noise.db CutoffYou can specify the lower cutoff for the Decibel plot. The default is –50 db.Surface StyleThere are seven different surface plots from which to choose:• Points— places colored dots at each location/height;• Mesh— creates an unfilled surface plot;• Surface— creates a shaded filled surface;• XZ Lines— draws lines parallel to the X-axis, one for each Y location;• YZ Lines— draws lines parallel to the Y-axis, one for each X location;• Lego— draws a lego-block plot with mesh sides;• Lego filled— draws a lego-block plot with solid sides.You can also use the buttons to remove or add a “Skirt” around the surface, make thesurface “Flat”, or change to a “Gray” palette.<strong>Wavelet</strong> Power Spectrum<strong>IDL</strong> <strong>Wavelet</strong> <strong>Toolkit</strong>
Chapter 2: Using the <strong>IDL</strong> <strong>Wavelet</strong> <strong>Toolkit</strong> 37Contour LinesYou can choose to include contour lines at the top of the plot, the bottom, or threedimensional.Color ContoursYou can also put color contours at the top, bottom, or 3D. The color contours can beeither open or filled. The color palette is the same as that used for the surface plot.TipTo produce a shaded surface with contours, make the surface “Shaded”, set the“Gray” button, and select “3D” color contours.SignificanceThe statistical significance of each point in the wavelet power spectrum can beplotted as a three-dimensional sheet, or as contours on the top, bottom, or 3D. Pointsin the wavelet power spectrum that lie above the sheet (or within the contours) aresaid to be “significant at the xx% level,” where xx is your chosen percentage. Youcan choose the significance level as 10%, 5%, 1%, or 0.1%.NoteThe significance level is given by the chi-square function with one degree offreedom for real wavelet functions, or two degrees of freedom for complex wavelets(such as the Morlet). This significance is relative to the wavelet power spectrum ofa random dataset (assuming Gaussian “white noise”).Power DisplayThe graphics window contains the three-dimensional image and a color palette.If you move the mouse cursor over points in the image, the current location andpower will be displayed in the Status Bar.Rotation, Translation, StretchingTo rotate the image, click on the image while holding down the left mouse button,and drag the mouse pointer to rotate the image about the midpoint.To translate the image, click on the image while holding down the right mouse button(on the Macintosh hold down the command key also), and drag the mouse pointer.<strong>IDL</strong> <strong>Wavelet</strong> <strong>Toolkit</strong><strong>Wavelet</strong> Power Spectrum
38 Chapter 2: Using the <strong>IDL</strong> <strong>Wavelet</strong> <strong>Toolkit</strong>To stretch the image, click on the image while holding the middle mouse button (onWindows hold down the Ctrl key also; on Macintosh hold down the Option key).Drag the mouse pointer right/left to stretch/shrink in the X-direction, drag the pointerup/down to stretch/shrink in the Y-direction.<strong>Wavelet</strong> Power Spectrum<strong>IDL</strong> <strong>Wavelet</strong> <strong>Toolkit</strong>
Chapter 2: Using the <strong>IDL</strong> <strong>Wavelet</strong> <strong>Toolkit</strong> 39Multiresolution Analysis in the <strong>Wavelet</strong><strong>Toolkit</strong>Multiresolution Analysis uses the wavelet transform to decompose a data series in acascade from the smallest scales to the largest. At each scale there are threecomponents: the Smooth (or low-pass filtered) data series, the Details (or band-pass)data series, and the Rough (or high-pass).For one-dimensional vectors, this can be viewed as a hierarchy of x-y plots, as shownin the following figure:For two-dimensional arrays, the multiresolution analysis gives a series of images.File MenuPage SetupThis menu item sets up the page height and width for exporting and printing.Export PostscriptExport the image to a postscript file.Printer SetupThis menu item allows you to set up the printer via the Printer Dialog.PrintThis menu item prints the image.CloseThis menu item closes the Multiresolution viewer.<strong>Wavelet</strong> OptionsYou can change the current wavelet family, or the order. The plot will be updatedautomatically.<strong>IDL</strong> <strong>Wavelet</strong> <strong>Toolkit</strong>Multiresolution Analysis in the <strong>Wavelet</strong> <strong>Toolkit</strong>
40 Chapter 2: Using the <strong>IDL</strong> <strong>Wavelet</strong> <strong>Toolkit</strong>Figure 2-4: Multiresolution Analysis of the “Chirp” VariableMultiresolution Analysis in the <strong>Wavelet</strong> <strong>Toolkit</strong><strong>IDL</strong> <strong>Wavelet</strong> <strong>Toolkit</strong>
Chapter 2: Using the <strong>IDL</strong> <strong>Wavelet</strong> <strong>Toolkit</strong> 41<strong>Wavelet</strong> <strong>Toolkit</strong> Denoise ToolYou can use the Denoise Tool to explore different techniques for removing noise andcompressing data using the wavelet transform.The Denoise Tool is shown in the following figure. The plots and options aredescribed below.Figure 2-5: The Denoise Tool<strong>IDL</strong> <strong>Wavelet</strong> <strong>Toolkit</strong><strong>Wavelet</strong> <strong>Toolkit</strong> Denoise Tool
42 Chapter 2: Using the <strong>IDL</strong> <strong>Wavelet</strong> <strong>Toolkit</strong>File MenuOpen State...This menu item opens a previously saved “state” file into a new window.Save State...This menu item saves the current state of the Denoise Tool into a file.CloseThis menu item closes the Denoise Tool viewer.Original DataThis window displays a graph of the original one-dimensional vector or twodimensionalimage. For images, all values are converted to an intensity (0–255) and agrayscale color palette is used.Filtered DataThis window displays the data after filtering using the wavelet function and optionsgiven on the right. For images, all values are converted to an intensity (0–255) and agrayscale color palette is used.<strong>Wavelet</strong> CoefficientsThe filtered coefficients are displayed as a two-dimensional image using alogarithmic energy scaling. The method is as follows:1. Find the maximum value “P m ” of the original, unfiltered, wavelet power(absolute-value squared of the wavelet coefficients);2. Square the filtered wavelet coefficients to get wavelet power, then take thebase-10 logarithm of each;3. Scale this logarithmic power from the range [–10 Log 10 (P m ), Log 10 (P m )] intothe range [32, 255]. Values greater than zero but less than –10 Log 10 (P m ) areset equal to 32.4. Set all values removed by the filter to zero (0).5. Display the image using a grayscale color palette.<strong>Wavelet</strong> <strong>Toolkit</strong> Denoise Tool<strong>IDL</strong> <strong>Wavelet</strong> <strong>Toolkit</strong>
44 Chapter 2: Using the <strong>IDL</strong> <strong>Wavelet</strong> <strong>Toolkit</strong>Soft ThresholdThe soft threshold also sets all discarded wavelet coefficients to zero. However, italso linearly reduces the magnitude of the each retained wavelet coefficient by anamount equal to the largest discarded coefficient. For details see “Denoise” onpage 51.Results WindowThis text window contains the following output results:ThresholdThe threshold is the actual wavelet power (in the variable’s units squared) that is usedfor the cutoff value.Percent of CoefficientsThis is the percent number of coefficients used in the reconstruction. The smaller thepercent coefficients the more efficient the filter.RMS DifferenceThis is the root-mean-square difference between the original data (upper-left plot)and the filtered data (upper-right plot) in the variable units. A smaller number impliesa more accurate reconstruction.Percent DifferenceThis is the percent difference between the original and filtered data, and is equal to100% x (RMS difference/StdDev) where StdDev is the standard deviation of theoriginal data. The smaller the percent difference, the more accurate thereconstruction.Function CallThe text under Function Call contains the actual <strong>IDL</strong> code used to call theWV_DENOISE function. See “WV_DENOISE” on page 69 to copy this code intoyour own programs to call the denoise function directly.<strong>Wavelet</strong> <strong>Toolkit</strong> Denoise Tool<strong>IDL</strong> <strong>Wavelet</strong> <strong>Toolkit</strong>
Chapter 2: Using the <strong>IDL</strong> <strong>Wavelet</strong> <strong>Toolkit</strong> 45Adding User Tools to the <strong>Wavelet</strong> <strong>Toolkit</strong>You can extend the capabilities of the <strong>IDL</strong> <strong>Wavelet</strong> <strong>Toolkit</strong> by adding your own userdefinedtool functions. These wavelet functions should follow the same callingmechanism as the built-in tool functions such as “WV_TOOL_DENOISE” onpage 108. In addition, your tool function should begin with the prefix 'wv_tool_'.1. Let’s say you want to add a wavelet tool called “Edge Detect” that uses thewavelet transform to detect edges in images. To do this, first create a toolfunction that accepts a data array and possibly other variable parameters:FUNCTION wv_tool_edgedetect, $Array ; 1D vector or 2D array[,X] ; X coordinates of array[,Y] ; Y coordinates of array[, GROUP_LEADER=group_leader][, TITLE=title] [, UNITS=units][, XTITLE=xtitle] [, XUNITS=xunits][, YTITLE=ytitle] [, YUNITS=yunits][, XOFFSET=xoffset] [, YOFFSET=yoffset]; start the edge detection applet......; return the Widget ID for the appletRETURN, wIDEND2. Save this function in a file wv_tool_edgedetect.pro that is accessiblefrom your current <strong>IDL</strong> path.3. Now start the <strong>Wavelet</strong> <strong>Toolkit</strong> with your new wavelet function:WV_APPLET, TOOLS=['Edge Detect']Your new tool should appear in the Tools Menu. The actual function name isconstructed by removing all white space from the name and attaching a prefix ofWV_TOOL_.NoteAt a minimum, your tool function must accept a data Array. All other parameters(such as X and Y) and keywords (GROUP_LEADER, TITLE, etc.) are optional. The<strong>IDL</strong> <strong>Wavelet</strong> <strong>Toolkit</strong> will pass in only those parameters and keywords that areusable by your tool function.<strong>IDL</strong> <strong>Wavelet</strong> <strong>Toolkit</strong>Adding User Tools to the <strong>Wavelet</strong> <strong>Toolkit</strong>
46 Chapter 2: Using the <strong>IDL</strong> <strong>Wavelet</strong> <strong>Toolkit</strong>Adding User Tools to the <strong>Wavelet</strong> <strong>Toolkit</strong><strong>IDL</strong> <strong>Wavelet</strong> <strong>Toolkit</strong>
Chapter 3Theory and ExamplesThis chapter discusses the following topics:<strong>Wavelet</strong> Transform . . . . . . . . . . . . . . . . . . . . 48<strong>Wavelet</strong> Power Spectrum . . . . . . . . . . . . . . . 49Denoise . . . . . . . . . . . . . . . . . . . . . . . . . . . . 51Multiresolution Analysis . . . . . . . . . . . . . . 54Bibliography . . . . . . . . . . . . . . . . . . . . . . . . 55<strong>IDL</strong> <strong>Wavelet</strong> <strong>Toolkit</strong> 47
48 Chapter 3: Theory and Examples<strong>Wavelet</strong> TransformBackground<strong>Wavelet</strong> analysis is a technique to transform an array of N numbers from their actualnumerical values to an array of N wavelet coefficients.Each wavelet coefficient represents the closeness of the fit (or correlation) betweenthe wavelet function at a particular size and a particular location within the data array.By varying the size of the wavelet function (usually in powers-of-two) and shiftingthe wavelet so it covers the entire array, you can build up a picture of the overallmatch between the wavelet function and your data array.Since the wavelet functions are compact (hence the term wave-let), the waveletcoefficients only measure the variations around a small region of the data array. Thisproperty makes wavelet analysis very useful for signal or image processing; the“localized” nature of the wavelet transform allows you to easily pick out features inyour data such as spikes (for example, noise or discontinuities), discrete objects (in,for example, astronomical images or satellite photos), edges of objects, etc.The localization also implies that a wavelet coefficient at one location is not affectedby the coefficients at another location in the data. This makes it possible to remove“noise” of all different scales from a signal, simply by discarding the lowest waveletcoefficients.For a general introduction to the wavelet transform and its applications see Hubbard(1998).MethodThe <strong>IDL</strong> <strong>Wavelet</strong> <strong>Toolkit</strong> uses the continuous and discrete wavelet transforms.Details on the discrete wavelet transform can be found in Daubechies (1992) andMallat (1989). A good introduction to the DWT and multiresolution analysis is givenin Lindsay et al. (1996).The DWT routines are based on the routines described in section 13.10 of NumericalRecipes in C: The Art of Scientific Computing, 2nd ed. (Cambridge University Press),and are used by permission.An introduction to the continuous wavelet transform for time series analysis can befound in Torrence and Compo (1998), along with a discussion of statisticalsignificance testing.<strong>Wavelet</strong> Transform<strong>IDL</strong> <strong>Wavelet</strong> <strong>Toolkit</strong>
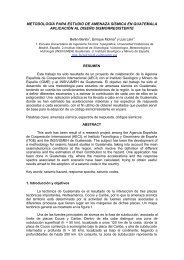
Chapter 3: Theory and Examples 49<strong>Wavelet</strong> Power SpectrumBackgroundThe wavelet coefficients yield information as to the correlation between the wavelet(at a certain scale) and the data array (at a particular location). A larger positiveamplitude implies a higher positive correlation, while a large negative amplitudeimplies a high negative correlation.A useful way to determine the distribution of energy within the data array is to plotthe wavelet power, equivalent to the amplitude-squared. By looking for regionswithin the <strong>Wavelet</strong> Power Spectrum (WPS) of large power, you can determine whichfeatures of your signal are important and which can be ignored.MethodGiven the wavelet transform W i of a multi-dimensional data array, A i , where i=0...N–1 is the index and N is the number of points, then the <strong>Wavelet</strong> Power Spectrum isdefined as the absolute-value squared of the wavelet coefficients, |W i | 2 .One-dimensional VectorFor a vector (such as a time series) the coefficients of wavelet power can berearranged to yield a two-dimensional picture, where the first dimension is theindependent variable (e.g. time) and the second dimension is the wavelet scale (e.g.1/frequency).Two-dimensional ArrayThe wavelet transform of a 2D array is also two-dimensional, and is arranged so thatthe smallest scales are in the upper-right quadrant (assuming that index [0, 0] is in thelower-left).ExampleUse the “Chirp” dataset that is included in the <strong>Wavelet</strong> sample file. This datasetcontains a time series with a sine wave that has an exponentially-increasingfrequency. You can use the Multiresolution Analysis viewer to examine the timeseries.<strong>IDL</strong> <strong>Wavelet</strong> <strong>Toolkit</strong><strong>Wavelet</strong> Power Spectrum
50 Chapter 3: Theory and ExamplesTry the following steps:1. From the main window, select the Chirp dataset and start the <strong>Wavelet</strong> PowerSpectrum viewer using either the Visualize Menu or the Toolbar button. TheWPS can be seen under “<strong>Wavelet</strong> Power Spectrum” on page 32.2. Select the Morlet wavelet function from the Family dropdown box. Youshould be able to see the exponential increase in frequency as a band of highpower extending from left to right, and ranging from about Scale=256 sec. nearthe beginning to Scale=16 sec. near the end of the time series.3. To bring out the features more clearly, change the Energy Scaling dropdownitem from Power to Magnitude.4. Notice the large peak near Scale=256 sec. This is primarily due to thediscontinuity that occurs when the dataset is wrapped around from the endback to the beginning. Move the Order slider bar from 6 to 4 to make the peakmore narrow.TipYou can use your mouse to rotate, zoom in or out, or move the plot.5. To find the chirp peaks, select the Zero Phase Lines check box.6. Now deselect the 3D check box to view the surface from above.Figure 3-1: The <strong>Wavelet</strong> Power Spectrum of the Chirp Signal<strong>Wavelet</strong> Power Spectrum<strong>IDL</strong> <strong>Wavelet</strong> <strong>Toolkit</strong>
Chapter 3: Theory and Examples 51DenoiseBackgroundOne of the most useful applications of wavelet analysis is to remove unwanted noisefrom a dataset. This noise could be due to measurement errors or instrument noise. Inimage processing the “noise” might be small-scale features or artifacts.You could try to remove noise from the signal by using a low-pass or band-passFourier filter. There are two problems with this approach:1. You need to carefully choose the width and shape of your filter, both to avoidremoving too much of your signal and to decrease “ringing” from peaks anddiscontinuities, and,2. In many cases the noise is “white,” in other words, it is distributed across allfrequencies or spatial scales.<strong>Wavelet</strong> analysis, on the other hand, offers a scale-independent and robust method tofilter out noise. The basic technique involves computing the wavelet transform ofyour data and then decreasing or discarding the smallest wavelet coefficients. Theinverse transform of these coefficients will then be a filtered version of your data.MethodWe assume that you have computed the wavelet transform W i of a multi-dimensionaldata array, A i , where i=0...N–1 is the index and N is the number of points.You then compute a threshold level W 0 . This threshold level can be based on thepercent of wavelet power that you wish to retain, the number of coefficients, or someother method. Suggestions for choosing the threshold are given in Donoho andJohnstone (1994). <strong>Wavelet</strong> coefficients smaller than this threshold are discardedwhile those above are retained. There are two methods for thresholding:Hard thresholdThe hard threshold removes all discarded wavelet coefficients by setting them to zeroand computing the inverse wavelet transform. This can be defined as:⎧⎪ WW i W i > W 0i= ⎨⎪ 0 W i≤ W 0⎩<strong>IDL</strong> <strong>Wavelet</strong> <strong>Toolkit</strong>Denoise
52 Chapter 3: Theory and Exampleswhere W i is the wavelet coefficient and W 0 is the chosen threshold level.Soft ThresholdThe soft threshold also sets all discarded wavelet coefficients to zero. However, italso linearly reduces the magnitude of the each retained wavelet coefficient by anamount equal to the largest discarded coefficient, i.e.:where sgn(W i ) is the sign of W i .ExampleW i=⎧⎪⎨⎪⎩sgn( W i) W i– W 0( ) W i> W 00 W i≤ W 0We will look at a magnetic-resonance image (MRI) of the brain, and use theDenoising widget tool to filter out unwanted speckles and compress the size of theimage.Try the following steps:1. In WV_APPLET, choose File → Import → Image File, and navigate to theexamples/data directory in the <strong>IDL</strong> distribution.2. Import the file mr_brain.dcm. The file should contain a 256 x 256 unsignedinteger (UINT) image.3. In the Dataset Viewer, change the Title field to ‘MRI Brain Image’ and theVariable field to 'Brain'.4. Select the Brain dataset and start up the Denoise tool from the Tools Menu.You should see the Denoise widget, with the threshold set to 100% and allcoefficients retained.5. Set the # coeffs threshold to 8192 points. You should then see a view similar tothat of the following figure.Denoise<strong>IDL</strong> <strong>Wavelet</strong> <strong>Toolkit</strong>
Chapter 3: Theory and Examples 53Figure 3-2: The Denoise Widget for the MRI Brain ScanNotice that you have retained 12.5% of the coefficients and have discarded 87.5%.The black regions of the “<strong>Wavelet</strong> Coeffs” plot shows the discarded coefficients. Thepercent difference between the original and filtered image is about 6%. Examiningthe filtered image, you will notice that much of the speckling around the outside isnow gone. In addition, some of the small-scale features and low-contrast regionswithin the image have been diminished. Finally, the dotted line on the CumulativePower graph indicates that although you are only retaining 12.5% of the informationyou are preserving almost 100% of the variance, or power.<strong>IDL</strong> <strong>Wavelet</strong> <strong>Toolkit</strong>Denoise
54 Chapter 3: Theory and ExamplesMultiresolution AnalysisBackgroundThe wavelet transform can be thought of as a band-pass filter, where the location andwidth in Fourier space depends on the wavelet scale. Larger scales imply a lowerfrequency and small bandwidth.In computing the wavelet transform, you change from small scales to larger scales. Ateach stage you can stop and compute the inverse wavelet transform using theremaining coefficients, while setting the small-scale coefficients to zero. You canthen build up a series of smooth (or low-passed), detailed (or band-passed), or rough(high-passed) versions of your original data.MethodDetails on computing the multiresolution analysis can be found in Lindsay et al.(1996).ExampleUse the “Mantle convection” dataset that is included in the <strong>Wavelet</strong> sample file. Thisdataset contains an image of convection within the Earth’s mantle.Try the following steps:1. Select the Convection dataset and start up the Multiresolution Analysis viewerusing either the Visualize Menu or the Toolbar button.2. As you progress from top to bottom the wavelet scale increases in powers oftwo. At the smallest scale most of the image is still in the Smooth image.Notice that the Rough image contains only the edges or discontinuities whichthe small scales can pick out.3. Change to the Haar wavelet and observe the different structure of the images.Multiresolution Analysis<strong>IDL</strong> <strong>Wavelet</strong> <strong>Toolkit</strong>
Chapter 3: Theory and Examples 55BibliographyDaubechies, I., 1992: Ten Lectures on <strong>Wavelet</strong>s. Society for Industrial and AppliedMathematics, 357 pp.Donoho, D. L. and I. M. Johnstone, 1994: Ideal spatial adaptation by waveletshrinkage. Biometrika, 81, 425–455.Hubbard, B. B., 1998: The World According to <strong>Wavelet</strong>s, 2nd ed. A. K. Peters,Wellesley, Mass., 331 pp.Lindsay, R. W., D. B. Percival, and D. A. Rothrock, 1996: The discrete wavelettransform and the scale analysis of the surface properties of sea ice. IEEE Trans.Geosci. Remote Sens., 34, 771–787.Mallat, S., 1989: Multiresolution approximation and wavelets. Trans. Amer. Math.Soc., 315, 69–88.Press, W. H., S. A. Teukolsky, W. T. Vetterling, and B. P. Flannery, 1992: NumericalRecipes in C: The Art of Scientific Computing, 2nd ed. Cambridge University Press,994 pp.Torrence, C., and G. P. Compo, 1998: A practical guide to wavelet analysis. Bull.Amer. Meteor. Soc., 79, 61–78.<strong>IDL</strong> <strong>Wavelet</strong> <strong>Toolkit</strong>Bibliography
56 Chapter 3: Theory and ExamplesBibliography<strong>IDL</strong> <strong>Wavelet</strong> <strong>Toolkit</strong>
Chapter 4<strong>IDL</strong> <strong>Wavelet</strong><strong>Toolkit</strong> ReferenceThis reference lists the following topics:List of Commands by Functionality . . . . . . 58WV_APPLET . . . . . . . . . . . . . . . . . . . . . . . 60WV_CW_WAVELET . . . . . . . . . . . . . . . . . 62WV_CWT . . . . . . . . . . . . . . . . . . . . . . . . . . 66WV_DENOISE . . . . . . . . . . . . . . . . . . . . . . 69WV_DWT . . . . . . . . . . . . . . . . . . . . . . . . . . 74WV_FN_COIFLET . . . . . . . . . . . . . . . . . . . 78WV_FN_DAUBECHIES . . . . . . . . . . . . . . 80WV_FN_GAUSSIAN . . . . . . . . . . . . . . . . . 82WV_FN_HAAR . . . . . . . . . . . . . . . . . . . . . 85WV_FN_MORLET . . . . . . . . . . . . . . . . . . 87WV_FN_PAUL . . . . . . . . . . . . . . . . . . . . . 90WV_FN_SYMLET . . . . . . . . . . . . . . . . . . 93WV_IMPORT_DATA . . . . . . . . . . . . . . . . 96WV_IMPORT_WAVELET . . . . . . . . . . . . 99WV_PLOT3D_WPS . . . . . . . . . . . . . . . . 100WV_PLOT_MULTIRES . . . . . . . . . . . . . 103WV_PWT . . . . . . . . . . . . . . . . . . . . . . . . . 106WV_TOOL_DENOISE . . . . . . . . . . . . . . 108<strong>IDL</strong> <strong>Wavelet</strong> <strong>Toolkit</strong> 57
58 Chapter 4: <strong>IDL</strong> <strong>Wavelet</strong> <strong>Toolkit</strong> ReferenceList of Commands by FunctionalityWidget Commands and Visualization ToolsThe following table describes the widget and visualization tools:CommandWV_APPLETWV_CW_WAVELETWV_IMPORT_DATAWV_IMPORT_WAVELETWV_PLOT3D_WPSWV_PLOT_MULTIRESWV_TOOL_DENOISEDescriptionRun <strong>IDL</strong> <strong>Wavelet</strong> <strong>Toolkit</strong> GUI (graphical userinterface).Compound widget to display and select wavelets.Import data from the <strong>IDL</strong>> command prompt.Import wavelet functions into the current applet.Run the wavelet power spectrum GUI.Run the multiresolution analysis GUI.Run the wavelet de-noising GUI.<strong>Wavelet</strong> TransformTable 4-1: Widget Commands and ToolsThe following table describes the wavelet transform commands:CommandWV_CWTWV_DENOISEWV_DWTWV_PWTDescriptionCompute the continuous wavelet transform of an array.Denoise an array using the discrete wavelet transform.Compute the discrete wavelet transform of an array.Compute the partial wavelet transform of a vector.Table 4-2: <strong>Wavelet</strong> Transform CommandsList of Commands by Functionality<strong>IDL</strong> <strong>Wavelet</strong> <strong>Toolkit</strong>
Chapter 4: <strong>IDL</strong> <strong>Wavelet</strong> <strong>Toolkit</strong> Reference 59<strong>Wavelet</strong> FunctionsThe following table describes the built-in wavelet functions:CommandWV_FN_COIFLETWV_FN_DAUBECHIESWV_FN_GAUSSIANWV_FN_HAARWV_FN_MORLETWV_FN_PAULWV_FN_SYMLETDescriptionConstruct coiflet wavelet coefficients.Construct Daubechies wavelet coefficients.Construct the Gaussian wavelet function.Construct Haar wavelet coefficients.Construct the Morlet wavelet function.Construct the Paul wavelet function.Construct symlet wavelet coefficients.Table 4-3: <strong>Wavelet</strong> Basis Functions<strong>IDL</strong> <strong>Wavelet</strong> <strong>Toolkit</strong>List of Commands by Functionality
60 Chapter 4: <strong>IDL</strong> <strong>Wavelet</strong> <strong>Toolkit</strong> ReferenceWV_APPLETSyntaxThe WV_APPLET procedure runs the <strong>IDL</strong> <strong>Wavelet</strong> <strong>Toolkit</strong> graphical user interface.WV_APPLET [, Input] [, ARRAY=array] [, GROUP_LEADER=widget_id][, /NO_SPLASH] [, TOOLS=string array] [, WAVELETS=string or string array]ArgumentsInputInput can be either a string giving the name of a <strong>IDL</strong> <strong>Wavelet</strong> <strong>Toolkit</strong> save file, or aone- or two-dimensional array of data. If Input is not specified, then the sample filewv_sample.sav is opened. If Input is set to null string ('') then the <strong>IDL</strong> <strong>Wavelet</strong><strong>Toolkit</strong> is started with an empty dataset.KeywordsARRAYSet this keyword to a one- or two-dimensional array of data to be imported into the<strong>IDL</strong> <strong>Wavelet</strong> <strong>Toolkit</strong> upon startup. If argument Input is set to a filename then ARRAYwill be added to the list of variables.GROUP_LEADERThe widget ID of an existing widget that serves as group leader for the newly-createdwidget. When a group leader is killed, for any reason, all widgets in the group arealso destroyed.A given widget can be in more than one group. The WIDGET_CONTROL procedurecan be used to add additional group associations to a widget. For more informationsee “WIDGET_CONTROL” (<strong>IDL</strong> Reference <strong>Guide</strong>). It is not possible to remove awidget from an existing group.NO_SPLASHIf this keyword is set then the splash screen will not be displayed on startup.WV_APPLET<strong>IDL</strong> <strong>Wavelet</strong> <strong>Toolkit</strong>
Chapter 4: <strong>IDL</strong> <strong>Wavelet</strong> <strong>Toolkit</strong> Reference 61TOOLSA scalar string or vector of strings giving the names of user-defined functions to beincluded in the WV_APPLET Tools menu. The actual function names are constructedby removing all white space from each name and attaching a prefix of WV_TOOL_.WAVELETSA scalar string or vector of strings giving the names of user-defined wavelet functionsto be included in WV_APPLET. The actual function names are constructed byremoving all white space from each name and attaching a prefix of WV_FN_.ExamplesWV_APPLET, TOOLS=['Renormalize','My Tool']The above statement will start up the <strong>Wavelet</strong> <strong>Toolkit</strong>, and add the user tools'Renormalize' and 'My Tool' to the Tools menu. When these are selected theactual functions that will be called are WV_TOOL_RENORMALIZE andWV_TOOL_MYTOOL.Version History5.3 IntroducedSee AlsoWV_CW_WAVELET, WV_IMPORT_DATA, WV_IMPORT_WAVELET,WV_PLOT3D_WPS, WV_PLOT_MULTIRES, WV_TOOL_DENOISE<strong>IDL</strong> <strong>Wavelet</strong> <strong>Toolkit</strong>WV_APPLET
62 Chapter 4: <strong>IDL</strong> <strong>Wavelet</strong> <strong>Toolkit</strong> ReferenceWV_CW_WAVELETSyntaxThe WV_CW_WAVELET function is a compound widget that lets the user select anddisplay wavelet functions. WV_CW_WAVELET is accessible from the VisualizeMenu of WV_APPLET.Result = WV_CW_WAVELET( [Parent] [, /DISCRETE] [, /NO_COLOR][, /NO_DRAW_WINDOW] [, TITLE=string] [, UNAME=string][, UVALUE=value] [, VALUE=structure] [, WAVELETS=string array] )Return ValueThe returned value of this function is the widget ID of the newly-created widget.ArgumentsParentThe widget ID of the parent widget. Omit this argument to created a top-level widget.KeywordsDISCRETESet this keyword to include only discrete wavelets in the list of wavelet functions. Setthis keyword to zero to include only continuous wavelets. The default is to include allavailable wavelets.NO_COLORIf this keyword is set, the wavelet functions will be drawn in black and white.NO_DRAW_WINDOWIf this keyword is set, the draw window will not be included within the widget.WV_CW_WAVELET<strong>IDL</strong> <strong>Wavelet</strong> <strong>Toolkit</strong>
Chapter 4: <strong>IDL</strong> <strong>Wavelet</strong> <strong>Toolkit</strong> Reference 63TITLESet this keyword equal to a scalar string containing the title of the top level base.TITLE is not used if the wavelet widget has a parent widget. If it is not specified, thedefault title is “<strong>Wavelet</strong>s.”UNAMESet this keyword to a string that can be used to identify the widget in your code. Youcan associate a name with each widget in a specific hierarchy, and then use that nameto query the widget hierarchy and get the correct widget ID.To query the widget hierarchy, use the WIDGET_INFO function with theFIND_BY_UNAME keyword. See “WIDGET_INFO” (<strong>IDL</strong> Reference <strong>Guide</strong>) formore information. The UNAME should be unique to the widget hierarchy becausethe FIND_BY_UNAME keyword returns the ID of the first widget with the specifiedname.UVALUESet this keyword equal to the user value associated with the widget.VALUESet this keyword to an anonymous structure of the form {FAMILY:'', ORDER:0d}representing the initial value for the widget.WAVELETSA scalar string or vector of strings giving the names of user-defined wavelet functionsto be included in WV_CW_WAVELET. The actual function names are constructedby removing all white space from each name and attaching a prefix of WV_FN_.Widget Keywords AcceptedThe WV_CW_WAVELET function also accepts the following WIDGET_BASEkeywords: ALIGN_BOTTOM, ALIGN_CENTER, ALIGN_LEFT, ALIGN_RIGHT,ALIGN_TOP, DISPLAY_NAME, FRAME, GROUP_LEADER,KBRD_FOCUS_EVENTS, MAP, NOTIFY_REALIZE, RESOURCE_NAME,SCR_XSIZE, SCR_YSIZE, SPACE, TLB_FRAME_ATTR, TRACKING_EVENTS,UNITS, XOFFSET, XSIZE, YOFFSET, YSIZE. See “WIDGET_BASE” (<strong>IDL</strong>Reference <strong>Guide</strong>) for more information.<strong>IDL</strong> <strong>Wavelet</strong> <strong>Toolkit</strong>WV_CW_WAVELET
64 Chapter 4: <strong>IDL</strong> <strong>Wavelet</strong> <strong>Toolkit</strong> ReferenceKeywords to WIDGET_CONTROL and WIDGET_INFOThe widget ID returned by most compound widgets is actually the ID of thecompound widget’s base widget. This means that many keywords to theWIDGET_CONTROL and WIDGET_INFO routines that affect or return informationon base widgets can be used with compound widgets.In addition, you can use the GET_VALUE and SET_VALUE keywords toWIDGET_CONTROL to obtain or set the value of the wavelet. Use the command:WIDGET_CONTROL, id, GET_VALUE=valueto read the current wavelet. To change the current wavelet, use the command:WIDGET_CONTROL, id, SET_VALUE=valueIn both cases value is an anonymous structure, {FAMILY: '', ORDER: 0}, whereFAMILY is a string containing the name (for example ‘Daubechies’), and ORDER isa variable giving the order number. Depending on the family, ORDER can be of typeInteger or Double.See “Creating a Compound Widget” (Chapter 2, User Interface Programming) for amore complete discussion of controlling compound widgets usingWIDGET_CONTROL and WIDGET_INFO.Widget Events Returned by the WV_CW_WAVELETWidgetThis widget generates event structures each time the family or order is changed. Theevent structure has the following definition:Event = { ID:0L, TOP:0L, HANDLER:0L, FAMILY:'', ORDER:0}The ID field is the widget ID of the WV_CW_WAVELET widget. The TOP field isthe widget ID of the top-level widget. HANDLER is the widget ID of the widgethandler. The FAMILY field contains the family name. The ORDER field containsthe order number, and can be an Integer or a Double depending on the family.Version History5.3 IntroducedWV_CW_WAVELET<strong>IDL</strong> <strong>Wavelet</strong> <strong>Toolkit</strong>
Chapter 4: <strong>IDL</strong> <strong>Wavelet</strong> <strong>Toolkit</strong> Reference 65See AlsoWV_FN_COIFLET, WV_FN_DAUBECHIES, WV_FN_GAUSSIAN,WV_FN_HAAR, WV_FN_MORLET, WV_FN_PAUL, WV_FN_SYMLET<strong>IDL</strong> <strong>Wavelet</strong> <strong>Toolkit</strong>WV_CW_WAVELET
66 Chapter 4: <strong>IDL</strong> <strong>Wavelet</strong> <strong>Toolkit</strong> ReferenceWV_CWTSyntaxThe WV_CWT function returns the one-dimensional continuous wavelet transformof the input array. The transform is done using a user-inputted wavelet function.Result = WV_CWT(Array, Family, Order [, /DOUBLE] [, DSCALE=scalar][, NSCALE=scalar] [, /PAD] [, SCALE=variable] [, START_SCALE=scalar])Return ValueThe result is a two-dimensional array of type complex or double complex, containingthe continuous wavelet transform of the input Array.ArgumentsArrayA one-dimensional array of length N, of floating-point or complex type.FamilyA scalar string giving the name of the wavelet function to use for the transform.OrderThe order number, or parameter, for the wavelet function given by Family.KeywordsDOUBLESet this keyword to force the computation to be done in double-precision arithmetic.DSCALESet this keyword to a scalar value giving the spacing between scale values, inlogarithmic units. The default is 0.25, which gives four subscales within each majorscale.WV_CWT<strong>IDL</strong> <strong>Wavelet</strong> <strong>Toolkit</strong>
Chapter 4: <strong>IDL</strong> <strong>Wavelet</strong> <strong>Toolkit</strong> Reference 67NSCALESet this keyword to a scalar value giving the total number of scale values to use forthe wavelet transform. The default is [log 2 (N/START_SCALE)]/DSCALE+1.PADSet this keyword to force Array to be padded with zeroes before computing thetransform. Enough zeroes are added to make the total length of Array equal to thenext-higher power-of-two greater than 2N. Padding with zeroes prevents wraparoundof the Array and speeds up the fast Fourier transform.NotePadding with zeroes reduces, but does not eliminate, edge effects caused by thediscontinuities at the start and end of the data.SCALESet this keyword to a named variable in which to return the scale values used for thecontinuous wavelet transform. The SCALE values range from START_SCALE up toSTART_SCALE·2^[(NSCALE–1)DSCALE].START_SCALESet this keyword to a scalar value giving the starting scale, in non-dimensional units.The default is 2, which gives a starting scale that is twice the spacing between Arrayelements.ReferenceTorrence and Compo, 1998: A Practical <strong>Guide</strong> to <strong>Wavelet</strong> Analysis. Bull. Amer.Meteor. Soc., 79, 61–78.Example; Assume we have monthly random data.n = 500dt = 1d/12 ; time samplingseed = 999data = RANDOMN(seed, n)time = 1960 + dt*FINDGEN(n); Compute the wavelet transform and the power.wave = WV_CWT(data, 'Morlet', 6, /PAD, SCALE=scales)<strong>IDL</strong> <strong>Wavelet</strong> <strong>Toolkit</strong>WV_CWT
68 Chapter 4: <strong>IDL</strong> <strong>Wavelet</strong> <strong>Toolkit</strong> ReferencewavePower = ABS(wave^2); Convert scales to time units.scales *= dt; Contour visualization.ICONTOUR, wavePower, time, scales, /Y_LOG, YRANGE=[20,0.25], $C_VALUE=FINDGEN(7)+1, $/FILL, RGB_TABLE=39, $YTITLE='Scale (years)', $VIEW_TITLE='<strong>Wavelet</strong> Power'; Insert a legend.tool = IGETCURRENT(TOOL=oTool)void = oTool->DoAction('Operations/Insert/Legend')Version History5.4 IntroducedSee AlsoWV_DWT, WV_FN_GAUSSIAN, WV_FN_MORLET, WV_FN_PAULWV_CWT<strong>IDL</strong> <strong>Wavelet</strong> <strong>Toolkit</strong>
Chapter 4: <strong>IDL</strong> <strong>Wavelet</strong> <strong>Toolkit</strong> Reference 69WV_DENOISEThe WV_DENOISE function uses the wavelet transform to filter (or de-noise) amulti-dimensional array.WV_DENOISE computes the discrete wavelet transform of Array, and then discardswavelet coefficients smaller than a certain threshold. WV_DENOISE then computesthe inverse wavelet transform on the filtered coefficients and returns the result.SyntaxResult = WV_DENOISE(Array [, Family, Order] [, COEFFICIENTS=value][, CUTOFF=variable] [, DENOISE_STATE=variable] [, /DOUBLE][, DWT_FILTERED=variable] [, PERCENT=value] [, THRESHOLD=value][, WPS_FILTERED=variable])Return ValueThe result is an array of the same dimensions as the input Array. If Array is doubleprecision or /DOUBLE is set then the result is double precision, otherwise the resultis single precision.ArgumentsArrayA one-dimensional array of length N, of floating-point or complex type.FamilyA scalar string giving the name of the wavelet function to use for the transform.WV_DENOISE will construct the actual function name by removing all white spaceand attaching a prefix of 'WV_FN_'.NoteWV_DENOISE may only be used with discrete wavelets, such asWV_FN_COIFLET, WV_FN_DAUBECHIES, WV_FN_HAAR, andWV_FN_SYMLET.<strong>IDL</strong> <strong>Wavelet</strong> <strong>Toolkit</strong>WV_DENOISE
70 Chapter 4: <strong>IDL</strong> <strong>Wavelet</strong> <strong>Toolkit</strong> ReferenceOrderThe order number, or parameter, for the wavelet function given by Family. If notspecified the default for the wavelet function will be used.NoteIf you pass in a DENOISE_STATE structure, then Family and Order may beomitted. In this case the values from DENOISE_STATE are used.KeywordsCOEFFICIENTSSet this keyword to a scalar specifying the number of wavelet coefficients to retain inthe filtered wavelet transform. This keyword is ignored if keyword PERCENT ispresent.CUTOFFSet this keyword to a named variable that, upon return, will contain the cutoff valueof wavelet power that was used for the threshold.DENOISE_STATEThis is both an input and an output keyword. If this keyword is set to a namedvariable, then on exit, DENOISE_STATE will contain the following structure:Tag Type DefinitionFAMILY STRING Name of the wavelet function used.ORDER DOUBLE Order for the wavelet function.DWT FLT/DBLARR Discrete wavelet transform of ArrayWPS FLT/DBLARR <strong>Wavelet</strong> power spectrum, equal to|DWT|^2SORTED FLT/DBLARR Percent-normalized WPS, sortedCUMULATIVE FLT/DBLARR Cumulative sum of SORTEDTable 4-4: The Structure Tags for DENOISE_STATEWV_DENOISE<strong>IDL</strong> <strong>Wavelet</strong> <strong>Toolkit</strong>
Chapter 4: <strong>IDL</strong> <strong>Wavelet</strong> <strong>Toolkit</strong> Reference 71Tag Type DefinitionCOEFFICIENTS LONG Number of coefficients retainedPERCENT DOUBLE Percent of coefficients retainedTable 4-4: The Structure Tags for DENOISE_STATE (Continued)NoteIf the DOUBLE keyword is set, then the arrays will be of type double.Upon input, if DENOISE_STATE is set to a structure with the above form, thenDWT, WPS, SORTED, and CUMULATIVE will not be recomputed byWV_DENOISE. This is useful if you want to make multiple calls to WV_DENOISEusing the same Array.WarningNo error checking is made on the input values. The values should not be modifiedbetween calls to DENOISE_STATE.DOUBLESet this keyword to force the computation to be done using double-precisionarithmetic.DWT_FILTEREDSet this keyword to a named variable in which the filtered discrete wavelet transformwill be returned.PERCENTSet this keyword to a scalar specifying the percentage of cumulative power to retain.NoteIf neither COEFFICIENTS nor PERCENT is present then all of the coefficients areretained (i.e. no filtering is done).<strong>IDL</strong> <strong>Wavelet</strong> <strong>Toolkit</strong>WV_DENOISE
72 Chapter 4: <strong>IDL</strong> <strong>Wavelet</strong> <strong>Toolkit</strong> ReferenceTHRESHOLDSet this keyword to a scalar specifying the type of threshold. The actual threshold, T,is set using COEFFICIENTS or PERCENT. Possible values are:ValueDescriptionWPS_FILTEREDSet this keyword to a named variable in which the filtered wavelet power spectrumwill be returned.ExamplesRemove the noise from a 128 x 128 image:image = dist(128) + 5*randomn(1, 128, 128); Keep only 100 out of 16384 coefficients:denoise = WV_DENOISE(image, 'Daubechies', 2, COEFF=100, $DENOISE_STATE=denoise_state)window, xsize=256, ysize=155tvscl, image, 0tvscl, denoise, 1xyouts, [64, 196], [5, 5], ['Image', 'Filtered'], $/device, align=0.5, charsize=2print, 'Percent of power retained: ', denoise_state.percent<strong>IDL</strong> prints:0 Hard threshold (this is the default). The hard threshold sets all waveletcoefficients with magnitude less than or equal to T to zero.1 Soft threshold. The soft threshold sets all DWT[i] with magnitude lessthan T to zero, and also linearly reduces the magnitude of the eachretained wavelet coefficient by T: Positive coefficients are set equal toDWT[i] – T, while negative coefficients are set equal to DWT[i] + T.Table 4-5: THRESHOLD ValuesPercent of power retained: 93.151491Change to a “soft” threshold (use DENOISE_STATE to avoid re-computing):denoise2 = WV_DENOISE(image, COEFF=100, $DENOISE_STATE=denoise_state, THRESHOLD=1)WV_DENOISE<strong>IDL</strong> <strong>Wavelet</strong> <strong>Toolkit</strong>
Chapter 4: <strong>IDL</strong> <strong>Wavelet</strong> <strong>Toolkit</strong> Reference 73Version HistoryFigure 4-1: Example of De-Noising an Image.5.4 IntroducedSee AlsoWV_DWT, WV_TOOL_DENOISE<strong>IDL</strong> <strong>Wavelet</strong> <strong>Toolkit</strong>WV_DENOISE
74 Chapter 4: <strong>IDL</strong> <strong>Wavelet</strong> <strong>Toolkit</strong> ReferenceWV_DWTThe WV_DWT function returns the multi-dimensional discrete wavelet transform ofthe input Array. The transform is done by WV_PWT using a user-inputted waveletfilter.The length of each dimension of Array must be either a power of two (2), or must beless than four (4). The transform is not computed over dimensions of lengths less thanfour (4), but is computed over all other dimensions (for example, the wavelettransform of an array of size [3, 256] is computed over each [1, 256] column vector).WV_DWT is based on the routine wtn described in section 13.10 of NumericalRecipes in C: The Art of Scientific Computing, 2nd ed. (Cambridge University Press),and is used by permission.SyntaxResult = WV_DWT(Array, Scaling, <strong>Wavelet</strong>, Ioff, Joff [, /DOUBLE] [, /INVERSE][, N_LEVELS=value])Return ValueThe result is an output array of the same dimensions as Array, containing the discretewavelet transform over each dimension.ArgumentsArrayThe input vector or array. The length of each dimension must be either less than four(4) or a power of two (2).ScalingA vector of scaling (father) coefficients, of length N.<strong>Wavelet</strong>A vector of wavelet (mother) coefficients, of length N.WV_DWT<strong>IDL</strong> <strong>Wavelet</strong> <strong>Toolkit</strong>
Chapter 4: <strong>IDL</strong> <strong>Wavelet</strong> <strong>Toolkit</strong> Reference 75IoffJoffAn integer that specifies the support offset for Scaling. To center the scaling functionover each point in Array, set Ioff to –N/2+2.An integer that specifies the support offset for <strong>Wavelet</strong>. To center the waveletfunction over each point in Array, set Joff to –N/2+2.KeywordsDOUBLESet this keyword to force the computation to be done in double-precision arithmetic.INVERSEIf set, the inverse transform is computed. By default, the forward transform iscomputed.N_LEVELSSet this keyword to the number of wavelet levels to compute in the pyramidalgorithm, starting with the smallest wavelet scale and progressing to larger scales. Ifthis keyword is not set or is set to zero, then all wavelet levels in the pyramidalgorithm are computed.Method and Result FormatThe WV_DWT function computes the wavelet coefficients using the pyramidalalgorithm (Mallat 1989).One-Dimensional VectorFor a one-dimensional vector, the pyramid appears below:Array elements[ 0, 1, 2, 3, 4, 5, 6, 7, 8, 9, 10, 11, 12, 13, 14, 15]\ / \ / \ / \ / \ / \ / \ / \ /s0,d0 s1,d1 s2,d2 s3,d3 s4,d4 s5,d5 s6,d6 s7,d7\ / \ / \ / \ /\ / \ / \ / \ /S0,D0 S1,D1 S2,D2 S3,D3\ / \ /\ / \ /<strong>IDL</strong> <strong>Wavelet</strong> <strong>Toolkit</strong>WV_DWT
76 Chapter 4: <strong>IDL</strong> <strong>Wavelet</strong> <strong>Toolkit</strong> Reference\ / \ /S0,D0S1,D1At each level of the hierarchy, the WV_PWT function is used to compute the scalingcoefficient Si and wavelet coefficient Di (where i represents the position). Theletters s, S, S and d, D, D represent increasing scale. The wavelet coefficients arestored in Result in order from largest scales to smallest:Result = [ S0, S1, D0, D1, D0, D1, D2, D3,d0, d1, d2, d3, d4, d5, d6, d7 ]Two-Dimensional ArrayFor a two-dimensional Array, the wavelet transform is computed using the pyramidalalgorithm along each dimension. The wavelet coefficients are stored in order with thelargest scales in the [0, 0] position. As an example, for an 8 x 8 Array, the Result is an8 x 8 array with the following structure:[0,0][[ A0B0 A1B0 C0B0 C1B0 c0B0 c1B0 c2B0 c3B0 ],[ A0B1 A1B1 C0B1 C1B1 c0B1 c1B1 c2B1 c3B1 ],[ A0D0 A1D0 C0D0 C1D0 c0D0 c1D0 c2D0 c3D0 ],[ A0D1 A1D1 C0D1 C1D1 c0D1 c1D1 c2D1 c3D1 ],[ A0d0 A1d0 C0d0 C1d0 c0d0 c1d0 c2d0 c3d0 ],[ A0d1 A1d1 C0d1 C1d1 c0d1 c1d1 c2d1 c3d1 ],[ A0d2 A1d2 C0d2 C1d2 c0d2 c1d2 c2d2 c3d2 ],[ A0d3 A1d3 C0d3 C1d3 c0d3 c1d3 c2d3 c3d3 ]]Here A and B represent the scale coefficients for the first and second dimensions,respectively, The C and D represent the largest-scale wavelet coefficients for the firstand second dimensions, respectively, while c and d represent the small-scale waveletcoefficients. Subscripts 0, 1, 2, 3 denote the position of the wavelet within the image.ExampleThe following example shows how to compute the first three levels of the pyramidalgorithm using either the N_LEVELS keyword or WV_PWT:; Construct a random vector.n = 1024x = randomn(s,n)info = WV_FN_DAUBECHIES(2, wavelet, scaling, ioff, joff); Take the wavelet transform but stop at level 3.WV_DWT<strong>IDL</strong> <strong>Wavelet</strong> <strong>Toolkit</strong>
Chapter 4: <strong>IDL</strong> <strong>Wavelet</strong> <strong>Toolkit</strong> Reference 77wv_dwtpartial = WV_DWT(x, wavelet, scaling, ioff, joff, $N_LEVELS=3); First level of the pyramid algorithm.wv_level1 = WV_PWT(x, wavelet, scaling, ioff, joff)w_scaling1 = wv_level1[0:n/2-1] ; Left (scaling) halfw_wavelet1 = wv_level1[n/2:*] ; Right (wavelet) half; Second level of the pyramid algorithm.wv_level2 = WV_PWT(w_scaling1, wavelet, scaling, ioff, joff)w_scaling2 = wv_level2[0:n/4-1] ; Left (scaling) halfw_wavelet2 = wv_level2[n/4:*] ; Right (wavelet) half; Third level of the pyramid algorithm.wv_level3 = WV_PWT(w_scaling2, wavelet, scaling, ioff, joff); Verify that using WV_DWT with N_LEVELS=3; is the same as calling WV_PWT three times.wv_partial123 = [wv_level3, w_wavelet2, w_wavelet1]print, MAX(ABS(wv_dwtpartial - wv_partial123))<strong>IDL</strong> prints:0.000000Version History5.3 Introduced6.1 Added N_LEVELS keywordSee AlsoWV_CWT, WV_PWT, WTN<strong>IDL</strong> <strong>Wavelet</strong> <strong>Toolkit</strong>WV_DWT
78 Chapter 4: <strong>IDL</strong> <strong>Wavelet</strong> <strong>Toolkit</strong> ReferenceWV_FN_COIFLETSyntaxThe WV_FN_COIFLET function constructs wavelet coefficients for the coifletwavelet function.Result = WV_FN_COIFLET( [Order, Scaling, <strong>Wavelet</strong>, Ioff, Joff] )Return ValueThe returned value of this function is an anonymous structure of information aboutthe particular wavelet.Tag Type DefinitionFAMILY STRING ‘Coiflet’ORDER_NAME STRING ‘Order’ORDER_RANGE INTARR(3) [1, 5, 1] Valid order range [first, last, default]ORDER INT The chosen OrderDISCRETE INT 1 [0=continuous, 1=discrete]ORTHOGONAL INT 1 [0=nonorthogonal, 1=orthogonal]SYMMETRIC INT 2 [0=asymmetric, 1=symm., 2=near symm.]SUPPORT INT 6*Order – 1 [Compact support width]MOMENTS INT 2*Order [Number of vanishing moments]REGULARITY DOUBLE The number of continuous derivativesArgumentsTable 4-6: Structure Tags for ResultOrderA scalar that specifies the order number for the wavelet. The default is 1.WV_FN_COIFLET<strong>IDL</strong> <strong>Wavelet</strong> <strong>Toolkit</strong>
Chapter 4: <strong>IDL</strong> <strong>Wavelet</strong> <strong>Toolkit</strong> Reference 79ScalingOn output, contains a vector of double-precision scaling (father) coefficients.<strong>Wavelet</strong>IoffJoffOn output, contains a vector of double-precision wavelet (mother) coefficients.On output, contains an integer that specifies the support offset for Scaling.On output, contains an integer that specifies the support offset for <strong>Wavelet</strong>.NoteIf none of the above arguments are present then the function will simply return theResult structure using the default Order.KeywordsNone.ReferenceCoefficients are from Daubechies, I., 1992: Ten Lectures on <strong>Wavelet</strong>s, SIAM, p. 261.Note that Daubechies has divided by Sqrt(2), and the coefficients are reversed.Version History5.3 IntroducedSee AlsoWV_DWT, WV_FN_DAUBECHIES, WV_FN_HAAR, WV_FN_SYMLET<strong>IDL</strong> <strong>Wavelet</strong> <strong>Toolkit</strong>WV_FN_COIFLET
80 Chapter 4: <strong>IDL</strong> <strong>Wavelet</strong> <strong>Toolkit</strong> ReferenceWV_FN_DAUBECHIESSyntaxThe WV_FN_DAUBECHIES function constructs wavelet coefficients for theDaubechies wavelet function.Result = WV_FN_DAUBECHIES( [Order, Scaling, <strong>Wavelet</strong>, Ioff, Joff] )Return ValueThe returned value of this function is an anonymous structure of information aboutthe particular wavelet.Tag Type DefinitionFAMILY STRING ‘Daubechies’ORDER_NAME STRING ‘Order’ORDER_RANGE INTARR(3) [1, 24, 2] Valid order range [first, last, default]ORDER INT The chosen OrderDISCRETE INT 1 [0=continuous, 1=discrete]ORTHOGONAL INT 1 [0=nonorthogonal, 1=orthogonal]SYMMETRIC INT 0 [0=asymmetric, 1=symm., 2=near symm.]SUPPORT INT 2*Order – 1 [Compact support width]MOMENTS INT Order [Number of vanishing moments]REGULARITY DOUBLE The number of continuous derivativesArgumentsTable 4-7: Structure Tags for ResultOrderA scalar that specifies the order number for the wavelet. The default is 2.WV_FN_DAUBECHIES<strong>IDL</strong> <strong>Wavelet</strong> <strong>Toolkit</strong>
Chapter 4: <strong>IDL</strong> <strong>Wavelet</strong> <strong>Toolkit</strong> Reference 81ScalingOn output, contains a vector of double-precision scaling (father) coefficients.<strong>Wavelet</strong>IoffJoffOn output, contains a vector of double-precision wavelet (mother) coefficients.On output, contains an integer that specifies the support offset for Scaling.On output, contains an integer that specifies the support offset for <strong>Wavelet</strong>.NoteIf none of the above arguments are present then the function will simply return theResult structure using the default Order.KeywordsNone.ReferenceCoefficients for orders 1–10 are from Daubechies, I., 1992: Ten Lectures on<strong>Wavelet</strong>s, SIAM, p. 195. Note that Daubechies has multiplied by Sqrt(2). Coefficientsfor orders 11–24 are from http://www.isds.duke.edu/~brani/filters.html.Version History5.3 IntroducedSee AlsoWV_DWT, WV_FN_COIFLET, WV_FN_HAAR, WV_FN_SYMLET<strong>IDL</strong> <strong>Wavelet</strong> <strong>Toolkit</strong>WV_FN_DAUBECHIES
82 Chapter 4: <strong>IDL</strong> <strong>Wavelet</strong> <strong>Toolkit</strong> ReferenceWV_FN_GAUSSIANSyntaxThe WV_FN_GAUSSIAN function constructs wavelet coefficients for the Gaussianwavelet function. In real space, the Gaussian wavelet function is proportional to them-th order derivative of a Gaussian, exp(–x 2 /2). The Gaussian second derivative,(x 2 –1) exp(–x 2 /2), is often referred to as the Marr wavelet.Result = WV_FN_GAUSSIAN( [Order] [, Scale, N][, /DOUBLE] [, FREQUENCY=variable] [, /SPATIAL] [, WAVELET=variable])The returned value of this function is an anonymous structure of information aboutthe particular wavelet.Tag Type DefinitionFAMILY STRING ‘Gaussian’ORDER_NAME STRING ‘Derivative’ORDER_RANGE DBLARR(3) Valid orders [first, last, default]ORDER DOUBLE The chosen OrderDISCRETE INT 0 [0=continuous, 1=discrete]ORTHOGONAL INT 0 [0=nonorthogonal, 1=orthogonal]SYMMETRIC INT 1 [0=asymmetric, 1=symm.]SUPPORT DOUBLE Infinity [Compact support width]MOMENTS INT 1 [Number of vanishing moments]REGULARITY DOUBLE Infinity [Number of continuousderivatives]E_FOLDING DOUBLE SQRT(2) [Autocorrelation e-fold distance]FOURIER_PERIOD DOUBLE Ratio of Fourier wavelength to scaleTable 4-8: Structure Tags for ResultWV_FN_GAUSSIAN<strong>IDL</strong> <strong>Wavelet</strong> <strong>Toolkit</strong>
Chapter 4: <strong>IDL</strong> <strong>Wavelet</strong> <strong>Toolkit</strong> Reference 83ArgumentsOrderA scalar that specifies the non-dimensional order parameter for the wavelet. Thedefault is 2.ScaleNA scalar that specifies the scale at which to construct the wavelet function.An integer that specifies the number of points in the wavelet function. For Fourierspace (SPATIAL=0), the frequencies are constructed following the FFT convention:• For N even: 0, 1/N, 2/N, ..., (N–2)/(2N), 1/2, –(N–2)/(2N), ..., –1/N.• For N odd: 0, 1/N, 2/N, ..., (N–1)/(2N), –(N–1)/(2N), ..., –1/N.For real space (/SPATIAL), the spatial coordinates are –(N–1)/2...(N–1)/2.NoteIf none of the above arguments are present then the function will simply return theResult structure using the default Order.KeywordsDOUBLESet this keyword to force the computation to be done in double-precision arithmetic.FREQUENCYSet this keyword to a named variable in which to return the frequency array used toconstruct the wavelet. This variable will be undefined if SPATIAL is set.SPATIALSet this keyword to return the wavelet function in real space. The default is to returnthe wavelet function in Fourier space.WAVELETSet this keyword to a named variable in which to return the wavelet function.<strong>IDL</strong> <strong>Wavelet</strong> <strong>Toolkit</strong>WV_FN_GAUSSIAN
84 Chapter 4: <strong>IDL</strong> <strong>Wavelet</strong> <strong>Toolkit</strong> ReferenceReferenceTorrence and Compo, 1998: A Practical <strong>Guide</strong> to <strong>Wavelet</strong> Analysis. Bull. Amer.Meteor. Soc., 79, 61–78.ExamplesPlot the Gaussian wavelet function at scale=20:n = 1000 ; pick a nice number of pointsinfo = WV_FN_GAUSSIAN( 2, 20, n, /SPATIAL, $WAVELET=wavelet)plot, waveletNow plot the same wavelet in Fourier space:info = WV_FN_GAUSSIAN( 2, 20, n, $FREQUENCY=frequency, WAVELET=wave_fourier)plot, frequency, wave_fourier, $xrange=[-0.2,0.2], thick=2Version History5.4 IntroducedSee AlsoWV_CWT, WV_FN_MORLET, WV_FN_PAULWV_FN_GAUSSIAN<strong>IDL</strong> <strong>Wavelet</strong> <strong>Toolkit</strong>
Chapter 4: <strong>IDL</strong> <strong>Wavelet</strong> <strong>Toolkit</strong> Reference 85WV_FN_HAARThe WV_FN_HAAR function constructs wavelet coefficients for the Haar waveletfunction.NoteThe Haar wavelet is the same as the Daubechies wavelet of order 1.SyntaxResult = WV_FN_HAAR( [Order, Scaling, <strong>Wavelet</strong>, Ioff, Joff] )Return ValueThe returned value of this function is an anonymous structure of information aboutthe particular wavelet.Tag Type DefinitionFAMILY STRING ‘Haar’ORDER_NAME STRING ‘Order’ORDER_RANGE INTARR(3) [1, 1, 1] Valid order range [first, last, default]ORDER INT 1DISCRETE INT 1 [0=continuous, 1=discrete]ORTHOGONAL INT 1 [0=nonorthogonal, 1=orthogonal]SYMMETRIC INT 0 [0=asymmetric, 1=symm., 2=near symm.]SUPPORT INT 1 [Compact support width]MOMENTS INT 1 [Number of vanishing moments]REGULARITY DOUBLE 0d [Number of continuous derivatives]Table 4-9: Structure Tags for Result<strong>IDL</strong> <strong>Wavelet</strong> <strong>Toolkit</strong>WV_FN_HAAR
86 Chapter 4: <strong>IDL</strong> <strong>Wavelet</strong> <strong>Toolkit</strong> ReferenceArgumentsOrderA scalar that specifies the order number for the wavelet. The default is 1.ScalingOn output, contains a vector of double-precision scaling (father) coefficients.<strong>Wavelet</strong>IoffJoffOn output, contains a vector of double-precision wavelet (mother) coefficients.On output, contains an integer that specifies the support offset for Scaling.On output, contains an integer that specifies the support offset for <strong>Wavelet</strong>.NoteIf none of the above arguments are present then the function will simply return theResult structure using the default Order.KeywordsNone.ReferenceDaubechies, I., 1992: Ten Lectures on <strong>Wavelet</strong>s, SIAM.Version History5.3 IntroducedSee AlsoWV_DWT, WV_FN_COIFLET, WV_FN_DAUBECHIES, WV_FN_SYMLETWV_FN_HAAR<strong>IDL</strong> <strong>Wavelet</strong> <strong>Toolkit</strong>
Chapter 4: <strong>IDL</strong> <strong>Wavelet</strong> <strong>Toolkit</strong> Reference 87WV_FN_MORLETSyntaxThe WV_FN_MORLET function constructs wavelet coefficients for the Morletwavelet function. In real space, the Morlet wavelet function consists of a complexexponential modulated by a Gaussian envelope: π –1/4 s –1/2 exp[i kx/ s] exp[–(x / s) 2 /2], where s is the wavelet scale, k is a non-dimensional parameter, and x is theposition.Result = WV_FN_MORLET( [Order] [, Scale, N] [, /DOUBLE][, FREQUENCY=variable] [, /SPATIAL] [, WAVELET=variable])Return ValueThe returned value of this function is an anonymous structure of information aboutthe particular wavelet.Tag Type DefinitionFAMILY STRING ‘Morlet’ORDER_NAME STRING ‘Parameter’ORDER_RANGE DBLARR(3) [3, 24, 6] Valid orders [first, last, default]ORDER DOUBLE The chosen OrderDISCRETE INT 0 [0=continuous, 1=discrete]ORTHOGONAL INT 0 [0=nonorthogonal, 1=orthogonal]SYMMETRIC INT 1 [0=asymmetric, 1=symm.]SUPPORT DOUBLE Infinity [Compact support width]MOMENTS INT 1 [Number of vanishing moments]REGULARITY DOUBLE Infinity [Number of continuous derivatives]E_FOLDING DOUBLE SQRT(2) [Autocorrelation e-fold distance]FOURIER_PERIOD DOUBLE Ratio of Fourier wavelength to scaleTable 4-10: Structure Tags for Result<strong>IDL</strong> <strong>Wavelet</strong> <strong>Toolkit</strong>WV_FN_MORLET
88 Chapter 4: <strong>IDL</strong> <strong>Wavelet</strong> <strong>Toolkit</strong> ReferenceArgumentsOrderA scalar that specifies the non-dimensional order parameter for the wavelet. Thedefault is 6.ScaleNA scalar that specifies the scale at which to construct the wavelet function.An integer that specifies the number of points in the wavelet function. For Fourierspace (SPATIAL=0), the frequencies are constructed following the FFT convention:• For N even: 0, 1/N, 2/N, ..., (N–2)/(2N), 1/2, –(N–2)/(2N), ..., –1/N.• For N odd: 0, 1/N, 2/N, ..., (N–1)/(2N), –(N–1)/(2N), ..., –1/N.For real space (/SPATIAL), the spatial coordinates are –(N–1)/2...(N–1)/2.NoteIf none of the above arguments are present then the function will simply return theResult structure using the default Order.KeywordsDOUBLESet this keyword to force the computation to be done in double-precision arithmetic.FREQUENCYSet this keyword to a named variable in which to return the frequency array used toconstruct the wavelet. This variable will be undefined if SPATIAL is set.SPATIALSet this keyword to return the wavelet function in real space. The default is to returnthe wavelet function in Fourier space.WAVELETSet this keyword to a named variable in which to return the wavelet function.WV_FN_MORLET<strong>IDL</strong> <strong>Wavelet</strong> <strong>Toolkit</strong>
Chapter 4: <strong>IDL</strong> <strong>Wavelet</strong> <strong>Toolkit</strong> Reference 89ReferenceTorrence and Compo, 1998: A Practical <strong>Guide</strong> to <strong>Wavelet</strong> Analysis. Bull. Amer.Meteor. Soc., 79, 61–78.ExamplesPlot the Morlet wavelet function at scale=100:n = 1000 ; pick a nice number of pointsinfo = WV_FN_MORLET( 6, 100, n, /SPATIAL, $WAVELET=wavelet)plot, float(wavelet), THICK=2oplot, imaginary(wavelet)Now plot the same wavelet in Fourier space:info = WV_FN_MORLET( 6, 100, n, $FREQUENCY=frequency, WAVELET=wave_fourier)plot, frequency, wave_fourier, $xrange=[-0.2,0.2], thick=2Version History5.4 IntroducedSee AlsoWV_CWT, WV_FN_GAUSSIAN, WV_FN_PAUL<strong>IDL</strong> <strong>Wavelet</strong> <strong>Toolkit</strong>WV_FN_MORLET
90 Chapter 4: <strong>IDL</strong> <strong>Wavelet</strong> <strong>Toolkit</strong> ReferenceWV_FN_PAULSyntaxThe WV_FN_PAUL function constructs wavelet coefficients for the Paul waveletfunction. In real space, the Paul wavelet function is proportional to the complexpolynomial (1 – i x / s)^(–m–1), where s is the wavelet scale, m is a non-dimensionalparameter, and x is the position.Result = WV_FN_PAUL( [Order] [, Scale, N] [, /DOUBLE][, FREQUENCY=variable] [, /SPATIAL] [, WAVELET=variable])Return ValueThe returned value of this function is an anonymous structure of information aboutthe particular wavelet.Tag Type DefinitionFAMILY STRING ‘Paul’ORDER_NAME STRING ‘Parameter’ORDER_RANGE DBLARR(3) [1, 20, 4] Valid orders [first, last, default]ORDER DOUBLE The chosen OrderDISCRETE INT 0 [0=continuous, 1=discrete]ORTHOGONAL INT 0 [0=nonorthogonal, 1=orthogonal]SYMMETRIC INT 1 [0=asymmetric, 1=symm.]SUPPORT DOUBLE Infinity [Compact support width]MOMENTS INT 1 [Number of vanishing moments]REGULARITY DOUBLE Infinity [Number of continuousderivatives]E_FOLDING DOUBLE 1/sqrt(2) [Autocorrelation e-fold distance]FOURIER_PERIOD DOUBLE Ratio of Fourier wavelength to scaleTable 4-11: Structure Tags for ResultWV_FN_PAUL<strong>IDL</strong> <strong>Wavelet</strong> <strong>Toolkit</strong>
Chapter 4: <strong>IDL</strong> <strong>Wavelet</strong> <strong>Toolkit</strong> Reference 91ArgumentsOrderA scalar that specifies the non-dimensional order for the wavelet. The default is 4.ScaleNA scalar that specifies the scale at which to construct the wavelet function.An integer that specifies the number of points in the wavelet function. For Fourierspace (SPATIAL=0), the frequencies are constructed following the FFT convention:• For N even: 0, 1/N, 2/N, ..., (N–2)/(2N), 1/2, –(N–2)/(2N), ..., –1/N.• For N odd: 0, 1/N, 2/N, ..., (N–1)/(2N), –(N–1)/(2N), ..., –1/N.For real space (/SPATIAL), the spatial coordinates are –(N–1)/2...(N–1)/2.NoteIf none of the above arguments are present then the function will simply return theResult structure using the default Order.KeywordsDOUBLESet this keyword to force the computation to be done in double-precision arithmetic.FREQUENCYSet this keyword to a named variable in which to return the frequency array used toconstruct the wavelet. This variable will be undefined if SPATIAL is set.SPATIALSet this keyword to return the wavelet function in real space. The default is to returnthe wavelet function in Fourier space.WAVELETSet this keyword to a named variable in which to return the wavelet function.<strong>IDL</strong> <strong>Wavelet</strong> <strong>Toolkit</strong>WV_FN_PAUL
92 Chapter 4: <strong>IDL</strong> <strong>Wavelet</strong> <strong>Toolkit</strong> ReferenceReferenceTorrence and Compo, 1998: A Practical <strong>Guide</strong> to <strong>Wavelet</strong> Analysis. Bull. Amer.Meteor. Soc., 79, 61–78.ExamplesPlot the Paul wavelet function at scale=100:n = 1000 ; pick a nice number of pointsinfo = WV_FN_PAUL( 6, 100, n, /SPATIAL, $WAVELET=wavelet)plot, float(wavelet), THICK=2oplot, imaginary(wavelet)Now plot the same wavelet in Fourier space:info = WV_FN_PAUL( 6, 100, n, $FREQUENCY=frequency, WAVELET=wave_fourier)plot, frequency, wave_fourier, $xrange=[-0.2,0.2], thick=2Version History5.4 IntroducedSee AlsoWV_CWT, WV_FN_GAUSSIAN, WV_FN_MORLETWV_FN_PAUL<strong>IDL</strong> <strong>Wavelet</strong> <strong>Toolkit</strong>
Chapter 4: <strong>IDL</strong> <strong>Wavelet</strong> <strong>Toolkit</strong> Reference 93WV_FN_SYMLETThe WV_FN_SYMLET function constructs wavelet coefficients for the Symletwavelet function.NoteThe Symlet wavelet for orders 1–3 are the same as the Daubechies wavelets of thesame order.SyntaxResult = WV_FN_SYMLET( [Order, Scaling, <strong>Wavelet</strong>, Ioff, Joff] )Return ValueThe returned value of this function is an anonymous structure of information aboutthe particular wavelet.Tag Type DefinitionFAMILY STRING ‘Symlet’ORDER_NAME STRING ‘Order’ORDER_RANGE INTARR(3) [1, 15, 4] Valid order range [first, last, default]ORDER INT The chosen OrderDISCRETE INT 1 [0=continuous, 1=discrete]ORTHOGONAL INT 1 [0=nonorthogonal, 1=orthogonal]SYMMETRIC INT 2 [0=asymmetric, 1=symm., 2=near symm.]SUPPORT INT 2*Order – 1 [Compact support width]MOMENTS INT Order [Number of vanishing moments]REGULARITY DOUBLE The number of continuous derivativesTable 4-12: Structure Tags for Result<strong>IDL</strong> <strong>Wavelet</strong> <strong>Toolkit</strong>WV_FN_SYMLET
94 Chapter 4: <strong>IDL</strong> <strong>Wavelet</strong> <strong>Toolkit</strong> ReferenceArgumentsOrderA scalar that specifies the order number for the wavelet. The default is 4.ScalingOn output, contains a vector of double-precision scaling (father) coefficients.<strong>Wavelet</strong>IoffJoffOn output, contains a vector of double-precision wavelet (mother) coefficients.On output, contains an integer that specifies the support offset for Scaling.On output, contains an integer that specifies the support offset for <strong>Wavelet</strong>.NoteIf none of the above arguments are present then the function will simply return theResult structure using the default Order.KeywordsNone.ReferenceCoefficients for orders 1–10 are from Daubechies, I., 1992: Ten Lectures on<strong>Wavelet</strong>s, SIAM, p. 198. Note that Daubechies has multiplied by Sqrt(2), and forsome orders the coefficients are reversed. Coefficients for orders 11–15 are fromhttp://www.isds.duke.edu/~brani/filters.html.Version History5.3 IntroducedWV_FN_SYMLET<strong>IDL</strong> <strong>Wavelet</strong> <strong>Toolkit</strong>
Chapter 4: <strong>IDL</strong> <strong>Wavelet</strong> <strong>Toolkit</strong> Reference 95See AlsoWV_DWT, WV_FN_COIFLET, WV_FN_DAUBECHIES, WV_FN_HAAR<strong>IDL</strong> <strong>Wavelet</strong> <strong>Toolkit</strong>WV_FN_SYMLET
96 Chapter 4: <strong>IDL</strong> <strong>Wavelet</strong> <strong>Toolkit</strong> ReferenceWV_IMPORT_DATASyntaxThe WV_IMPORT_DATA procedure allows the user to add a variable to thecurrently active WV_APPLET widget from the <strong>IDL</strong>> command prompt.WV_IMPORT_DATA, Data [, MESSAGE_OUT=string] [, PARENT=variable]ArgumentsDataA one- or two-dimensional array of data, or a structure containing the data.KeywordsMESSAGE_OUTA scalar string giving a message to be output to the WV_APPLET message bar.PARENTA long integer specifying the ID of the WV_APPLET widget in which to import thedata. The default is the most-recently active WV_APPLET widget.ExamplesTo import a 1D or 2D array directly into the active WV_APPLET widget:WV_IMPORT_DATA, ArrayTo import a data structure:WV_IMPORT_DATA, {DATA: PTR_NEW(Array), $SOURCE: ’Chandra X-Ray Observatory’, $TITLE: ’Cygnus X-1 X-Ray Image’, $VARIABLE: ’Cygnus X-1’, $UNITS: ’Intensity’}WV_IMPORT_DATA<strong>IDL</strong> <strong>Wavelet</strong> <strong>Toolkit</strong>
Chapter 4: <strong>IDL</strong> <strong>Wavelet</strong> <strong>Toolkit</strong> Reference 97If Data is a structure then it must include at the very least a DATA tag containing apointer to a one- or two-dimensional array. Recognized tags are shown in thefollowing table. Tags other than these will be quietly ignored.Tag Type DefinitionDATA PTR->Array Pointer to data arrayTITLE STRING Long name of data variableVARIABLE STRING Short name of data variableUNITS STRING Units for variableXNAME STRING Name of X coordinateXUNITS STRING Units for X coordinateXSTART STRING Starting value for X coordDX STRING Sampling rate for X coordYNAME STRING Name of Y coordinateYUNITS STRING Units for Y coordinateYSTART STRING Starting value for Y coordDY STRING Sampling rate for Y coordXOFFSET LONG Starting index of X coord to useXCOUNT LONG Number of X coords to useXSTRIDE LONG X sampling interval to useYOFFSET LONG Starting index of Y coord to useYCOUNT LONG Number of Y coords to useYSTRIDE LONG Y sampling interval to useSOURCE STRING Filename or contact infoNOTES STRING Miscellaneous notesCOLORS PTR->Bytarr(3,256) Pointer to color table for DataTable 4-13: Tags Recognized by WV_IMPORT_DATA<strong>IDL</strong> <strong>Wavelet</strong> <strong>Toolkit</strong>WV_IMPORT_DATA
98 Chapter 4: <strong>IDL</strong> <strong>Wavelet</strong> <strong>Toolkit</strong> ReferenceVersion History5.3 IntroducedSee AlsoWV_APPLETWV_IMPORT_DATA<strong>IDL</strong> <strong>Wavelet</strong> <strong>Toolkit</strong>
Chapter 4: <strong>IDL</strong> <strong>Wavelet</strong> <strong>Toolkit</strong> Reference 99WV_IMPORT_WAVELETThe WV_IMPORT_WAVELET procedure allows the user to add wavelet functionsto the currently-active <strong>IDL</strong> <strong>Wavelet</strong> <strong>Toolkit</strong>(s).NoteAny widgets that are currently active will not have access to the new waveletfunctions until they are restarted.SyntaxWV_IMPORT_WAVELET [, <strong>Wavelet</strong>] [, /RESET]Arguments<strong>Wavelet</strong>A string scalar or vector giving the names of the wavelet functions. The actualfunction names are constructed by removing all white space from each name andattaching a prefix of WV_FN_.KeywordsRESETIf set, then remove all user-defined wavelets from memory. If <strong>Wavelet</strong> is alsospecified then the new wavelets will be appended onto the built-in wavelets.Version History5.3 IntroducedSee AlsoWV_APPLET, WV_CW_WAVELET<strong>IDL</strong> <strong>Wavelet</strong> <strong>Toolkit</strong>WV_IMPORT_WAVELET
100 Chapter 4: <strong>IDL</strong> <strong>Wavelet</strong> <strong>Toolkit</strong> ReferenceWV_PLOT3D_WPSSyntaxThe WV_PLOT3D_WPS function runs the graphical user interface for threedimensionalvisualization of the wavelet power spectrum. WV_PLOT3D_WPS isaccessible from the Visualize Menu of WV_APPLET.Result = WV_PLOT3D_WPS( Array [, X] [, Y] [, GROUP_LEADER=widget_id][, SURFACE_STYLE=value] [, TITLE=string] [, UNITS=string][, XTITLE=string] [, XUNITS=string] [, YTITLE=string] [, YUNITS=string] )Return ValueThe returned variable is the Widget ID of the newly-created widget.ArgumentsInputXYInput must be either a string giving the name of a file to open, or a one- or twodimensionalarray of data. If set to a string, the file must contain a validWV_PLOT3D_WPS “saved state.”An optional vector of uniformly-spaced values giving the location of points along thefirst dimension of Input. The default is 0, 1, 2,..., N X –1, where N X is the size of thefirst dimension. This argument is ignored if Input is a filename.An optional vector of uniformly-spaced values giving the location of points along thesecond dimension of Input. The default is 0, 1, 2,..., N Y –1, where N Y is the size of thesecond dimension. This argument is ignored if Input is a filename.WV_PLOT3D_WPS<strong>IDL</strong> <strong>Wavelet</strong> <strong>Toolkit</strong>
Chapter 4: <strong>IDL</strong> <strong>Wavelet</strong> <strong>Toolkit</strong> Reference 101KeywordsGROUP_LEADERThe widget ID of an existing widget that serves as "group leader" for the newlycreatedwidget. When a group leader is killed, for any reason, all widgets in the groupare also destroyed.A given widget can be in more than one group. The WIDGET_CONTROL procedurecan be used to add additional group associations to a widget. See“WIDGET_CONTROL” (<strong>IDL</strong> Reference <strong>Guide</strong>) for more information. It is notpossible to remove a widget from an existing group.NoteThe following keywords are ignored if Input is a filename. This includes theSURFACE_STYLE, TITLE, UNITS, XTITLE, XUNITS, YTITLE, and YUNITSkeywords.SURFACE_STYLESet this keyword to an integer specifying the initial style to use for the threedimensionalsurface. Valid values are:• 0 = Off• 1 = Points• 2 = Mesh• 3 = Shaded• 4 = XZ lines• 5 = YZ lines• 6 = Lego• 7 = Lego fillTITLEA scalar string giving the label to be used for the widget. The default is ‘WPS:’.UNITSA scalar string giving the units of Array.<strong>IDL</strong> <strong>Wavelet</strong> <strong>Toolkit</strong>WV_PLOT3D_WPS
102 Chapter 4: <strong>IDL</strong> <strong>Wavelet</strong> <strong>Toolkit</strong> ReferenceXTITLEA scalar string giving the label to be used for the first dimension.XUNITSA scalar string giving the units of X.YTITLEA scalar string giving the label to be used for the y-axis (for a 1D vector) or for thesecond dimension (for a 2D array).YUNITSA scalar string giving the units of Array (for a 1D vector) or the units of Y (for a 2Darray).Widget Keywords AcceptedThe WV_PLOT3D_WPS function also accepts the following WIDGET_BASEkeywords: DISPLAY_NAME, EVENT_FUNC, FRAME,KBRD_FOCUS_EVENTS, KILL_NOTIFY, MODAL, NOTIFY_REALIZE,RESOURCE_NAME, SCR_XSIZE, SCR_YSIZE, SPACE, TLB_FRAME_ATTR,TRACKING_EVENTS, UNITS, XOFFSET, XSIZE, YOFFSET, YSIZE. See“WIDGET_BASE” (<strong>IDL</strong> Reference <strong>Guide</strong>) for more information.Version History5.3 IntroducedSee AlsoWV_APPLETWV_PLOT3D_WPS<strong>IDL</strong> <strong>Wavelet</strong> <strong>Toolkit</strong>
Chapter 4: <strong>IDL</strong> <strong>Wavelet</strong> <strong>Toolkit</strong> Reference 103WV_PLOT_MULTIRESSyntaxThe WV_PLOT_MULTIRES function runs the graphical user interface formultiresolution analysis. WV_PLOT_MULTIRES is accessible from the VisualizeMenu of WV_APPLET.Result = WV_PLOT_MULTIRES( Array [, X] [, Y] [, GROUP_LEADER=widget_id][, TITLE=string] [, UNITS=string] [, XTITLE=string] [, XUNITS=string][, YTITLE=string] [, YUNITS=string])Return ValueThe returned variable is the Widget ID of the newly-created widget.ArgumentsArrayXA one- or two-dimensional array of data to be analyzed.YAn optional vector of uniformly-spaced values giving the location of points along thefirst dimension of Array. The default is 0, 1, 2,..., N X –1, where N X is the size of thefirst dimension.An optional vector of uniformly-spaced values giving the location of points along thesecond dimension of Array. The default is 0, 1, 2,..., N Y –1, where N Y is the size ofthe second dimension.KeywordsGROUP_LEADERThe widget ID of an existing widget that serves as “group leader” for the newlycreatedwidget. When a group leader is killed, for any reason, all widgets in the groupare also destroyed.<strong>IDL</strong> <strong>Wavelet</strong> <strong>Toolkit</strong>WV_PLOT_MULTIRES
104 Chapter 4: <strong>IDL</strong> <strong>Wavelet</strong> <strong>Toolkit</strong> ReferenceA given widget can be in more than one group. The WIDGET_CONTROL procedurecan be used to add additional group associations to a widget. See“WIDGET_CONTROL” (<strong>IDL</strong> Reference <strong>Guide</strong>) for more information. It is notpossible to remove a widget from an existing group.TITLEA scalar string giving the label to be used for the widget. The default is ‘MRes:’.UNITSA scalar string giving the units of Array.XTITLEA scalar string giving the label to be used for the first dimension.XUNITSA scalar string giving the units of X.YTITLEA scalar string giving the label to be used for the y-axis (for a 1D vector) or for thesecond dimension (for a 2D array).YUNITSA scalar string giving the units of Array (for a 1D vector) or the units of Y (for a 2Darray).Widget Keywords AcceptedThe WV_PLOT_MULTIRES function also accepts the following WIDGET_BASEkeywords: DISPLAY_NAME, EVENT_FUNC, FRAME,KBRD_FOCUS_EVENTS, KILL_NOTIFY, MODAL, NOTIFY_REALIZE,RESOURCE_NAME, SCR_XSIZE, SCR_YSIZE, SPACE, TLB_FRAME_ATTR,TRACKING_EVENTS, UNITS, XOFFSET, XSIZE, YOFFSET, YSIZE. See“WIDGET_BASE” (<strong>IDL</strong> Reference <strong>Guide</strong>) for more information.Version History5.3 IntroducedWV_PLOT_MULTIRES<strong>IDL</strong> <strong>Wavelet</strong> <strong>Toolkit</strong>
Chapter 4: <strong>IDL</strong> <strong>Wavelet</strong> <strong>Toolkit</strong> Reference 105See AlsoWV_APPLET<strong>IDL</strong> <strong>Wavelet</strong> <strong>Toolkit</strong>WV_PLOT_MULTIRES
106 Chapter 4: <strong>IDL</strong> <strong>Wavelet</strong> <strong>Toolkit</strong> ReferenceWV_PWTThe WV_PWT function returns the partial wavelet transform of the input vector A.The transform is done using a user-inputted wavelet filter. WV_PWT is called byWV_DWT.WV_PWT is based on the routine pwt described in section 13.10 of NumericalRecipes in C: The Art of Scientific Computing, 2nd ed. (Cambridge University Press),and is used by permission.SyntaxResult = WV_PWT( A, Scaling, <strong>Wavelet</strong>, Ioff, Joff [, /DOUBLE] [, /INVERSE] )Return ValueThe result is an output vector of the same length as A, containing one stage of thepyramidal algorithm (Mallat 1989).ArgumentsAThe input vector. The length must be either less than four (4) or a power of two (2).ScalingA vector of scaling (father) coefficients, of length N.<strong>Wavelet</strong>IoffJoffA vector of wavelet (mother) coefficients, of length N.An integer that specifies the support offset for Scaling. To center the scaling functionover each point in Array, set Ioff to –N/2+2.An integer that specifies the support offset for <strong>Wavelet</strong>. To center the waveletfunction over each point in Array, set Joff to –N/2+2.WV_PWT<strong>IDL</strong> <strong>Wavelet</strong> <strong>Toolkit</strong>
Chapter 4: <strong>IDL</strong> <strong>Wavelet</strong> <strong>Toolkit</strong> Reference 107KeywordsDOUBLESet this keyword to force the computation to be done in double-precision arithmetic.INVERSEIf set, the inverse transform is computed. By default, the forward transform iscomputed.Method and Result FormatThe WV_PWT function computes the wavelet coefficients for one level of thepyramidal algorithm. For a one-dimensional vector with 16 elements, one level of thepyramid appears below:Array elements[ 0, 1, 2, 3, 4, 5, 6, 7, 8, 9, 10, 11, 12, 13, 14, 15]\ / \ / \ / \ / \ / \ / \ / \ /s0,d0 s1,d1 s2,d2 s3,d3 s4,d4 s5,d5 s6,d6 s7,d7where Si and Di are the scaling and wavelet coefficients and i represents theposition. The wavelet coefficients are stored in Result in the following order:Result = [ s0, s1, s2, s3, s4, s5, s6, s7,d0, d1, d2, d3, d4, d5, d6, d7 ]Version History5.3 IntroducedSee AlsoWV_DWT<strong>IDL</strong> <strong>Wavelet</strong> <strong>Toolkit</strong>WV_PWT
108 Chapter 4: <strong>IDL</strong> <strong>Wavelet</strong> <strong>Toolkit</strong> ReferenceWV_TOOL_DENOISESyntaxThe WV_TOOL_DENOISE function runs the graphical user interface for waveletfiltering and denoising. WV_TOOL_DENOISE is accessible from the Tools Menu ofWV_APPLET.Result = WV_TOOL_DENOISE( Array [, X] [, Y] [, GROUP_LEADER=widget_id][, TITLE=string] [, UNITS=string] [, XTITLE=string] [, XUNITS=string][, YTITLE=string] [, YUNITS=string])Return ValueThe returned variable is the Widget ID of the newly-created widget.ArgumentsArrayXA one- or two-dimensional array of data to be analyzed.YAn optional vector of uniformly-spaced values giving the location of points along thefirst dimension of Array. The default is 0, 1, 2,..., N X –1, where N X is the size of thefirst dimension.An optional vector of uniformly-spaced values giving the location of points along thesecond dimension of Array. The default is 0, 1, 2,..., N Y –1, where N Y is the size ofthe second dimension.KeywordsGROUP_LEADERThe widget ID of an existing widget that serves as "group leader" for the newlycreatedwidget. When a group leader is killed, for any reason, all widgets in the groupare also destroyed.WV_TOOL_DENOISE<strong>IDL</strong> <strong>Wavelet</strong> <strong>Toolkit</strong>
Chapter 4: <strong>IDL</strong> <strong>Wavelet</strong> <strong>Toolkit</strong> Reference 109A given widget can be in more than one group. The WIDGET_CONTROL procedurecan be used to add additional group associations to a widget. See“WIDGET_CONTROL” (<strong>IDL</strong> Reference <strong>Guide</strong>) for more information. It is notpossible to remove a widget from an existing group.TITLEA scalar string giving the label to be used for the widget. The default is 'Denoise:'.UNITSA scalar string giving the units of Array.XTITLEA scalar string giving the label to be used for the first dimension.XUNITSA scalar string giving the units of X.YTITLEA scalar string giving the label to be used for the y-axis (for a 1D vector) or for thesecond dimension (for a 2D array).YUNITSA scalar string giving the units of Array (for a 1D vector) or the units of Y (for a 2Darray).Widget Keywords AcceptedThe WV_TOOL_DENOISE function also accepts the following WIDGET_BASEkeywords: DISPLAY_NAME, EVENT_FUNC, FRAME,KBRD_FOCUS_EVENTS, KILL_NOTIFY, MODAL, NOTIFY_REALIZE,RESOURCE_NAME, SCR_XSIZE, SCR_YSIZE, SPACE, TLB_FRAME_ATTR,TRACKING_EVENTS, UNITS, XOFFSET, XSIZE, YOFFSET, YSIZE. See“WIDGET_BASE” (<strong>IDL</strong> Reference <strong>Guide</strong>) for more information.Version History5.3 Introduced<strong>IDL</strong> <strong>Wavelet</strong> <strong>Toolkit</strong>WV_TOOL_DENOISE
110 Chapter 4: <strong>IDL</strong> <strong>Wavelet</strong> <strong>Toolkit</strong> ReferenceSee AlsoWV_APPLET, WV_DENOISEWV_TOOL_DENOISE<strong>IDL</strong> <strong>Wavelet</strong> <strong>Toolkit</strong>
IndexAadding<strong>Wavelet</strong> <strong>Toolkit</strong> tools, 45Bbandpassmultiresolution plots, 39Ccascade plot. See multiresolution analysiscoefficient power plot, 43coiflet. See wavelet functionscompact support, 29compress save files. See preferencesconfirm exit. See preferencescontinuous wavelet transform, 29, 48, 66contours in wavelet power spectrum, 37copyrights, 2cumulative power plot, 43Ddatasetsmathematical expressions, 23selecting variables, 24variable information fields, 20Daubechies. See wavelet functionsdefault directory. See preferencesdenoising techniquescoefficient power plot, 43coefficient threshold, 43<strong>IDL</strong> <strong>Wavelet</strong> <strong>Toolkit</strong> 111
112color scaling, 42cumulative power threshold, 43denoise tool, 41hard thresholding, 43, 51MRI, 52soft thresholding, 44, 52theory, 51wavelet coefficient method, 42WV_DENOISE function, 69WV_TOOL_DENOISE function, 108detail multiresolution plots, 39DIALOG_READ_IMAGE. See importingdiscrete wavelet transform, 29, 48, 74drag quality, 34Ee-folding time, 30energy scaling, 35export restrictions, 2GGaussianSee also wavelet functions.HHaar. See wavelet functionshigh-pass multiresolution plots, 39I<strong>IDL</strong> <strong>Wavelet</strong> <strong>Toolkit</strong>main window, 12menus, 14status bar, 12toolbar, 12image compression. See denoising techniquesimagesin wavelet toolkit, 26importingadding wavelet functions, 99data from command line, 96<strong>IDL</strong> command line data, 26structure tags, 97user-defined wavelet functions, 30WAV audio files, 26Llegalities, 2lego-style surface, 36localization of wavelet functions, 48low-pass multiresolution plots, 39MMacintoshusing mouse with wavelet toolkit, 37Mallat. See pyramidal algorithmMarr wavelet See WV_FN_GAUSSIAN functionmathematical expressions. See datasetsMorlet. See wavelet functionsMRI denoising technique, 52multiresolution analysis, 103about, 54using, 39Nnoise removalSee also denoising techniquesnonorthogonal wavelet functions, 29Index<strong>IDL</strong> <strong>Wavelet</strong> <strong>Toolkit</strong>
113Oorthogonal wavelet functions, 29Pparameterspassing to <strong>Wavelet</strong> <strong>Toolkit</strong> functions, 45partial wavelet transform. See wavelet transformpassing parameters, 45Paul. See wavelet functionsPCM format, 26percent difference, 44plottingmultiresolution analysis, 39, 103wavelet power spectrum, 32, 100preferencescompress save files, 18confirm exit, 18current directory selection, 18default directory, 18restoring defaults, 19stride factor, 18pyramidal algorithmresult format, 75returning, 106Rregularity of wavelet functions, 30remember current directory. See preferencesRMS difference, 44root-mean-square difference, 44rough multiresolution plots, 39Sscalingfunctions, 28startingwavelet toolkit, 12statistical significance testing, 48stride factor. See preferencesstructure tagsimporting wavelet data, 97surfacesstyle, 36symlet. See wavelet functionssymmetry of wavelet functions, 29Ttoolkit structure, 9toolsadding, 45denoise function, 108denoise tool, 41user-defined, 16, 45trademarks, 2TrueColor (24-bit) images, 26Uuser-defined tools, 45Vvanishing moments, 30variable informationwavelet dataset viewer, 20variable selection. See datasetsviewingwavelet functions, 28WWAV audio files, 26wavelet commands<strong>IDL</strong> <strong>Wavelet</strong> <strong>Toolkit</strong>Index
114functions, 59transform, 58widgets, 58wavelet functionscoiflet, 78compact support, 29Daubechies, 80family, 64Gaussian, 82Haar, 85Morlet, 87nonorthogonal, 29order, 64orthogonal, 29Paul, 90regularity, 30symlet, 93symmetry, 29user-defined, 30, 99vanishing moments, 30viewing, 28wavelet power spectrumSee also WV_PLOT3D_WPS functionenergy scaling, 35plotting method, 49rotation, translation, stretching, 37theory, 49viewer, 32zero phase lines, 35wavelet toolkitimporting data, 25status bar, 12wavelet transformcontinuous, 29, 48, 66discrete, 29, 48, 74partial, 106wavelet widget commands, 58WV_APPLET procedure, 60WV_CW_WAVELET functionGET_VALUE, 64reference, 62SET_VALUE, 64widget events generated, 64WV_CWT function, 66WV_DENOISE function, 69WV_DWT function, 74WV_FN_COIFLET function, 78WV_FN_DAUBECHIES function, 80WV_FN_GAUSSIAN function, 82WV_FN_HAAR function, 85WV_FN_MORLET function, 87WV_FN_PAUL function, 90WV_FN_SYMLET function, 93WV_IMPORT_DATA procedure, 96WV_IMPORT_WAVELET procedure, 99WV_PLOT_MULTIRES function, 103WV_PLOT3D_WPS function, 100WV_PWT function, 106WV_TOOL_DENOISE function, 108Zzero phase lines, 35Index<strong>IDL</strong> <strong>Wavelet</strong> <strong>Toolkit</strong>