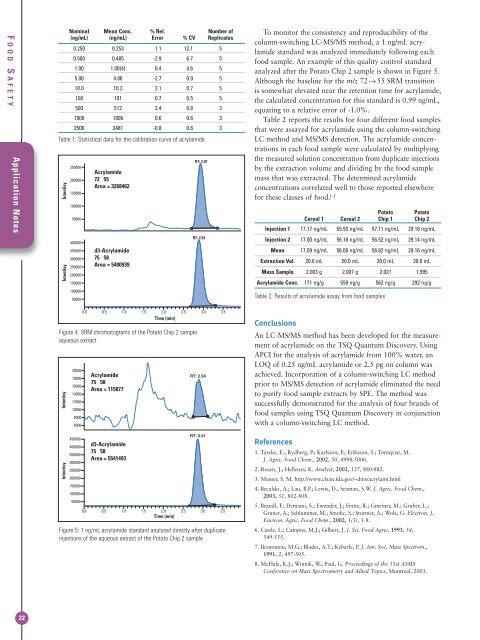
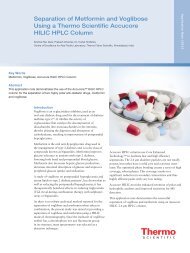
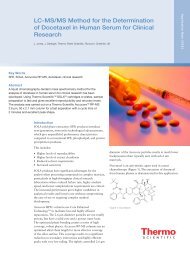
F OOD S AFETYApplication NotesNominal Mean Conc. % Rel. Number of(ng/mL) (ng/mL) Error % CV Replicates0.250 0.253 1.1 12.1 50.500 0.485 -2.9 6.7 51.00 1.00(4) 0.4 4.6 55.00 4.86 -2.7 0.9 510.0 10.2 2.1 0.7 5100 101 0.7 0.5 5500 512 2.4 0.8 31000 1006 0.6 0.6 32500 2481 -0.8 0.6 3Table 1: Statistical data for the calibration curve of acrylamideTo monitor the consistency and reproducibility of thecolumn-switching LC-MS/MS method, a 1 ng/mL acrylamidestandard was analyzed immediately following eachfood sample. An example of this quality control standardanalyzed after the Potato Chip 2 sample is shown in Figure 5.Although the baseline for the m/z 72 → 55 SRM transitionis somewhat elevated near the retention time for acrylamide,the calculated concentration for this standard is 0.99 ng/mL,equating to a relative error of -1.0%.Table 2 reports the results for four different food samplesthat were assayed for acrylamide using the column-switchingLC method and MS/MS detection. The acrylamide concentrationsin each food sample were calculated by multiplyingthe measured solution concentration from duplicate injectionsby the extraction volume and dividing by the food samplemass that was extracted. The determined acrylamideconcentrations correlated well to those reported elsewherefor these classes of food. 1-5Potato PotatoCereal 1 Cereal 2 Chip 1 Chip 2Injection 1 17.17 ng/mL 55.93 ng/mL 57.11 ng/mL 29.18 ng/mLInjection 2 17.00 ng/mL 56.18 ng/mL 56.52 ng/mL 29.14 ng/mLMean 17.09 ng/mL 56.06 ng/mL 56.82 ng/mL 29.16 ng/mLExtraction Vol. 20.0 mL 20.0 mL 20.0 mL 20.0 mLMass Sample 2.003 g 2.007 g 2.021 1.995Acrylamide Conc. 171 ng/g 559 ng/g 562 ng/g 292 ng/gTable 2: Results of acrylamide assay from food samplesFigure 4: SRM chromatograms of the Potato Chip 2 sampleaqueous extractFigure 5: 1 ng/mL acrylamide standard analyzed directly after duplicateinjections of the aqueous extract of the Potato Chip 2 sampleConclusionsAn LC-MS/MS method has been developed for the measurementof acrylamide on the TSQ Quantum Discovery. UsingAPCI for the analysis of acrylamide from 100% water, anLOQ of 0.25 ng/mL acrylamide or 2.5 pg on column wasachieved. Incorpo ration of a column-switching LC methodprior to MS/MS detection of acrylamide eliminated the needto purify food sample extracts by SPE. The method wassuccessfully demonstrated for the analysis of four brands offood samples using TSQ Quantum Discovery in conjunctionwith a column-switching LC method.References1. Tareke, E.; Rydberg, P.; Karlsson, P.; Eriksson, S.; Tornqvist, M.J. Agric. Food Chem., 2002, 50, 4998-5006.2. Rosen, J.; Hellenas, K. Analyst, 2002, 127, 880-882.3. Musser, S. M. http://www.cfsan.fda.gov/~dms/acrylami.html4. Becalski, A.; Lau, B.P.; Lewis, D., Seaman, S.W. J. Agric. Food Chem.,2003, 51, 802-808.5. Brandl, F.; Demiani, S.; Ewender, J.; Franz, R.; Gmeiner, M.; Gruber, L.;Gruner, A.; Schlummer, M.; Smolic, S.; Stormer, A.; Wolz, G. Electron. J.Environ. Agric. Food Chem., 2002, 1(3), 1-8.6. Castle, L.; Campos, M.J.; Gilbert, J. J. Sci. Food Agric. 1993, 54,549-555.7. Ikonomou, M.G.; Blades, A.T.; Kebarle, P. J. Am. Soc. Mass Spectrom.,1991, 2, 497-505.8. McHale, K.J.; Winnik, W.; Paul, G. Proceedings of the 51st ASMSConference on Mass Spectrometry and Allied Topics, Montreal, 2003.22
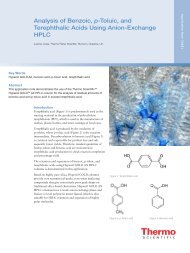
Fast LC Separation of Triazine Herbicides atElevated TemperatureDave Thomas, <strong>Thermo</strong> Fisher <strong>Scientific</strong>, San Jose, CA USAIntroductionTemperature is a key variable in high performance liquidchromatography (HPLC), influencing solute diffusion rates,mobile phase viscosity, and solubility. For example, ascolumn temperature increases, analyte diffusion increases.Increased analyte diffusion generally leads to an increasein the optimum linear velocity of the separation, so thatequivalent chromatographic efficiency and resolution canbe achieved at a higher flow rate. Furthermore, elevatingthe temperature reduces the operating backpressure. The netresult is that separations can be performed faster withoutexceeding the pressure limitations of the instrument.This application uses a porous graphitic carbon stationaryphase thermostatted in a high temperature column oven toseparate triazine herbicides 5 to 10 times faster than is typicalwith conventional HPLC. The triazines and degradationproducts are separated on the <strong>Thermo</strong> <strong>Scientific</strong> AccelaHigh Speed Liquid Chromatograph in 2 minutes on a<strong>Hypercarb</strong> 3 µm, 1 x 100 mm column operated at 160 °C.This application note also documents the performance of thehigh temperature liquid chromatographic method, includingprecision of retention time and peak area, resolution, andspike recovery from several environmental water matrices.GoalIncrease throughput of the HPLC method for triazine herbicidesby employing ultra high-speed liquid chromatographyat elevated temperature on a heat stable <strong>Hypercarb</strong> column.ExperimentalInstrumentation<strong>Thermo</strong> <strong>Scientific</strong> Accela HPLC system with PDA Detector<strong>Thermo</strong> <strong>Scientific</strong> ChromQuest 5.0 Chromatography Data System (CDS)Polaratherm Series 9000 Total Temperature Controller (Selerity Technologies)ChemicalsWater, LC/MS-gradeFisher <strong>Scientific</strong> W6Acetonitrile, LC/MS-grade Fisher <strong>Scientific</strong> A998Methanol, LC/MS-grade Fisher <strong>Scientific</strong> A456Atrazine Supelco 49085AmetrynULTRA PST-024CyanazineULTRA PST-1360Deisopropylatrazine, 1000 mg/L SPEX CertiPrep S-1135Desethylatrazine, 1000 mg/L SPEX CertiPrep S-1145Propanil, 1000 mg/L SPEX CertiPrep S-3155PropazineULTRA PST-850PrometrynULTRA PST-840SimazineULTRA PST-1130SimetrynChem Service PS-381ConsumablesAutosampler vials, 1.8 mL glass, <strong>Thermo</strong> <strong>Scientific</strong>yellow septa A4954-010Backpressure assembly Upchurch P-788Ferrules, high temperatureSelerity Technologies BM0054Mixer, 50 µL in-line static <strong>Thermo</strong> <strong>Scientific</strong> 109-99-032Mobile Phase Preheater,Selerity Technologies AD1040.005" x 70 cmSyringe filters, 0.45 µm Nylon <strong>Thermo</strong> <strong>Scientific</strong> A5307-010Sample Loop, 5 µL <strong>Thermo</strong> <strong>Scientific</strong> 109-99-007E NVIRONMENTALApplication NotesChromatographic ConditionsColumn:<strong>Thermo</strong> <strong>Scientific</strong> <strong>Hypercarb</strong> 3.0 µm, 1 x 100 mm(part number 35003-101046)Mobile phase: A: water B: acetonitrileGradient: Time %A %B0.00 75 251.00 70 302.20 10 902.30 75 254.00 75 25Flow rate: 500 µL/minDetector: PDA, 238 nm, 10-mm flow cell, 11 nm bw, 20 Hz,0s rise timeColumn temp.: 160 °C (housed in Selerity temperature controller)Injection: 5 µL sample loop, 2 µL partial loop injectionSyringe Speed: 4 µL/secFlush Speed: 100 µL/secFlush Volume: 400 µLWash Volume: 200 µLFlush/Wash source: Bottle with 90:10 methanol:waterMobile PhaseProportioned mobile phase: Filled Solvent Reservoir BottleA of the Accela pump with fresh HPLC-grade water andpurged the solvent line with at least 30 mL of the water.Connected a fresh bottle of HPLC-grade acetonitrile toReservoir B and purged as above.Calibration StandardsIndividual Stock Solutions, 1000 mg/L: Accurately weighed10 mg (0.010 g) of each neat compound into a 10-mLvolumetric flask, added 5 mL acetonitrile, and sonicatedto dissolve. Brought to volume with acetonitrile and mix.Used desethyl atrazine, deisopropyl atrazine and propanil,purchased as solutions of 1000 mg/L in methanol, as received.Combined Intermediate Standard 100 mg/L: Used a calibratedpipette to deliver 1000 µL of each individual stock solutionto a 10-mL volumetric flask. Brought to volume withacetonitrile and mix.Calibration Standards: Used a calibrated pipette to dilutethe intermediate standard with mobile phase in volumetricglassware to 30, 10, 3, 1, 0.3, 0.1, and 0.03 mg/L.23