Thermo Scientific Hypercarb Columns
Thermo Scientific Hypercarb Columns
Thermo Scientific Hypercarb Columns

You also want an ePaper? Increase the reach of your titles
YUMPU automatically turns print PDFs into web optimized ePapers that Google loves.
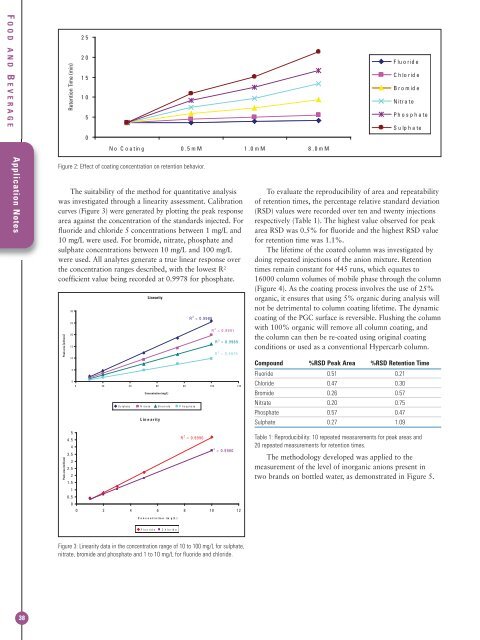
F OOD AND B EVERAGEApplication NotesFigure 2: Effect of coating concentration on retention behavior.The suitability of the method for quantitative analysiswas investigated through a linearity assessment. Calibrationcurves (Figure 3) were generated by plotting the peak responsearea against the concentration of the standards injected. Forfluoride and chloride 5 concentrations between 1 mg/L and10 mg/L were used. For bromide, nitrate, phosphate andsulphate concentrations between 10 mg/L and 100 mg/Lwere used. All analytes generate a true linear response overthe concentration ranges described, with the lowest R 2coefficient value being recorded at 0.9978 for phosphate.To evaluate the reproducibility of area and repeatabilityof retention times, the percentage relative standard deviation(RSD) values were recorded over ten and twenty injectionsrespectively (Table 1). The highest value observed for peakarea RSD was 0.5% for fluoride and the highest RSD valuefor retention time was 1.1%.The lifetime of the coated column was investigated bydoing repeated injections of the anion mixture. Retentiontimes remain constant for 445 runs, which equates to16000 column volumes of mobile phase through the column(Figure 4). As the coating process involves the use of 25%organic, it ensures that using 5% organic during analysis willnot be detrimental to column coating lifetime. The dynamiccoating of the PGC surface is reversible. Flushing the columnwith 100% organic will remove all column coating, andthe column can then be re-coated using original coatingconditions or used as a conventional <strong>Hypercarb</strong> column.Compound %RSD Peak Area %RSD Retention TimeFluoride 0.51 0.21Chloride 0.47 0.30Bromide 0.26 0.57Nitrate 0.20 0.75Phosphate 0.57 0.47Sulphate 0.27 1.09Table 1: Reproducibility: 10 repeated measurements for peak areas and20 repeated measurements for retention times.The methodology developed was applied to themeasurement of the level of inorganic anions present intwo brands on bottled water, as demonstrated in Figure 5.Figure 3: Linearity data in the concentration range of 10 to 100 mg/L for sulphate,nitrate, bromide and phosphate and 1 to 10 mg/L for fluoride and chloride.38