Waste Indicators
Waste Indicators
Waste Indicators

You also want an ePaper? Increase the reach of your titles
YUMPU automatically turns print PDFs into web optimized ePapers that Google loves.
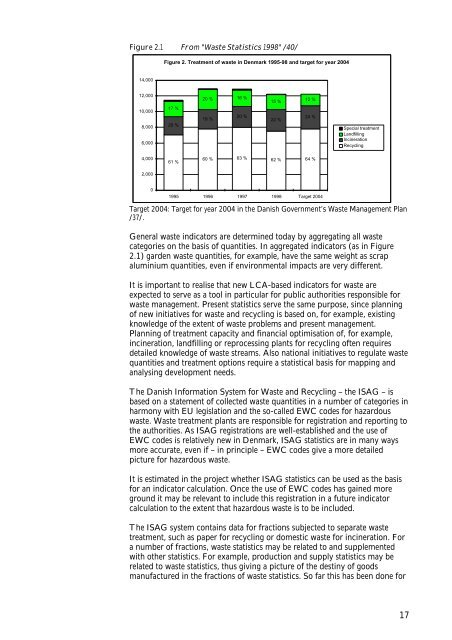
Figure 2.1 From "<strong>Waste</strong> Statistics 1998" /40/Figure 2. Treatment of waste in Denmark 1995-98 and target for year 200414,00012,00010,0008,0006,00017 %20 %20 %19 %16 %20 %15 %22 %12 %24 %Special treatmentLandfillingIncinerationRecycling4,00061 %60 %63 %62 %64 %2,00001995 1996 1997 1998 Target 2004Target 2004: Target for year 2004 in the Danish Government’s <strong>Waste</strong> Management Plan/37/.General waste indicators are determined today by aggregating all wastecategories on the basis of quantities. In aggregated indicators (as in Figure2.1) garden waste quantities, for example, have the same weight as scrapaluminium quantities, even if environmental impacts are very different.It is important to realise that new LCA-based indicators for waste areexpected to serve as a tool in particular for public authorities responsible forwaste management. Present statistics serve the same purpose, since planningof new initiatives for waste and recycling is based on, for example, existingknowledge of the extent of waste problems and present management.Planning of treatment capacity and financial optimisation of, for example,incineration, landfilling or reprocessing plants for recycling often requiresdetailed knowledge of waste streams. Also national initiatives to regulate wastequantities and treatment options require a statistical basis for mapping andanalysing development needs.The Danish Information System for <strong>Waste</strong> and Recycling – the ISAG – isbased on a statement of collected waste quantities in a number of categories inharmony with EU legislation and the so-called EWC codes for hazardouswaste. <strong>Waste</strong> treatment plants are responsible for registration and reporting tothe authorities. As ISAG registrations are well-established and the use ofEWC codes is relatively new in Denmark, ISAG statistics are in many waysmore accurate, even if – in principle – EWC codes give a more detailedpicture for hazardous waste.It is estimated in the project whether ISAG statistics can be used as the basisfor an indicator calculation. Once the use of EWC codes has gained moreground it may be relevant to include this registration in a future indicatorcalculation to the extent that hazardous waste is to be included.The ISAG system contains data for fractions subjected to separate wastetreatment, such as paper for recycling or domestic waste for incineration. Fora number of fractions, waste statistics may be related to and supplementedwith other statistics. For example, production and supply statistics may berelated to waste statistics, thus giving a picture of the destiny of goodsmanufactured in the fractions of waste statistics. So far this has been done for17