Waste Indicators
Waste Indicators
Waste Indicators

You also want an ePaper? Increase the reach of your titles
YUMPU automatically turns print PDFs into web optimized ePapers that Google loves.
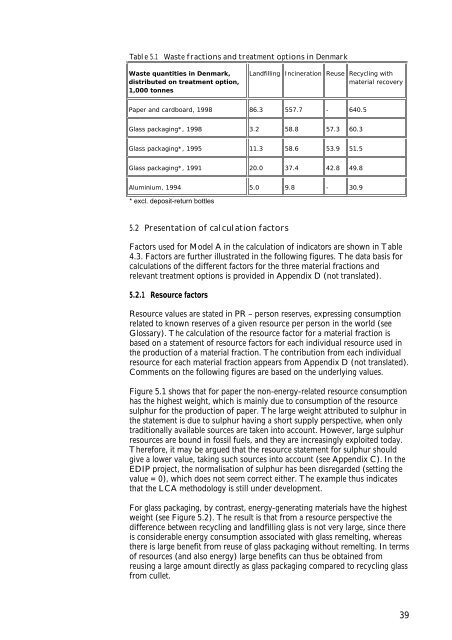
Table 5.1<strong>Waste</strong> fractions and treatment options in Denmark<strong>Waste</strong> quantities in Denmark,distributed on treatment option,1,000 tonnesLandfilling Incineration Reuse Recycling withmaterial recoveryPaper and cardboard, 1998 86.3 557.7 - 640.5Glass packaging*, 1998 3.2 58.8 57.3 60.3Glass packaging*, 1995 11.3 58.6 53.9 51.5Glass packaging*, 1991 20.0 37.4 42.8 49.8Aluminium, 1994 5.0 9.8 - 30.9* excl. deposit-return bottles5.2 Presentation of calculation factorsFactors used for Model A in the calculation of indicators are shown in Table4.3. Factors are further illustrated in the following figures. The data basis forcalculations of the different factors for the three material fractions andrelevant treatment options is provided in Appendix D (not translated).5.2.1 Resource factorsResource values are stated in PR – person reserves, expressing consumptionrelated to known reserves of a given resource per person in the world (seeGlossary). The calculation of the resource factor for a material fraction isbased on a statement of resource factors for each individual resource used inthe production of a material fraction. The contribution from each individualresource for each material fraction appears from Appendix D (not translated).Comments on the following figures are based on the underlying values.Figure 5.1 shows that for paper the non-energy-related resource consumptionhas the highest weight, which is mainly due to consumption of the resourcesulphur for the production of paper. The large weight attributed to sulphur inthe statement is due to sulphur having a short supply perspective, when onlytraditionally available sources are taken into account. However, large sulphurresources are bound in fossil fuels, and they are increasingly exploited today.Therefore, it may be argued that the resource statement for sulphur shouldgive a lower value, taking such sources into account (see Appendix C). In theEDIP project, the normalisation of sulphur has been disregarded (setting thevalue = 0), which does not seem correct either. The example thus indicatesthat the LCA methodology is still under development.For glass packaging, by contrast, energy-generating materials have the highestweight (see Figure 5.2). The result is that from a resource perspective thedifference between recycling and landfilling glass is not very large, since thereis considerable energy consumption associated with glass remelting, whereasthere is large benefit from reuse of glass packaging without remelting. In termsof resources (and also energy) large benefits can thus be obtained fromreusing a large amount directly as glass packaging compared to recycling glassfrom cullet.39