

Rabigh Refining & Petrochemical Co. (2380.SE)
Rabigh Refining & Petrochemical Co. (2380.SE)
Rabigh Refining & Petrochemical Co. (2380.SE)

Create successful ePaper yourself
Turn your PDF publications into a flip-book with our unique Google optimized e-Paper software.
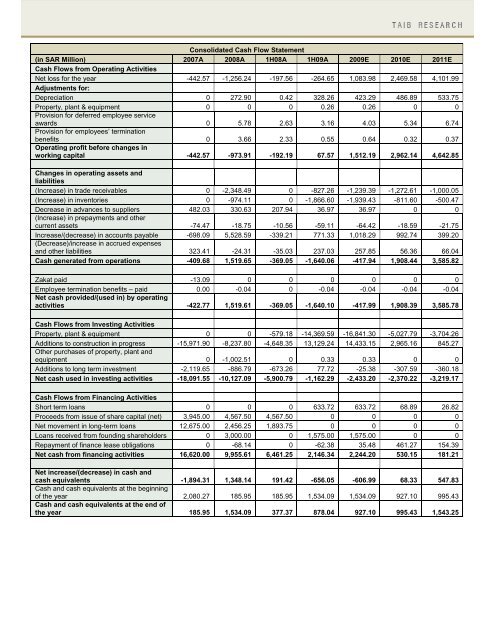
<strong>Co</strong>nsolidated Cash Flow Statement(in SAR Million) 2007A 2008A 1H08A 1H09A 2009E 2010E 2011ECash Flows from Operating ActivitiesNet loss for the year -442.57 -1,256.24 -197.56 -264.65 1,083.98 2,469.58 4,101.99Adjustments for:Depreciation 0 272.90 0.42 328.26 423.29 486.89 533.75Property, plant & equipment 0 0 0 0.26 0.26 0 0Provision for deferred employee serviceawards 0 5.78 2.63 3.16 4.03 5.34 6.74Provision for employees’ terminationbenefits 0 3.66 2.33 0.55 0.64 0.32 0.37Operating profit before changes inworking capital -442.57 -973.91 -192.19 67.57 1,512.19 2,962.14 4,642.85Changes in operating assets andliabilities(Increase) in trade receivables 0 -2,348.49 0 -827.26 -1,239.39 -1,272.61 -1,000.05(Increase) in inventories 0 -974.11 0 -1,866.60 -1,939.43 -811.60 -500.47Decrease in advances to suppliers 482.03 330.63 207.94 36.97 36.97 0 0(Increase) in prepayments and othercurrent assets -74.47 -18.75 -10.56 -59.11 -64.42 -18.59 -21.75Increase/(decrease) in accounts payable -698.09 5,528.59 -339.21 771.33 1,018.29 992.74 399.20(Decrease)/increase in accrued expensesand other liabilities 323.41 -24.31 -35.03 237.03 257.85 56.36 66.04Cash generated from operations -409.68 1,519.65 -369.05 -1,640.06 -417.94 1,908.44 3,585.82Zakat paid -13.09 0 0 0 0 0 0Employee termination benefits – paid 0.00 -0.04 0 -0.04 -0.04 -0.04 -0.04Net cash provided/(used in) by operatingactivities -422.77 1,519.61 -369.05 -1,640.10 -417.99 1,908.39 3,585.78Cash Flows from Investing ActivitiesProperty, plant & equipment 0 0 -579.18 -14,369.59 -16,841.30 -5,027.79 -3,704.26Additions to construction in progress -15,971.90 -8,237.80 -4,648.35 13,129.24 14,433.15 2,965.16 845.27Other purchases of property, plant andequipment 0 -1,002.51 0 0.33 0.33 0 0Additions to long term investment -2,119.65 -886.79 -673.26 77.72 -25.38 -307.59 -360.18Net cash used in investing activities -18,091.55 -10,127.09 -5,900.79 -1,162.29 -2,433.20 -2,370.22 -3,219.17Cash Flows from Financing ActivitiesShort term loans 0 0 0 633.72 633.72 68.89 26.82Proceeds from issue of share capital (net) 3,945.00 4,567.50 4,567.50 0 0 0 0Net movement in long-term loans 12,675.00 2,456.25 1,893.75 0 0 0 0Loans received from founding shareholders 0 3,000.00 0 1,575.00 1,575.00 0 0Repayment of finance lease obligations 0 -68.14 0 -62.38 35.48 461.27 154.39Net cash from financing activities 16,620.00 9,955.61 6,461.25 2,146.34 2,244.20 530.15 181.21Net increase/(decrease) in cash andcash equivalents -1,894.31 1,348.14 191.42 -656.05 -606.99 68.33 547.83Cash and cash equivalents at the beginningof the year 2,080.27 185.95 185.95 1,534.09 1,534.09 927.10 995.43Cash and cash equivalents at the end ofthe year 185.95 1,534.09 377.37 878.04 927.10 995.43 1,543.25


