

Galfar Engineering & Contracting (GECS.OM)
Galfar Engineering & Contracting (GECS.OM)
Galfar Engineering & Contracting (GECS.OM)

You also want an ePaper? Increase the reach of your titles
YUMPU automatically turns print PDFs into web optimized ePapers that Google loves.
<strong>Galfar</strong> <strong>Engineering</strong> & <strong>Contracting</strong>ContentsINVESTMENT HIGHLIGHTS..........................................................3C<strong>OM</strong>PANY OVERVIEW.................................................................4GALFAR’S SUBSIDIARY: AL KHALIJ HEAVY EQUIPMENT & ENGINEERING...................................................... 4CHAIRMAN AND MANAGEMENT........................................................................................................................ 5OWNERSHIP STRUCTURE.................................................................................................................................... 5TRADING: ADTV OF USD 1.7MN.......................................................................................................................... 6BONUS SHARES - APRIL 2009 AND 2010........................................................................................................... 7STRATEGY.................................................................................8<strong>OM</strong>ANI ECON<strong>OM</strong>Y......................................................................9INCREASING GOVERNMENT SPENDING: PRIORITY TO CIVIL INFRASTRUCTURE.......................................... 10<strong>OM</strong>ANI CONSTRUCTION MARKET...............................................11CIVIL IS THE LARGEST CONSTRUCTION SEGMENT.......................................................................................... 12GALFAR'S TARGET MARKET............................................................................................................................... 12GALFAR’S BACKLOG.................................................................13LOW BACKLOG/SALES, IMPLIES LOW EARNINGS VISIBILITY......................................................................... 13GALFAR’S TOP THREE CONTRACTS, ALL FR<strong>OM</strong> THE GOVERNMENT............................................................... 14CLIENT CONCENTRATION RISK - HIGH WITH THE GOVERNMENT.................................................................. 15BACKLOG GROWTH SLOWING DOWN FAST..................................................................................................... 15GALFAR IS TENDERING FOR <strong>OM</strong>R 1.4BN OF 2010 CONTRACTS ..................................................................... 16INCREASED PRESENCE OF FOREIGN FIRMS .................................................................................................... 16NO LONGER THE PREFERENTIAL CONTRACTOR FOR THE GOVERNMENT...................................................... 17SWOT ANALYSIS......................................................................18FINANCIAL ANALYSIS AND FORECASTS.......................................19REVENUES FALLING .......................................................................................................................................... 19GROSS PROFIT RECOVERING FR<strong>OM</strong> THE LOWS OF FY 09 ............................................................................... 20EBITDA ................................................................................................................................................................ 22NET PROFITS REACH BOTT<strong>OM</strong> IN 2009............................................................................................................. 22HIGH NET DEBT, MOST LEVERAGED CONTRACTOR IN THE REGION............................................................... 23CASH CONVERSION CYCLE STABILISING.......................................................................................................... 24RECEIVABLES PAST DUE UP 88% IN 2009 - A MAJOR CONCERN.................................................................. 24CAPEX DECLINE ................................................................................................................................................. 25DIVIDENDS PROPOSED...................................................................................................................................... 25VALUATION.............................................................................26SCENARIO DRIVEN THREE-STAGE DCF............................................................................................................. 26RELATIVE VALUATION......................................................................................................................................... 29UPSIDE TO OUR VALUATION............................................................................................................................... 30RISKS TO OUR VALUATION ................................................................................................................................ 30FINANCIALS............................................................................31March 18th, 2010 2
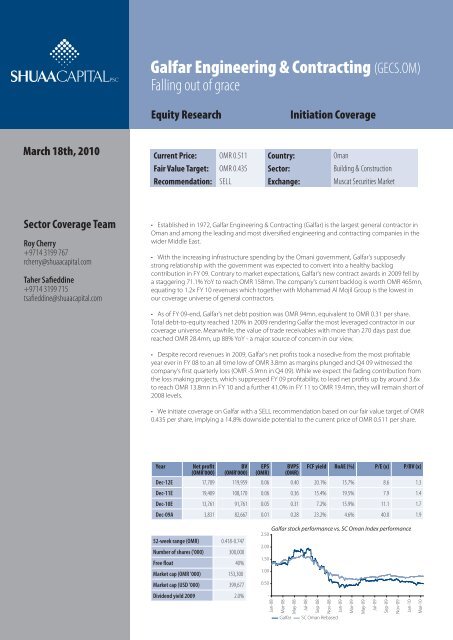
<strong>Galfar</strong> <strong>Engineering</strong> & <strong>Contracting</strong>Investment Highlights• Established in 1972, <strong>Galfar</strong> <strong>Engineering</strong> & <strong>Contracting</strong> (<strong>Galfar</strong>) is the largest generalcontractor in Oman and among the leading and most diversified engineering andcontracting companies in the wider Middle East.• Based on our estimated Omani construction market of <strong>OM</strong>R 24.4bn (USD 63.6bn),<strong>Galfar</strong>'s effective target market is worth an estimated <strong>OM</strong>R 10.5bn (USD 27.3bn). Weexpect this value to be converted into sector wide cash flows over the next 5 years whichimplies an average annual target market value of <strong>OM</strong>R 2.1bn (USD 5.5bn) per year or 5.6x<strong>Galfar</strong>'s FY 10 revenues.• With the increasing infrastructure spending by the Omani government, <strong>Galfar</strong>'ssupposedly strong relationship with the government was expected to convert into ahealthy backlog contribution in FY 09. Contrary to market expectations, <strong>Galfar</strong>'s newcontract awards in 2009 fell by a staggering 71.1% YoY to reach <strong>OM</strong>R 158mn. Thecompany's current backlog is worth <strong>OM</strong>R 465mn, equating to 1.2x FY 10 revenues whichtogether with Mohammad Al Mojil Group is the lowest in our coverage universe ofgeneral contractors.• Going forward, we expect the challenging oil & gas construction market coupled withthe increasingly competitive general contracting environment and the market's growingdependence on the few but high value government contracts, to separate the marketwinners from the rest. The recent trend of high profile contract losses by <strong>Galfar</strong> to globalplayers (even when it was the lowest bidder) - fuel our doubts surrounding its ability to beamong the big winners.• As of FY 09-end, <strong>Galfar</strong>'s net debt position was <strong>OM</strong>R 94mn, equivalent to <strong>OM</strong>R 0.31 pershare. Total debt-to-equity reached 120% in 2009 rendering <strong>Galfar</strong> the most leveragedcontractor in our coverage universe. Meanwhile, the value of trade receivables with morethan 270 days past due reached <strong>OM</strong>R 28.4mn, up 88% YoY - a major source of concern inour view.• Despite record revenues in 2009, <strong>Galfar</strong>'s net profits took a nosedive from the mostprofitable year ever in FY 08 to an all time low of <strong>OM</strong>R 3.8mn as margins plunged andQ4 09 witnessed the company's first quarterly loss (<strong>OM</strong>R -5.9mn in Q4 09). While weexpect the fading contribution from the loss making projects, which suppressed FY 09profitability, to lead net profits up by around 3.6x to reach <strong>OM</strong>R 13.8mn in FY 10 and afurther 41.0% in FY 11 to <strong>OM</strong>R 19.4mn, they will remain short of 2008 levels.• We initiate coverage on <strong>Galfar</strong> with a SELL recommendation based on our fair valuetarget of <strong>OM</strong>R 0.435 per share, implying a 14.8% downside potential to the current priceof <strong>OM</strong>R 0.511 per share.March 18th, 2010 3
<strong>Galfar</strong> <strong>Engineering</strong> & <strong>Contracting</strong>Company overviewLargest generalcontractor in OmanEstablished in 1972, <strong>Galfar</strong> <strong>Engineering</strong> & <strong>Contracting</strong> (<strong>Galfar</strong>) is the largest generalcontractor in Oman and among the leading and most diversified engineering andcontracting companies in the wider Middle East. <strong>Galfar</strong> offers heavy and civil contractingand engineering services. The company's revenues are generated through four keysegments:• Oil & Gas• Roads & Bridges• Structures & Buildings• UtilitiesThe company’s Oil & Gas Division has been the largest source of revenue over the lastfive years, contributing around 35% to total revenue. Oil & gas work involves design,procurement, construction of pipelines, maintenance works, expansion work and stationshut down jobs.The Roads & Bridges Division is involved in the construction of roads, bridges,interchanges, under passes and recharge dams. The Structures & Buildings unit carries outlarge infrastructure projects such as hospitals, marine facilities and ports.<strong>Galfar</strong>'s Utility Department is focused at various building services such as sewage, watertreatment plants, electronic surveillance and security systems, power plant operationand maintenance, hospital services, reverse osmosis plants, heating, ventilating and airconditioning (HVAC).Key clients include thegovernment and PDOInvolved in someof the Sultanate'slargest projectsThe company's current backlog is worth <strong>OM</strong>R 465mn spread out over the four differentbusiness lines. Through its various ministries and projects, the Government of Oman, is<strong>Galfar</strong>'s major client. Petroleum Development Oman (PDO), the national oil company ofOman, is another key client for <strong>Galfar</strong>.Currently, the company is building some of the largest projects in the Sultanate including:• Ship repair and dry-dock complex at Duqm Port• Service facilities within Qarm Alam steam project - the world's first full-fieldsteam-injection development.• A'Seeb coastal vacuum sewers network and ancillary works (wastewater)• Muscat Expressway project - a 53km expressway with more than 40 bypasses andbridges.<strong>Galfar</strong>’s subsidiary: Al Khalij Heavy Equipment & <strong>Engineering</strong>Subsidiary offersleasing services ofheavy equipmentIn January 2006, <strong>Galfar</strong> acquired a 52.2% ownership stake in Al Khalij Heavy Equipmentand <strong>Engineering</strong> LLC for a total consideration of <strong>OM</strong>R 0.6mn resulting in a goodwill of<strong>OM</strong>R 0.28mn. The company offers leased transport services, rig support functions andheavy lift activities. The subsidiary has managed to generate more than half of its revenuesfrom external customers over the 2006-2008 period. Hire revenues accounted for a mere0.4% of <strong>Galfar</strong>'s total FY 09 revenues. More importantly, Al Khalij has been making lossessince acquisition in 2006.March 18th, 2010 4
<strong>Galfar</strong> <strong>Engineering</strong> & <strong>Contracting</strong>Chairman and managementMr. Salim Saeed Al Araimi, ChairmanMr. Al Araimi is the chairman of the board of directors at <strong>Galfar</strong>. He is also the chairman ofNational Drilling & Services, Al Khalij Heavy Equipment and Oman Packaging Company.Mr. Al Araimi also served as the Vice President of Oman Chambers of Commerce &Industry and as a board member of Franco-Arab Chamber of Commerce. He holds anhonorary degree of Doctor of Technology from the Glasgow Caledonian University, UK.His 18% stake in <strong>Galfar</strong> renders him the single largest shareholder.Dr. Hans Erlings, CEO and PresidentDr. Erlings joined <strong>Galfar</strong> in March 2006 following a 26-year employment with Shell.During his time with Shell, Dr. Erlings held various senior management positions acrossdifferent continents in the fields of engineering and management, the last of whichbeing the General Manager of the Nigeria operations. He was also engaged in businesswith Petroleum Development of Oman (34% owned by Shell) for seven years, where hemost recently held the positions of <strong>Engineering</strong> Director and Manager of Contracts andProcurement. Dr. Erling holds a degree in Material <strong>Engineering</strong> and a doctorate in PhysicalChemistry from the University of Delft in the Netherlands.Mr. S Muthukrishnan, CF<strong>OM</strong>r. Muthukrishnan is responsible for the company's financial operations from finance totreasury. He has more than 20 years of experience in the construction industry of which 8years are with <strong>Galfar</strong>. He holds a management program degree from the Indian Institute ofManagement (IIM).Ownership structureThe estimated free float in <strong>Galfar</strong> is 40%, with the remainder being held by the foundinginvestors. The largest stake is held by Salim Said Al Araimi, who holds an 18% share in thecompany based on the most recently available data.Public40.0%<strong>Galfar</strong>'s ownership structureSalim Said Al Araimi18.0%P. Mohamed Ali10.0%Qhassya Projects &Investment2.5%PMA International Ltd.5.0%Aimmar UnitedInvestment & Projects12.0%Al Siraj Investment &Project12.5%Source: <strong>Galfar</strong>March 18th, 2010 5
<strong>Galfar</strong> <strong>Engineering</strong> & <strong>Contracting</strong>120,000,000Trading: ADTV of USD 1.7mn<strong>Galfar</strong> has the lowest average daily traded value (ADTV) compared to other listed GCCcontractors - Arabtec Holding (Arabtec), Drake & Scull International (DSI) and MohammadAl Mojil Group (MMG).ADTV - GCC Construction Companies100,000,000USD80,000,00060,000,00040,000,00020,000,000-May-08Jun-08Jul-08Aug-08Sep-08Oct-08Nov-08Dec-08Jan-09Feb-09Mar-09Apr-09May-09Jun-09Jul-09Aug-09Sep-09Oct-09Nov-09Dec-09Jan-10Feb-10Arabtec DSI MMG <strong>Galfar</strong>Source: Reuters, SHUAA CapitalTraded valuesubstantially lowerthan regional peers<strong>Galfar</strong>'s ADTV for the last twelve months amounted to USD 1.7mn. This compares toArabtec's USD 24.1mn, DSI's USD 10.2mn and MMG's USD 10.8mn. In short, the valuetraded in Arabtec's shares is 14x that of <strong>Galfar</strong> and MMG's ADTV is six times that of <strong>Galfar</strong>.Multiple of <strong>Galfar</strong>'s ADTV1009080706050403020100ADTV mutiple of Arabtec, DSI and MMG vs. <strong>Galfar</strong>Arabtec, 7xSource: Reuters, SHUAA CapitalMMG, 28xMay- Jun- Jul- Aug- Sep- Oct- Nov-08 08 08 08 08 08 08Arabtec DSI MMGDec-08Jan-09Feb-09Mar-09Apr-09May- Jun- Jul-09 09 09Aug-09DSI, 10xSep-09Arabtec, 88xMMG, 16x<strong>Galfar</strong>'s ADTV/free float is around 1.1% compared to DSI's 3.2%, Arabtec's and MMG's 4.0%.Oct-09Nov-09Dec-09Jan- Feb-10 10USD '000ADTV vs. free float of GCC constrcution companies700,0004.0%4.0%600,000500,000400,000606,6293.2%300,000313,059200,000267,1671.1%100,000159,27310,788 24,067 10,172 1,718-MMG Arabtec DSI <strong>Galfar</strong>ADTV (USD '000) Free float (USD '000) ADTV/Free floatSource: Reuters, SHUAA Capital4.5%4.0%3.5%3.0%2.5%2.0%1.5%1.0%0.5%0.0%March 18th, 2010 6
<strong>Galfar</strong> <strong>Engineering</strong> & <strong>Contracting</strong>Bonus shares - April 2009 and 2010Recommended issuanceof 10% bonus sharesin March 2010In April 2009, the company's AGM was held and approved the issuance of a 20% bonusshares. As a result, the share capital increased from <strong>OM</strong>R 25mn to <strong>OM</strong>R 30mn through thetransfer of <strong>OM</strong>R 5mn (equivalent to 50mn shares) from the retained earnings account tothe share capital.Currently, the company's share capital stands at <strong>OM</strong>R 30mn distributed over 300mnshares outstanding with a par value of <strong>OM</strong>R 0.1 per share.However, the Board of Directors recently proposed the issuance of another10% bonusshares. This proposition is subject to shareholder approval at the AGM to be held on the29th of March 2010. Assuming shareholders approve the 10% bonus shares issuance, ourfair value target on <strong>Galfar</strong> shares would be reduced to <strong>OM</strong>R 0.396 (the current fair valuetarget of <strong>OM</strong>R 0.435/1.1 [adjustment for 10% bonus shares]).March 18th, 2010 7
<strong>Galfar</strong> <strong>Engineering</strong> & <strong>Contracting</strong>StrategyConsolidate positionamid growingcompetitionDiversify into the civiland infrastructuresegments…By capitalizingon the government'sincreased civil spendingAnd penetrating intokey growth marketslike India and MENA<strong>Galfar</strong>'s main challenge has become to consolidate its position as a market leader inits home-market, Oman, where it is facing increasing competition and a seeminglydeteriorating ability to win contracts.While oil & gas related contracting revenues have been the largest contributor to <strong>Galfar</strong>'stop-line (estimated average of 35% in the past five years), the company realises that withover 6.5 mbpd of excess global oil capacity, exploration and production spending isbound to decline thus diminishing any medium-term growth potential in this segment.With this in mind, <strong>Galfar</strong> is aggressively pursuing expansion into the civil and infrastructuresegments.<strong>Galfar</strong> aims to capitalize on the Omani government's increasing spending on civil projectsand more precisely infrastructure work. Contracts are being tendered and awarded forthe construction and development of six new airports with <strong>Galfar</strong> recently clinchingthe second phase of Ras Al Hadd Airport. <strong>Galfar</strong> is also bidding for several transportinfrastructure projects, under its Roads & Bridges Division. According to our analysis, thecivil segment is the largest segment in the Omani construction market, with a total valueof <strong>OM</strong>R 9.0bn (37% share, USD 23.5bn).In addition, <strong>Galfar</strong> is pursuing a geographic diversification strategy with the aim to reduceits reliance on the Omani market and the earnings volatility this can lead to. As a first astep in this direction, the company established a 100% owned subsidiary in India underthe name of <strong>Galfar</strong> <strong>Engineering</strong> & <strong>Contracting</strong> (India) Pvt. <strong>Galfar</strong> India's focus is on theinfrastructure segment of the Indian market, mainly roads and bridges. The choice fell onIndia as the country is investing heavily in infrastructure projects. However, much of themajor infrastructure projects in the roads and bridges domain in India, are being awardedon a BOT (build, operate, transfer) basis with a 25 year tenure. As a result, <strong>Galfar</strong> optedto join hands with two other companies and form the Mahakaleshwar Tollways Pvt. Ltd.(MTPL) consortium, which is bidding for BOT road projects in India. <strong>Galfar</strong> holds a 26%stake in MTPL. <strong>Galfar</strong> India aims to be the contracting arm of this joint-venture, effectivelythe B in BOT. As a first step, MTPL awarded the construction contract of the Indore-Ujjainroad to <strong>Galfar</strong> India last year.Moreover, <strong>Galfar</strong> aims to explore the competitiveness of its services in the wider MENAregion and more specifically in the lucrative Abu Dhabi and Libyan markets. The objectiveis to mitigate the impact of diminishing contract awards in the Omani oil & gas industry.In an attempt to enter the Abu Dhabi oil & gas construction market, the company is in theprocess of teaming up with Saipem, one of the largest EPC contractors in the world. <strong>Galfar</strong>aims to capture the construction part of these EPC contracts. The construction portionof EPC contracts typically constitutes 30-35% of the total contract value. Global playerslike Saipem typically subcontract the construction work to local and regional contractors.So far there has been no announcement on any contract awards to <strong>Galfar</strong> in Abu Dhabior Libya; consequently, both these potential markets for the company's services are notincluded in our valuation.March 18th, 2010 8
<strong>Galfar</strong> <strong>Engineering</strong> & <strong>Contracting</strong>Omani economy70Oman's GDP growth14%8Oman's current account balance20%6012%615%5010%410%USD bn4030208%6%4%USD bn2-(2)5%0%2002 2003 2004 2005 2006 2007 2008 2009E 2010F-5%102%(4)-10%-0%2002 2003 2004 2005 2006 2007 2008 2009E 2010FNominal GDP (USD bn) Real GDP growth (%)(6)Current Account Balance (USD bn)% GDP-15%USD bnOman's total government debtOman's gross fixed capital formation4.018.0% 2060%3.516.0% 1850%14.0%163.01412.0%40%2.51210.0%2.01030%1.58.0%86.0%620%1.04.0% 410%0.52.0% 20.00.0% -0%2002 2003 2004 2005 2006 2007 2008 2009E 2010F2002 2003 2004 2005 2006 2007 2008Total government debt (USD bn) % GDPGross fixed capital formation (USD bn) % GDPUSD bnSource: Ministry of National Economy, IIF, SHUAA CapitalMarch 18th, 2010 9
<strong>Galfar</strong> <strong>Engineering</strong> & <strong>Contracting</strong>Increasing government spending: Priority to civil infrastructure2010 budget... largest inthe Sultanate's historyThe Omani government's revenues declined by an estimated 14% last year primarily dueto falling oil prices. Meanwhile, total expenditure increased by11%.Omani government budget (<strong>OM</strong>R mn)Details 2007 2008 2009 2010Budgeted Actual Budgeted Actual Budgeted Estimated BudgetedRevenues 4,490 5,921 5,400 7,639 5,614 6,567 6,380Expenditure 4,890 5,880 5,800 7,560 6,424 6,719 7,180Current expenditure 3,398 4,183 3,935 5,279 4,505 4,355 5,052Investment expenditure 1,492 1,697 1,865 2,281 1,919 2,364 2,128Budget surplus (deficit) (400) 40 (400) 78 (810) (152) (800)Source: Ministry of National Economy, Central Bank of Oman, SHUAA CapitalInvestment expenditureon the rise… Powered bycivil spendingNevertheless, the government increased its investment expenditure by around 4% toreach <strong>OM</strong>R 2.4bn in 2009. While investments in civil infrastructure and oil productionwitnessed a growth of 10% and 4% respectively YoY, spending on gas productiondeclined by an estimated 14%.In a nutshell, civil spending is up and energy investments are down 3% YoY - providingfurther justification to <strong>Galfar</strong>'s growing focus on civil contracting.<strong>OM</strong>R mnOman energy expenditureOman civil expenditure1,40050% 1,6001,2001,40040%1,2001,00030%1,00080020% 80060060010%4004002000%200--10% -2005 2006 2007 2008 2009E 2010FBudgeted Actual Growth in actual expenditureSource: Ministry of National Economy, Central Bank of Oman, SHUAA Capital<strong>OM</strong>R mn50%45%40%35%30%25%20%15%10%5%0%2005 2006 2007 2008 2009E 2010FBudgeted Actual Growth in actual expenditureMarch 18th, 2010 10
<strong>Galfar</strong> <strong>Engineering</strong> & <strong>Contracting</strong>Omani construction marketOmani constructionmarket worth<strong>OM</strong>R 24.4bnIn our analysis of the Omani construction market, we reached an estimated market valueof <strong>OM</strong>R 24.4bn (USD 63.6bn), implying a 36% reduction to the total value of announcedprojects during 2009. We reached this figure by reviewing and adjusting all key projectsand their announced values for the prevailing market reality and a conservative long-termoutlook.More specifically, we analysed company announcements and project-related news on allprojects above <strong>OM</strong>R 200mn, taking into account the following market conditions into ouranalysis:• Decrease in oil prices; the main source of fiscal revenues in Oman• High-levels of spare oil production capacity• Relative lack of funding, leading mega-projects to be put on-hold or downsized• Falling project costs as a result of declining global demand• Continued uncertainty and low visibility of future growth; high volatility of investments'returnsBlue City project…the most substantialreducing impactTop five projects losing59% after our analysisWith the prevailing market conditions in mind, we reduced project values we consideredto be outdated, inflated and inconsistent with market reality. The largest project and theone which had the most substantial reducing impact on the estimated market size inOman was Blue City (Al Madina A'Zarqa), which has been severely impacted by the gulfwidereal estate market deterioration and the diminished appetite for off-plan propertybuying.Combined, the top-five projects in Oman before our analysis were valued at <strong>OM</strong>R 14.6bn(USD 38.2bn), implying 38% of announced project values in the country. Post our analysisand the value reductions this led to, these projects have an estimated total worth of <strong>OM</strong>R6.0bn (USD 15.6bn) and contribute 25% of market value.Top five Omani projects on holdProjectAnnounced project valueSC project value Reduction in value(<strong>OM</strong>R mn)(<strong>OM</strong>R mn)Blue City 7,427 1,485 -80%Duqm Refinery & Petrochemical Complex 2,684 1,543 -43%Coal Fired Power Plant in Raysut-PDO 1,877 1,502 -20%Oman India Gas Pipeline 1,342 805 -40%Sohar Olefins Complex - OPIC 1,304 652 -50%Total 14,634 5,988 -59%Source: Proleads, SHUAA CapitalOman's Blue City project is an <strong>OM</strong>R 7.4bn (USD 20bn) mega development initially plannedto be a 32-square-kilometer city built over 20 years offering residential, commercial andretail space in addition to various hotels and amenities. The city, which had the largestannounced project value in Oman, ended at the top of our list of 'projects on hold'.Moody's and Fitch downgraded several bond issues related to the project due to lowerthan expected sales and slower than anticipated progress. This came with unfavourableproperty market conditions in late 2008 and escalating troubles between the project'sowners which had put the project to an almost complete stop. Market reports claim therehas been no progress on the project since October 2009, fuelling concerns surroundingthe project's fate.March 18th, 2010 11
<strong>Galfar</strong> <strong>Engineering</strong> & <strong>Contracting</strong>Civil is the largest construction segmentCivil segment isworth <strong>OM</strong>R 9bnBased on our findings, the civil segment is by far the largest in Oman, with an estimatedvalue of <strong>OM</strong>R 9.0bn followed by power at <strong>OM</strong>R 3.5bn and oil at <strong>OM</strong>R 2.9bn.<strong>OM</strong>R mn10,0009,0008,0007,0006,0005,0004,0003,0002,0001,000SHUAA Capital Oman projects value by segment9,0203,4632,8842,553 2,3882,071 2,021Petrochemical8.5%Gas9.8%Water10.5%Industrial8.3%Civil37.0%-Civil Power Oil Water Gas Petrochemical IndustrialOil11.8%Power14.2%Source: Proleads, SHUAA Capital<strong>Galfar</strong>'s target marketTarget market worth<strong>OM</strong>R 10.5bnIn civil projects, a general contractor can execute 65-90% of a project's total value; fromconstruction to most of the procurement and even a greater share of the engineeringand project management works. However, in the more technically advanced segmentslike petrochemicals, oil, gas and even utility projects, contractors like <strong>Galfar</strong> only take theconstruction portion of the project which is generally outsourced by leading internationalEPC 1 contractors without the procurement and engineering aspects. As a rule of thumbthe construction proportion of EPC projects typically accounts for 30-35% of the totalvalue.<strong>Galfar</strong>'s target marketSegment Value (<strong>OM</strong>R mn) Contractor's share Target market value (<strong>OM</strong>R mn)Civil 9,020 65% 5,863Oil & Gas 5,272 30% 1,582Power 3,463 30% 1,039Water 2,553 30% 766Petrochemical 2,071 30% 621Industrial 2,021 30% 606Total 24,400 10,477Source: SHUAA CapitalAs a result, <strong>Galfar</strong>'s effective target market is worth an estimated <strong>OM</strong>R 10.5bn based onthe total value of announced projects in Oman. We expect this value to be convertedto sector-wide cash flows over the next 5 years which implies an average annual targetmarket value of <strong>OM</strong>R 2.1bn per year.1<strong>Engineering</strong>, procurement and constructionMarch 18th, 2010 12
<strong>Galfar</strong> <strong>Engineering</strong> & <strong>Contracting</strong><strong>Galfar</strong>’s backlogBacklog stands at<strong>OM</strong>R 465mn…41% in civil, 26% inutility & services and19% in roads & bridges<strong>Galfar</strong>'s current backlog is worth <strong>OM</strong>R 465mn, which equates to 1.1x FY 09 revenues and1.2x our revenue projections for 2010. The company's policy is to announce the totalvalue of its backlog along with the full year financials and the associated Directors' andManagement reports.While the company does not provide a detailed backlog breakdown, based on allprevious contract award announcements and our estimates on percentage of completionper contract; 99.4% of <strong>Galfar</strong>'s <strong>OM</strong>R 465mn backlog is in Oman with the balancerepresenting the company's first contract in India. Based on our estimates the backlog isbroken-down as follows: 40.8% Civil, 26.4% Utility, 19.1% Roads & Bridges, 13.1% Oil & Gasand 0.6% India.200180<strong>Galfar</strong>'s estimated backlog by segment190Oil & Gas13.1%India0.6%160<strong>OM</strong>R mn14012010080601238961Roads & Bridges19.1%Civil40.8%4020-Civil Utility Roads & Bridges Oil & Gas India3Utility26.4%Source: <strong>Galfar</strong>, SHUAA CapitalLow backlog/sales, implies low earnings visibilityBacklog is 1.2x projectedFY 10 revenues<strong>Galfar</strong>'s backlog/sales ratio of 1.1x for 2009 and 1.2x for 2010 are, together withMohammad Al Mojil Group's ratios, the lowest in our coverage universe of generalcontractors. In other words, <strong>Galfar</strong> has a very low relative revenue generating ability, basedon existing backlog. <strong>Galfar</strong>'s ratio is 62% that of DSI and 91% that of Arabtec (excludingthe AED 10 bn Russian contract).Backlog/revenues comparisonCompany Backlog/Revenues 09E Backlog/Revenues 10ESaipem 1.8 1.8Technip 1.2 1.3Petrofac 2.2 1.8Arabtec Holding* 1.7 1.4MMG 1.0 1.3DSI 2.2 2.0Samsung <strong>Engineering</strong> 3.5 2.6GS <strong>Engineering</strong> 4.3 3.7Daewoo <strong>Engineering</strong> 4.8 4.5Larsen & Tubro 2.1 1.7Carillion 4.2 4.3Strabag 1.1 1.1Average - regional peers 1.7 1.5Average - all peers 2.5 2.3<strong>Galfar</strong> 1.1 1.2Source: SHUAA Capital, Company reports, Bloomberg*Used Arabtec backlog excludes AED 10bn equivalent Russian contractMarch 18th, 2010 13
<strong>Galfar</strong> <strong>Engineering</strong> & <strong>Contracting</strong><strong>Galfar</strong>’s top three contracts, all from the governmentEstimated backlogvalue of <strong>OM</strong>R 65mnVacuum sewers network and ancillary works, A'Seeb coastal stripIn February 2008, <strong>Galfar</strong> was awarded an <strong>OM</strong>R 86.9mn contract from Oman WastewaterServices Company (OWSC) for the construction of sewers networks and various ancillaryworks for wastewater treatments along A'Seeb coastal strip. OWSC is a fully ownedgovernment entity operating under the Ministry of Finance. This award is one of severalwithin this project aimed at upgrading the water utilities structures along the Seeb area.The expected completion date of this project is Q3 11. Based on our estimates almost26% of the contract work was completed as of FY 09-end.A'Seeb coastal stripContract detailsContract nameVacuum sewers network and ancillary worksContract value<strong>OM</strong>R 86.9mnCurrent backlog estimate<strong>OM</strong>R 64.7mnExpected completion date Q3 11Client nameOman Wastewater Services Co./Ministry of FinanceSource: <strong>Galfar</strong>, SHUAA CapitalSecond phase ofa new airportRas Al Hadd Airport contract<strong>Galfar</strong> secured in February 2010 an <strong>OM</strong>R 40.5mn contract for the construction of thesecond phase of the new Ras Al Hadd Airport in Al Sharqiah region. The Ministry ofTransportation and Communication already awarded the first phase of the project to thelocal Desert Lines Projects back in H2 2008. <strong>Galfar</strong>'s scope of work entails area levellingin addition to the construction of a four kilometer -long runway, fuel hydrant and otherfacilities. The project is expected to be completed towards the second half of 2011. Theclient will tender the third and largest phase of this airport project in H2 10 which willcover the construction of a new passenger terminal building and an air traffic controltower.Ras Al Hadd AirportContract detailsContract namePackage 2 - Airside infrastructureContract value<strong>OM</strong>R 40.5mnCurrent backlog estimate<strong>OM</strong>R 40.5mnExpected completion date Q4 11Client nameMinistry of Transportation & CommunicationSource: <strong>Galfar</strong>, SHUAA CapitalA J.V for Oman'slargest dry dockShip repair yard and Dry-dock complex, Duqm PortIn January 2008, The Ministry of National Economy awarded the J.V of Daewoo<strong>Engineering</strong> and <strong>Galfar</strong> <strong>Engineering</strong> an <strong>OM</strong>R 170.2mn contract for the construction of aship repair yard and a dry-dock complex at the Duqm Port. <strong>Galfar</strong>'s share of the projectwas 41% with a contract value of <strong>OM</strong>R 69.6mn. When completed in H2 10, the dock willrival the biggest in the region as it will be equipped to handle some of the largest vesselsin service today, including the Ultra-Large Crude Carriers (ULCCs). The dry dock will takeadvantage of the Duqm port's proximity to the busy regional sea lanes crossing Oman'swaters. We estimate that almost 49% of the contract work was completed as of FY 09-end.Duqm PortContract detailsContract nameShip repair yard and Dry-dock complexContract value<strong>OM</strong>R 69.6mnCurrent backlog estimate<strong>OM</strong>R 35.2mnExpected completion date Q3 10Client nameMinistry of National EconomySource: <strong>Galfar</strong>, SHUAA CapitalMarch 18th, 2010 14
<strong>Galfar</strong> <strong>Engineering</strong> & <strong>Contracting</strong>Client concentration risk - high with the governmentAround 69% of the backlogdirectly with the governemntWhile names of <strong>Galfar</strong>'s clients vary, most of its contracts come from fully-owned orquasi-government entities. 68.7% of <strong>Galfar</strong>'s backlog is directly from the government or100% owned government entities. A further 15.6% of the backlog comes from quasigovernmententities, which includes Petroleum Development Oman and Oman GasCompany. The balance of 15.7% is mainly from subcontracts from private companiesacting as lead contractors on government projects. Major private clients include Petrofacand Vale. Petrofac is a global EPC contractor with a focus on oil & gas projects and theEPC contractor on the Harweel EOR project. Vale is the second largest mining companyin the world; and has subcontracted the construction portion of their EPC contract for apelletizing project at Sohar.400350Breakdown of <strong>Galfar</strong>'s contracts and backlog by clientPrivate15.7%300<strong>OM</strong>R mn250200150Quasi-Government15.6%10050-PetroleumDevelopmentOmanMinistry ofTransportation &CommunicationMuscatMunicipalityContract valueOmanWastewaterServices Co.PetrofacOthersMinistry ofNationalEconomyBacklog estimateMinistry ofHealthBank MuscatPublic Authorityfor Electricity &WaterRoyal CourtAffairsMinistry ofDefenseOmanElectricity andTransmissionOman GasMuscatElectricity &Distribution Co.Ministry ofRegionalMunicipalities &WaterGovernment68.7%Source: <strong>Galfar</strong>, SHUAA CapitalBacklog growth slowing down fastAwarded <strong>OM</strong>R 158mn in2009, 71% lower YoYWe estimate <strong>Galfar</strong> won <strong>OM</strong>R 158mn worth of contracts during 2009, which implies a 71%decline YoY in backlog additions. However, we expect 2010 to witness a strong 52%improvement relative to the previous year despite remaining way below the record yearof 2008. We expect the company's medium-term backlog growth to come mainly fromcivil projects related to the government such as airports, roads and bridges work on theback of increasing infrastructure spending.1,000Backlog additions 2008-2012800717717<strong>OM</strong>R mn600400200533 547158465465240330330285 251 251 255169-(200)(400)(600)(363)(410) (375) (364) (336)2008 2009 2010F 2011F 2012FOpening backlog Backlog additions Revenue Closing backlogSource: <strong>Galfar</strong>, SHUAA CapitalMarch 18th, 2010 15
<strong>Galfar</strong> <strong>Engineering</strong> & <strong>Contracting</strong>In our backlog projections, we estimate that <strong>Galfar</strong> will secure around <strong>OM</strong>R 240mn in newawards during FY 10, the majority of which we expect to be generated from civil works.Moving forward, we expect over 80% of new contract awards will come from civil works,with the balance from oil & gas.Tendering for atleast <strong>OM</strong>R 1.4bn of2010 contractsBidding for all airportdevelopment packages<strong>Galfar</strong> is tendering for <strong>OM</strong>R 1.4bn of 2010 contracts<strong>Galfar</strong> is currently tendering for at least <strong>OM</strong>R 1.38bn (USD 3.61bn) in Oman, with almostthe entire basket of tenders being on Omani government civil projects. The majorityof these projects are airport development packages. <strong>Galfar</strong>'s growing focus on thesepre-dominantly civil and infrastructure projects is a direct result of the increasing Omanigovernment prioritisation of this segment over continued oil & gas investments. Thisstrategic shift by the Omani government intends to make the Omani economy morediversified and thus less reliant on its hydrocarbon resources and the volatility of theirmarket prices.The Ministry of Transport and Communication is expected to continue its spending spreein line with plans to develop and upgrade a total of six airports in the Sultanate. <strong>Galfar</strong> isbidding for almost all these ongoing tenders amidst increasing competition from localand foreign companies. Several roads packages are also expected to be awarded during2010 including phase 4 of the rehabilitation works for Nizwa - Thumrait Road. We notethat <strong>Galfar</strong> is already working on the currently ongoing third phase of this project.<strong>Galfar</strong> key tendersProjectEstimated tender value (<strong>OM</strong>R mn)Muscat International Airport- Air Traffic Control Tower 23Muscat International Airport- New Terminal Building 345Salalah Airport- New Terminal Building 326New Sohar Airport - Package 2 - Airfield Infrastructure 38New Sohar Airport - Package 3 - Passengers Terminal 115Duqm Airport - Phase 2 - Airfield Infrastructure work 38Duqm Airport - Phase 2 - Passenger Terminal Building 75Ras Al Hadd Airport - Package 3- Passengers Terminal 48Crown Plaza Duqm Resort - Construction Package 115Multipurpose harbour and road network at Halaniyat Islands - Construction Package 38New hospital at Masirah - Main Construction Package and Ancillary Works 12Nizwa - Thumrait Road - Phase 4 - Rehabilitation Works 38Wadi Daiqah Dam - Quriyat Network 115Muscat Wastewater project - New Darsait STP 58Total 1,384Source: Proleads, SHUAA CapitalIncreased presence of foreign firmsThe stream of oncoming tenders in Oman has resulted in noticeably higher participationfrom foreign companies highlighting <strong>Galfar</strong>’s exposure to increased competition. <strong>Galfar</strong>’smighty standing amongst local contractors, in terms of capacity and capabilities, is not aspronounced when other respectable foreign players are included.Losing its standingfor growing foreigncompetitionMajor players that are permanently positioning themselves in Oman include Larsen& Toubro Oman (India), CCC (Greece), TAV (Turkey), Carillion (UK) and Strabag Oman(Austria). This increasingly competitive landscape has led major foreign firms to venturewith local firms aiming to leverage on their existing know-how of the Omani constructionmarket thus increasing their competitive edge. In oil and gas, key EPC players like Petrofachave already been active for some time in the Sultanate.March 18th, 2010 16
<strong>Galfar</strong> <strong>Engineering</strong> & <strong>Contracting</strong>Major tenders lost by <strong>Galfar</strong> to foreign firmsProject Sector Contractor Estimated tender value(<strong>OM</strong>R mn)Muscat International Airport - Infrastructure and Civil Works Civil CCC & TAV 500Batinah coastal road - Phases 1 and 2CivilMakyol and NagarjunaConstructionOman Parliament - Construction Works Civil Carillion Alawi 100New Sohar airport - Infrastructure Works Civil Strabag Oman 40Power substations and grid networks - EPC Works Power Larsen & Tubro 35Amarat Heights Dam in Wadi Adai - Construction Works Civil Strabag Oman 28New royal flight hangar at Seeb International Airport - Construction Works Civil Larsen & Tubro 16Asian Beach Games - Infrastructure Works Civil Larsen & Tubro 9Total 1,001Source: Proleads, SHUAA Capital274No longer the preferential contractor for the governmentThe government'shandyman?<strong>Galfar</strong> was the Omani government's preferred contractor, mainly due to the exceptionallyhigh rate of Omani's within it workforce in a market dominated by foreign workers,which led it to gain a reputation as the government’s handyman. <strong>Galfar</strong> has enjoyed thecontinued participation in government contracts and those awarded by local oil and gascompanies, most notably with Petroleum Development Oman for over three decades.While the growing spending by <strong>Galfar</strong>'s largest client, the Government of Oman, oninfrastructure projects during 2009 and the years ahead would normally be expected tohave a positive effect on the largest local contractor and the largest single employer ofOmani's in the Sultanate, the reality on the ground suggests otherwise. In fact, the totalvalue of <strong>Galfar</strong>'s 2009 contract additions fell by 71% YoY to reach <strong>OM</strong>R 158mn in FY 09.It seems a change is in the making with the government of Oman clearly signalling theend of an era and the beginning of a new one. Perhaps the most symbolic of this shift,was the fact that the <strong>Galfar</strong> JV with Indian Larsen & Toubro lost the Muscat Airport despitebeing the lowest bidder, to an entirely foreign consortium of Greek-based ConsolidatedContractors Company (CCC) and Turkey’s TAV. While <strong>Galfar</strong> asked for USD 1.28bn, CCCwon despite bidding USD 1.32bn. Another example is the Sohar Airport; this <strong>OM</strong>R 40mncontract was awarded to another foreign company, Strabag Oman.March 18th, 2010 17
<strong>Galfar</strong> <strong>Engineering</strong> & <strong>Contracting</strong>SWOT analysisStrengths• Largest local contractor in Oman• Solid relationships and track record with the Omani government andPetroleum Development Oman• Offers construction services spanning the various market segments from oil &gas to roads & bridges and civil projectsWeaknesses• Almost all of <strong>Galfar</strong>'s backlog is restricted to the local market• Over-reliance on government works with limited contribution from the privatesector to the backlog• Low backlog/sales ratio compared to regional and global peers, implyingreduced future earnings visibilityOpportunities• Expand its business beyond Oman into other growth markets within the widerMENA and on the Indian sub-continent• Further diversification of revenue streams by pursuing more work within theinfrastructure and civil segmentsThreats• Increasingly competitive environment, deteriorating pricing power and abilityto win contracts• Eroding competitive advantage and loss of government support• High net debt position• High receivables past dueMarch 18th, 2010 18
<strong>Galfar</strong> <strong>Engineering</strong> & <strong>Contracting</strong>Financial analysis and forecastsRevenues falling<strong>Galfar</strong> generated <strong>OM</strong>R 410.3mn in FY 09 revenues (+13% YoY vs. <strong>OM</strong>R 363.0mn in FY08), an all-time high. However, most of this growth came on the back of governmentcontracts awarded to <strong>Galfar</strong> between 2005-2008 which in the midst of the crisis were reinvigoratedby the combination of a Keynesian push and the company's conclusion thatthese growing delays were placing it out of favour with government.2009 contract awardsdown 71% YoYWhile Omani private sector investments suffered during 2009, especially in real estate, thegovernment increased its spending and went ahead with several large scale infrastructureprojects. <strong>Galfar</strong>'s supposedly strong relationship with the government was expectedto convert into a healthy contribution to its backlog. Contrary to market expectations,<strong>Galfar</strong>'s new contracts awards in 2009 fell by a staggering 71.1% YoY to <strong>OM</strong>R 158mn.Going forward, we expect the challenging oil & gas construction market coupled withthe increasingly competitive general contracting environment and the market's growingdependence on the few but high value government contracts, to separate the marketwinners from the rest. The recent trend of high profile contract losses by <strong>Galfar</strong> to globalplayers (even when it was the lowest bidder) - fuel our doubts surrounding its ability to beamong the big winners. Medium-term growth seems unlikely and sustainability will be achallenging objective to achieve in our view.450,000400,000350,000<strong>Galfar</strong>'s revenue 2006-201262.6%410,275362,976374,915364,101336,29770%60%50%Revenue, <strong>OM</strong>R '000300,000250,000200,000150,000100,000164,492267,46435.7%13.0%-8.6%-2.9%-7.6%40%30%20%10%0%Revenue growth50,000-10%-2006 2007 2008 2009 2010E 2011E 2012ERevenue Revenue growthSource: <strong>Galfar</strong>, SHUAA Capital-20%While we expect <strong>Galfar</strong> in 2010 to continue reaping the benefits of the contractsamassed during the golden era between 2005 and 2008, the existing backlog will likelybe insufficient to sustain top-line growth despite our projected increase in new contractawards relative to 2009.Revenues decliningWith the current backlog significantly depleted by FY 10, the company is likely to see itslow backlog/sales ratio taking its toll on the FY 11 top line. We expect <strong>Galfar</strong> to record FY11 revenues of <strong>OM</strong>R 364.1mn, before declining down to <strong>OM</strong>R 336.3mn in FY 12, implyinga YoY decline of 2.9% and 7.6% respectively.Based on our forecasts, the existing backlog contribution will be 88% (<strong>OM</strong>R 329.2) of FY 10revenues with new contract awards producing the remainder (<strong>OM</strong>R 45.8mn) of our FY 10top-line forecast. Only 3% of FY 12 revenues will come from the current backlog.March 18th, 2010 19
<strong>Galfar</strong> <strong>Engineering</strong> & <strong>Contracting</strong><strong>OM</strong>R mn400350300250200<strong>Galfar</strong> revenues and current backlog depletion15010050-2010F 2011F 2012FRevenues from existing contracts Revenues from new contractsSource: <strong>Galfar</strong>, SHUAA CapitalOil & Gas contributiondecliningWe expect revenues from oil & gas to lose their top-line dominance to a growing shareof civil, roads & bridges and utility projects; segments that benefit from the Omanigovernment's increased spending and diversification plans toward a less oil dependanteconomy. We expect the oil & gas segment to contribute 15% of the top-line in FY 12,down from an estimated share of 36% in FY 09.Utility & Services17.6%<strong>Galfar</strong> FY 09 & 12 revenue breakdownIndia0.0%Oil & Gas36.0%Utility & Services23.3%India2.4%Oil & Gas15.3%Roads & Bridges23.4%Civil23.6%Source: <strong>Galfar</strong>, SHUAA CapitalRoads & Bridges22.7%Civil35.7%Gross profit recovering from the lows of FY 09Between 2005 and 2009, general contractors were being chased by developers toperform work on time when price was not a concern; the bargaining power wasin the hands of the contractors. Surprisingly, during that period <strong>Galfar</strong> was a clearunderperformer compared to UAE based contractors; together with MMG it made a netmargin decline versus a net increase for Arabtec and DSI.Comparative GPM table 2006-2009Company 2006 2007 2008 2009Arabtec Holding 12.7% 17.3% 15.3% 17.3%Drake & Scull International 16.3% 18.9% 18.7% 20.8%Mohammad Al Mojil Group 32.7% 36.4% 28.4% 15.5%Average of peers 20.6% 24.2% 20.8% 17.9%<strong>Galfar</strong> 15.2% 13.0% 10.0% 3.9%Source: SHUAA Capital, Company reportsThis reality is mainly attributed to the low margin, fixed price nature of <strong>Galfar</strong>'s mostnotable contracts during a period of rising building material costs and erodingoperational efficiency. Moreover, current market conditions have led to a morecompetitive contracting landscape with a shift in bargaining power from contractors toclients.March 18th, 2010 20
<strong>Galfar</strong> <strong>Engineering</strong> & <strong>Contracting</strong>A seemingly growing number of regional and international companies are chasingfewer contracts alongside the local contractors - leading to erosion in pricing power.Perhaps the most significant and telling setback in <strong>Galfar</strong>'s deteriorating performanceand descending standing with its largest local client, the government of Oman, was thecompany's failure to win the <strong>OM</strong>R 500mn Muscat Airport new terminal contract despitebeing the lowest bidder and the contractor with the longest track-record with the client.With <strong>Galfar</strong>'s historical margins below regional industry averages, the effect of reducedpricing power was more pronounced on this name than on other leading regionalcontractors. FY 09 gross margins declined to 3.9%, 608 bps below FY 08 numbers.Moreover, the company's quarterly margins too are in a downward spiral from 8.2% inQ1 09 all the way to 4.0% in Q3 09 before heading subzero in Q4 09.Margins suffer fromloss making projectsAccording to management, 2009 margins, especially those of Q4 09 suffered from thedelays, upgrades, revisions of scope and losses on the long-running Muscat expressway,without further details being provided. While this is true for 2009 and especially Q4 09,the trend has been heading south for four years now. Consequently, we are expecting theGPM distortion from the negative impact of the Muscat Expressway project to fade as itreaches completion in FY 10 - leading to a margin increase. However, we do not expectmargins to reach back to the FY 08 levels of 10% anytime soon.We forecast the GPM to increase from 3.9% in FY 09 up to 6.9% in FY 10 before stabilisingaround the 8.6% by FY 11.Gross profit, <strong>OM</strong>R '00040,00035,00030,00025,00020,00015,00010,0005,000-<strong>Galfar</strong>'s gross profit and GPM 2006-201236,36934,81515.2%31,44213.0%28,76425,06825,96810.0%8.6% 8.6%16,175 6.9%3.9%2006 2007 2008 2009 2010E 2011F 2012FGross profit Gross profit margin18%16%14%12%10%8%6%4%2%0%Revenue growthSource: <strong>Galfar</strong>, SHUAA CapitalMarch 18th, 2010 21
<strong>Galfar</strong> <strong>Engineering</strong> & <strong>Contracting</strong>EBITDAJust like with the 2006-2009 GPM comparison, <strong>Galfar</strong> and MMG stand out as the only twogeneral contractors in our coverage universe with a negative net EBITDA margin trendduring the period.EBITDA, <strong>OM</strong>R '00050,00045,00040,00035,00030,00025,00020,00015,00010,0005,000-Comparative EBITDA margin table 2006-2009Company 2006 2007 2008 2009Arabtec Holding 10.64% 15.55% 14.51% 16.09%Drake & Scull International 13.4% 14.7% 12.1% 15.3%Mohammad Al Mojil Group 27.6% 32.7% 25.4% 17.4%Average of peers 17.2% 21.0% 17.3% 16.3%<strong>Galfar</strong> 17.1% 15.1% 12.7% 7.3%Source: SHUAA Capital, Company reportsSelling, general and administrative (SG&A) expenses are expected to remain at currentlevels, c. 2.1-2.3% of revenues. The partial GPM recovery from FY 09 onwards coupled withthe expected stability in SG&A expenses is forecasted to lead EBITDA up to <strong>OM</strong>R 40.0mn in2010, a strong 34.6% YoY growth. Moving forward, the continued recovery in gross marginwill lead EBITDA to <strong>OM</strong>R 47.0mn in FY 11 and <strong>OM</strong>R 44.7mn by FY 12-end.While the GPM is not expected to reach back to the FY 08 levels the EBITDA margin will,mainly on the reversal of the disproportionately high depreciation expenses as revenuesdecline.<strong>Galfar</strong>'s EBITDA and EBITDA margin 2006-201228,09617.1%40,48815.1%Source: <strong>Galfar</strong>, SHUAA Capital45,99212.7%29,7567.3%40,04610.7%46,96012.9%44,6512006 2007 2008 2009 2010E 2011E 2012EEBITDA EBITDA margin50%45%40%35%30%13.3% 25%20%15%10%5%0%EBITDA marginNet profits reach bottom in 2009Net profits growthin 2010<strong>Galfar</strong>'s bottom line expanded 38.2% between 2006 and 2008 from <strong>OM</strong>R 16.6mn to <strong>OM</strong>R22.9mn. This strong growth came to an abrupt end in 2009 which saw <strong>Galfar</strong> nosedivefrom its most profitable year ever in FY 08 to its all time low of <strong>OM</strong>R 3.8mn in FY 09 asmargins plunged and Q4 09 witnessed the company's first quarterly loss (<strong>OM</strong>R -5.9mn inQ4 09).Net profit <strong>OM</strong>R '000<strong>Galfar</strong>'s Net profit and net profit margin 2006-201225,00022,15622,91320,00019,40916,57617,78915,00013,76110,0005,0008.3%3,83110.1%6.3%3.7%5.3% 5.3%0.9%-2006 2007 2008 2009 2010E 2011E 2012ENet profit Net profit margin50%45%40%35%30%25%20%15%10%5%0%Net profit marginSource: <strong>Galfar</strong>, SHUAA CapitalMarch 18th, 2010 22
<strong>Galfar</strong> <strong>Engineering</strong> & <strong>Contracting</strong>We expect <strong>Galfar</strong>'s bottom line to witness a gradual improvement over the comingyears as margins recover from their 2009 lows despite declining revenues. While we areprojecting revenues to decline by 8.6% and 2.9% in FY 10 and FY 11 respectively on theback of backlog depletion, net profits are expected to grow by around 3.6x in FY 10 anda further 41.0% YoY growth in FY 11 to reach <strong>OM</strong>R 13.8mn and <strong>OM</strong>R 19.4mn respectively.This discrepancy between top-line decline and bottom-line growth is mainly a result ofa GPM recovery coupled with our expectation of stable SG&A expenses offsetting thedecline in revenues.The net profit margin (NPM) expansion is expected to be slower than that of the GPM andEBITDA due to the relatively high net interest expense - leading it to land on 3.7% and5.3% in FY 10 and FY 11 respectively by adding 274 bps and 166 bps YoY.High net debt, most leveraged contractor in the regionNet debt of <strong>OM</strong>R0.31/shareAs of FY 09-end, <strong>Galfar</strong> held <strong>OM</strong>R 4.56mn in cash and cash equivalents against which thecompany had <strong>OM</strong>R 98.5mn in debt. As a result, the net debt position was <strong>OM</strong>R 94mn,equivalent to <strong>OM</strong>R 0.31 per share.604020-<strong>Galfar</strong>'s cash and debt 2006-20121318 145 52137<strong>OM</strong>R mn(20)(40)(23)(60)(37)(36) (55)(42)(80)(65)(100)(84)(79)(89) (86)(93) (99) (94)(120)(108)2006 2007 2008 2009 2010E 2011E 2012EDebt Cash Net cash (debt)Source: <strong>Galfar</strong>, SHUAA CapitalTotal debt-to-equity reached 120% as of FY09-end, almost inline with FY 08 leverage ratioof 129%. Consequently, <strong>Galfar</strong> is the most leveraged contractor in our coverage universe.Key contractors' net cash (debt) and leverageCompanyNet cash (debt) Debt-to-Equityper share (USD)Arabtec Holding (0.07) 35%Drake & Scull International 0.10 32%Mohammad Al Mojil (0.88) 25%<strong>Galfar</strong> <strong>Engineering</strong> (0.81) 120%Source: SHUAA Capital, Company reportsCash, debt and equity figures corresponds to the last reported figuresMarch 18th, 2010 23
<strong>Galfar</strong> <strong>Engineering</strong> & <strong>Contracting</strong>Cash conversion cycle stabilisingThe past years saw <strong>Galfar</strong> enjoying a significant working capital advantage; receivableswere collected ahead of payments to suppliers and subcontractors. The strong ties withthe government which <strong>Galfar</strong> had, presumably allowed the company to collect largeupfront payments. However, this advantage began to diminish in FY 08.<strong>Galfar</strong>'s cash conversion cycle 2006-2012604642 40 42402620Days-(20)(16)(40)(60)(80)(61)2006 2007 2008 2009 2010E 2011E 2012ESource: <strong>Galfar</strong>, SHUAA CapitalReceivables past due up 88% in 2009 - A major concernReceivables pastdue deterioratingAs of 2009 year-end, <strong>Galfar</strong> had <strong>OM</strong>R 159.3mn of trade receivables, out of which 63.5% arepast due. The value of trade receivables with more than 270 days past due, amounts to<strong>OM</strong>R 28.4mn and17.8% of the total - a major concern in our view.The fact that the 270 day bracket increased by 88% YoY when revenues increased by arelatively low 13% is a major source of concern on the recoverability of this money. Giventhis deteriorating receivables position, we believe that it is highly likely that <strong>Galfar</strong> willbook impairments on receivables in the future. As a result, we have opted to address thisconcern in our four valuation scenarios, by discounting potential impairments directlyfrom the fair value. Our impairment assumptions range from <strong>OM</strong>R 10-28.4mn, dependingon scenario. More on this is available in our valuation section.March 18th, 2010 24
<strong>Galfar</strong> <strong>Engineering</strong> & <strong>Contracting</strong>ValuationInitiating with a SELLrecommendationWe initiate coverage on <strong>Galfar</strong> <strong>Engineering</strong> & <strong>Contracting</strong> (<strong>Galfar</strong>) with a SELLrecommendation based on a fair value target of <strong>OM</strong>R 0.435 per share, implying a 14.8%downside potential to the current price of <strong>OM</strong>R 0.511 per share.Valuation Fair value Weighting Weighted fairvalue/shareDCF 0.352 70% 0.25Relative 0.630 30% 0.19SC fair value 100% 0.435Current price 0.511Upside/(downside) -14.8%Source: SHUAA CapitalFair value basedon two methodsOur fair value target is a weighted average of two valuation exercises. The first is a scenariodriven three-stage DCF valuation based on our financial projections. The second methodis a relative valuation approach based on the average P/E 10, EV/EBITDA 10 and P/backlogmultiple for a group of comparable companies. Our fair value target was based on SHUAACapital's standard weighted average: a 70% weighting allocated to our DCF value and theremaining 30% for the relative valuation.Scenario driven three-stage DCFDCF fair value is<strong>OM</strong>R 0.352/shareOur three-stage DCF valuation of <strong>Galfar</strong>, which was subjected to four different scenarios,produced a scenario-weighted fair value target of <strong>OM</strong>R 0.352 per share - implying a 31.1%downside potential to the latest closing price. The DCF was based on a ten year forecastperiod and a terminal value. The weighted average cost of capital 12 (WACC) used was 11.0%.<strong>Galfar</strong>'s scenario weighted DCF fair valueScenarioNet cash/sharePV of FCF/shareTV/shareFV/share Impaired Impairment/before receivables shareimpaired (|<strong>OM</strong>R mn)receivablesFV Weighting Weightedfv/shareDoomsday (0.31) 0.30 0.10 0.091 28 (0.09) (0.004) 10% (0.00)% fair valuecontribution-344.4% 334.4% 110.0% 100.0%Bear (0.31) 0.37 0.19 0.249 20 (0.07) 0.183 30% 0.05% fair valuecontribution-125.6% 150.2% 75.4% 100.0%Base (0.31) 0.46 0.32 0.471 15 (0.05) 0.421 50% 0.21% fair valuecontribution-66.6% 98.1% 68.5% 100.0%Bull (0.31) 0.63 0.59 0.909 10 (0.03) 0.875 10% 0.09% fair valuecontribution-34.5% 69.7% 64.8% 100.0%Fair value/share 0.352Upside/(downside)-31.1%Source: SHUAA CapitalValuation scenariossubjected to impairmentsTo address the growing concerns surrounding the issue of receivables collectionsstemming from clients' payments delays, we subjected our DCF valuation to assumptionson impairments of receivables, a key risk facing <strong>Galfar</strong> and the contracting industry ingeneral. As of 2009 year-end, <strong>Galfar</strong> had <strong>OM</strong>R 101.2mn of receivables past due out ofwhich <strong>OM</strong>R 28.4mn is more than 270 days past due. The 270 days age bracket is up88% YoY and represents 17.8% of 2009 trade receivables. We assumed impairmentson receivables past due ranging between <strong>OM</strong>R 10-28.4mn (negative <strong>OM</strong>R 0.03-0.09per share). The assumed impairment per share was subsequently subtracted from thescenario-specific fair value.2 The WACC was based on a cost of equity of 12% and a cost of debt of 8%. The cost of equity was derived through a risk free rate of 6%, an equityrisk premium of 5% and an industry beta of 1.2. 2March 18th, 2010 26
<strong>Galfar</strong> <strong>Engineering</strong> & <strong>Contracting</strong>Doomsday scenarioWith revenues peaking in FY 09, the doomsday scenario assumes a prolonged declinein revenues from FY 10 and going forward fuelled by an extended contraction in oil &gas investments, saturation of mega infrastructure investments by the government anda sharper rise in competition leading to lower contract awards; by FY 19, revenues areprojected to be down c.65% compared to 2009. Under this scenario, net profits will makea rebound from the lows of FY 09, on the back of the fading contribution of the lossmaking Muscat Expressway. By FY 19, <strong>Galfar</strong>'s bottom line is projected to be c. 55% higherthan the distorted FY 09 figures.This scenario assumes that <strong>OM</strong>R 120mn would be awarded to <strong>Galfar</strong> in FY 10 followed by<strong>OM</strong>R 142.5mn in FY 11 and <strong>OM</strong>R 127.5mn in FY 12. Together, these new awards amountto half of the backlog additions in our base scenario.The projected compounded annual growth rate (CAGR) for revenues between 2009 and2019 is negative 9.9%. With margins recovering over the forecast period relative to 2009,the gross profit and EBITDA CAGR decline is much less pronounced at a negative 3.9%and 5.0% respectively. Under this scenario, net profits are forecast to stay above the 2009-lows and deliver a CAGR of 4.4% over the period backed by a higher GPM, losses from AlKhalij subsiding and a lower SG&A/gross profits ratio.Doomsday wipesout equity valueThis scenario assumes <strong>OM</strong>R 28.4mn (<strong>OM</strong>R 0.09 per share) of potential impairments onreceivables and no terminal growth rate. We believe that the company's current net debtposition coupled with a full impairment of existing past dues will wipe out the equity value.Doomsday scenario CAGR's Stage 1 Stage 2 Stage 3CAGR 2009-2012 2012-2014 2014-2019 2009-2019 2010-2019Revenue -25.0% -5.5% -1.3% -9.9% -9.4%Gross profit -6.8% -5.5% -1.4% -3.9% -6.9%EBITDA -10.7% -5.3% -1.4% -5.0% -6.9%Net profit 19.8% -1.8% -1.6% 4.4% -5.0%Source: <strong>Galfar</strong>, SHUAA CapitalBear scenarioWhile the bear scenario assumes deterioration in <strong>Galfar</strong>'s revenue generating ability, itis more moderate than the doomsday scenario. In the bear scenario, we expect <strong>Galfar</strong>to secure <strong>OM</strong>R 180mn worth of new contracts in FY 10 followed by <strong>OM</strong>R 213.75mn and<strong>OM</strong>R 191.25mn in FY 11 and FY 12 respectively. The cumulative value of awards for theperiod is <strong>OM</strong>R 585.0mn, 1.5x our doomsday scenario additions.Revenue CAGR for the period between the peak in 2009 and FY 19 is negative 5.6%. Withmargins recovering over our forecast period, gross and net profits CAGR's will turn greenat 1.4% and 12.8% respectively over 2009-2019. Bear case FY 19 EBITDA would be inlinewith FY 09 levels yet still 35.6% lower than FY 08 highs. The company's net profits in FY 19will still be 44.2% lower than FY 08 levels despite growing more than three times from thelows of FY 09.Bear case fair valueat <strong>OM</strong>R 0.183This scenario assumes <strong>OM</strong>R 20mn (<strong>OM</strong>R 0.07 per share) in impairments on receivables anda 1.0% terminal growth rate returning a scenario-specific fair value of <strong>OM</strong>R 0.183 per share,implying a downside potential of 64.2% to the last close.Bear scenario CAGR's Stage 1 Stage 2 Stage 3CAGR 2009-2012 2012-2014 2014-2019 2009-2019 2010-2019Revenue -14.7% -3.8% -0.3% -5.6% -4.9%Gross profit 8.2% -3.8% -0.4% 1.4% -2.5%EBITDA 3.0% -3.7% -0.3% -0.1% -2.4%Net profit 45.5% 0.2% 1.5% 12.8% 1.2%Source: <strong>Galfar</strong>, SHUAA CapitalMarch 18th, 2010 27
<strong>Galfar</strong> <strong>Engineering</strong> & <strong>Contracting</strong>Base scenarioThe base scenario, which is the basis of all sections in our report and has the highestweighting in our valuation, assumes the revenue decline witnessed in the previousscenarios ends in FY 14 and that a recovery starts the following year. However, FY 19revenues are expected to remain 17.9% short of the FY 09 levels.Here, we expect <strong>Galfar</strong> to capture <strong>OM</strong>R 240mn worth of new awards in FY 10 followed by<strong>OM</strong>R 285mn and <strong>OM</strong>R 255mn in FY 11 and FY 12 respectively. Despite coming short ofthe <strong>OM</strong>R 547mn record additions of FY 08, these are far more than the <strong>OM</strong>R 158mn wonin FY 09.Base case CAGR for revenues between the peak of 2009 and 2019 is negative 1.9%. Moresignificantly, EBITDA and net profits CAGR are 4.2% and 19.1% respectively, powered byimproved margins relative to the 2009 margins. FY 09 margins suffered especially in thesecond half of the year on the back of the low margin on the Muscat Expressway project.Under this scenario, FY 19 EBITDA is projected to be 50.5% higher than FY 09, but stay2.6% below the FY 08 peak. By 2019, net profit is expected to be more than five times FY09 numbers, yet still down 4.4% from FY 08 highs.Bear case fair valueat <strong>OM</strong>R 0.421With a terminal growth of 2.0% and <strong>OM</strong>R 15mn (<strong>OM</strong>R 0.05 per share) in impairments onreceivables, this scenario returns a fair value per share of <strong>OM</strong>R 0.421 - implying a 17.7%downside to the current share price of <strong>Galfar</strong>.Base scenario CAGR's Stage 1 Stage 2 Stage 3CAGR 2009-2012 2012-2014 2014-2019 2009-2019 2010-2019Revenue -6.4% -1.5% 0.7% -1.9% -1.2%Gross profit 21.2% -1.5% 0.6% 5.9% 1.2%EBITDA 14.5% -1.4% 0.6% 4.2% 1.3%Net profit 66.8% 2.6% 3.2% 19.1% 5.3%Source: <strong>Galfar</strong>, SHUAA CapitalBull scenarioBeing the most optimistic of our scenarios, bull revenues are projected to exceed theFY 09 peak and deliver a CAGR for the period between 2009 and 2019 of 3.1%. Thisforecasted bull revenue growth, coupled with the expected increase in margins fromthe suppressed 2009 levels lead to an EBITDA and net profit CAGR of 9.9% and 26.7%respectively over the same period.Our assumptions on backlog additions imply <strong>OM</strong>R 360.0mn in new contract wins in FY 10followed by <strong>OM</strong>R 427.5mn in FY 11 and <strong>OM</strong>R 382.5mn in FY 12. While this annual level ofbacklog additions is still short of the <strong>OM</strong>R 547mn clinched in FY 08, it is far more than the<strong>OM</strong>R 158mn won in FY 09. In cumulative terms, for this three year period, we project 50%more additions than our base case.Bear case fair valueat <strong>OM</strong>R 0.875When applying this scenario, <strong>Galfar</strong>'s FY 19 EBITDA expands by 156.9% compared to FY 09and exceeds the FY 08 peak by a strong 66.2%. Meanwhile, the bottom line manages tosurpass FY 08 record levels by 78.6% and expand 11x compared to FY 09 numbers.To account for the potential impairment of receivables, we discount <strong>OM</strong>R 10mn (<strong>OM</strong>R0.03 per share) from <strong>Galfar</strong>'s equity value. We apply a higher terminal growth rate of 2.5%to reach a fair value per share of <strong>OM</strong>R 0.875 per share - implying an upside potential of71.3% from the current price.Bull scenario CAGR's Stage 1 Stage 2 Stage 3CAGR 2009-2012 2012-2014 2014-2019 2009-2019 2010-2019Revenue 6.8% 1.1% 1.7% 3.1% 3.8%Gross profit 40.9% 1.1% 1.6% 12.0% 6.0%EBITDA 32.3% 1.1% 1.7% 9.9% 6.1%Net profit 97.8% 5.0% 4.6% 26.7% 10.4%Source: <strong>Galfar</strong>, SHUAA CapitalMarch 18th, 2010 28
<strong>Galfar</strong> <strong>Engineering</strong> & <strong>Contracting</strong>Relative valuationPeer based valuationis <strong>OM</strong>R 0.630/shareOur weighted relative valuation method returns an equity value of <strong>OM</strong>R 0.630 per sharederived from the median FY 10 P/E, EV/EBITDA and P/backlog of selected peers andsubjected to a scenario-based impairment of receivables past due.<strong>Galfar</strong>'s peersDetail Country Market Cap (USD mn) P/E 2010E EV/EBITDA 2010E P/backlogSaipem Italy 15,605 15.3 6.3 0.6Technip France 8,069 14.7 5.1 0.7Petrofac UK 6,301 13.6 4.5 0.5Arabtec Holding PJSC* UAE 736 4.4 3.0 0.2Mohammad Al Mojil KSA 763 23.4 10.2 1.2Drake & Scull International LLC UAE 526 8.1 4.8 0.5Samsung <strong>Engineering</strong> South Korea 4,192 11.6 8.1 0.3GS <strong>Engineering</strong> South Korea 4,108 8.9 6.7 0.2Daewoo <strong>Engineering</strong> South Korea 3,230 11.5 11.2 0.1Larsen & Tubro India 20,467 23.0 17.3 1.0Carillion UK 1,895 8.0 5.4 0.1Strabag Austria 2,916 14.0 4.6 0.2Average 13.0 7.3 0.5Source: Reuters, SHUAA Capital, Company reportsNote: Prices as of 15.03.2010, *= backlog used for Arabtec excludes the Russian contractThe peer group we used includes mainly general construction companies and some EPCcontractors which are either GCC-based or have significant exposure to the region ingeneral and Oman in particular. <strong>Galfar</strong>'s operations within the construction industry rangefrom civil and roads contracting to oil, gas and utilities engineering services. In our view,this justifies MMG, Arabtec and DSI as regional peers. Other international peers such asLarsen & Tubro, Carillion and Strabag have either established subsidiaries or joint venturesoperating in the Omani contracting market.<strong>Galfar</strong>'s weighted relative valuation, post impairmentValuation post impairment Fair value/share Weighting Weighted fair value/shareP/E 2010E 0.54 33% 0.18EV/EBITDA 2010E 0.62 33% 0.21P/backlog 0.73 33% 0.24SC FV per share 0.630Last close 0.511Upside/(downside) 23.2%Source: SHUAA CapitalMarch 18th, 2010 29
<strong>Galfar</strong> <strong>Engineering</strong> & <strong>Contracting</strong>Upside to our valuationThe upside to our valuation could come from a firmer and faster recovery in margins thanwe have already anticipated. <strong>Galfar</strong> was hampered by a drastic decline that saw its grossmargins dive from 15% in FY 06 to 3.9% in FY 09.In light of the slowdown in the oil & gas market and the subsequent drop in relatedspending on new capacity, <strong>Galfar</strong> is making an aggressive push into the civil segmentwhere the government's expansionary fiscal policy is in action. However, recent tenderingset-backs on government contracts including the loss of the Muscat International AirportExpansion Package, despite being the lowest bidder - implies <strong>Galfar</strong> could be losing thebenefit of preferential government treatment at a time when international competitionis growing in Oman. Should <strong>Galfar</strong> prove these concerns misplaced and demonstrate itsability to win major government contracts, allowing it to offset the declining potentialin the oil & gas field and exceed our expectations on backlog additions, then this wouldprovide additional upside.While <strong>Galfar</strong> is seeking geographic diversification beyond Oman, there has been littleprogress beyond the small Indian contracts (only 0.6% of its backlog). In contrastcompanies like Arabtec and DSI have made successful and sizeable market penetrationsin the rest of the Gulf and beyond. Should <strong>Galfar</strong> be able to expand in India and eventuallyalso into its two other stated target markets of Abu Dhabi and Libya in a meaningful form,then this could have a very positive effect on our valuation.Risks to our valuationWhile we have accounted for the growing international competition within the Omaniconstruction market, mainly by assuming that EBITDA and net margins will never recoverback to the 2007 levels let alone those of 2006 - in our view, it is not unlikely that thegrowing competition and seemingly deteriorating competitive advantage of <strong>Galfar</strong> couldlead it to engage in a detrimental price war to maintain market share.A further deterioration in cash collection, mainly from private clients, could potentiallylead to higher impairments of receivables than we have already assumed. Our concernssurrounding this matter are rising, especially given that <strong>Galfar</strong>'s receivables past due over270 days increased by some 88% YoY to reach <strong>OM</strong>R 28.4mn. While our various valuationscenarios account for impairments, a further deterioration of the past due receivablesposition is highly plausible in our opinion.March 18th, 2010 30
<strong>Galfar</strong> <strong>Engineering</strong> & <strong>Contracting</strong>FinancialsConsolidated income statement (<strong>OM</strong>R '000)Year to December 2007 2008 2009 2010E 2011E 2012ERevenue 267,464 362,976 410,275 374,915 364,101 336,297Cost of sales (232,649) (326,607) (394,100) (348,947) (332,659) (307,533)Gross profit 34,815 36,369 16,175 25,968 31,442 28,764Hire gross profit (767) (666) (505) (300) (146) -Selling, general & administrative expenses (7,120) (7,882) (8,751) (8,117) (8,002) (7,653)EBITDA 40,488 45,992 29,756 40,046 46,960 44,651EBIT 26,928 27,821 6,919 17,551 23,294 21,111Other income, net 1,697 2,356 1,993 1,875 1,821 1,681Net interest (2,956) (3,978) (4,304) (4,177) (3,599) (3,013)Impairment of goodwill of subsidiary - - (165) - - -Net income before tax 25,670 26,199 4,444 15,249 21,515 19,779Tax (3,339) (3,090) (690) (1,628) (2,181) (2,003)Minority interest (175) (196) 76 140 75 13Net profit attributable to shareholders 22,156 22,913 3,831 13,761 19,409 17,789EPS (<strong>OM</strong>R) 0.07 0.08 0.01 0.05 0.06 0.06Source: <strong>Galfar</strong>, SHUAA CapitalConsolidated balance sheet (<strong>OM</strong>R '000)Year to December 2007 2008 2009 2010E 2011E 2012EInventories 21,762 46,295 23,245 28,681 27,342 25,277Trade and other receivables 96,386 102,747 122,122 102,716 99,754 92,136Work in progress - 47,740 45,450 41,087 39,902 36,854Prepayments, advances and other receivables 9,030 13,588 11,968 11,299 10,973 10,135Cash and cash equivalents 17,644 14,302 4,556 4,780 20,852 37,335Total current assets 144,821 224,672 207,340 188,563 198,822 201,738Net Property, plant equipment 100,607 130,061 134,402 137,757 135,882 130,787Goodwill 275 275 - - - -Investment in associate - - 1,067 1,067 1,067 1,067Available for sale investments 145 145 145 145 145 145Retentions Receivable 11,668 15,993 25,300 20,543 19,951 17,506Total non-current assets 112,695 146,474 160,913 159,512 157,044 149,505Total assets 257,516 371,146 368,254 348,075 355,866 351,242Bank borrowings 14,288 38,874 22,962 21,077 20,469 18,796Short-term loans 4,200 17,672 22,500 19,321 18,764 17,229Term loans - current portion 16,683 14,640 20,796 19,321 18,764 17,229Current portion of finance lease liability - 3,957 2,648 2,635 2,559 2,349Trade and other payables 105,873 136,930 159,909 133,843 127,595 117,958Provision for taxation 1,521 878 - - - -Total current liabilities 142,565 212,951 228,817 196,197 188,151 173,562Term loans 19,956 27,078 26,729 23,712 23,028 21,145Provision for employees' end of service indemnity 3,905 5,182 6,147 6,792 7,254 7,485Deferred tax liability 4,314 6,527 7,220 7,857 8,476 9,048Creditors for purchase of PP&E 10,419 5,834 3,992 4,780 4,557 5,055Non-current portion of finance lease liability - 5,333 2,897 2,635 2,559 2,349Advances on contracts 5,409 24,184 9,785 14,340 13,671 12,638Total non-current liabilities 44,003 74,138 56,770 60,117 59,545 57,721Total liabilities 186,569 287,089 285,587 256,313 247,696 231,283Total shareholders equity 70,416 83,329 82,016 91,110 107,519 119,308Total equity 70,947 84,056 82,667 91,761 108,170 119,959Total liabilities and equity 257,516 371,146 368,254 348,075 355,866 351,242Source: <strong>Galfar</strong>, SHUAA CapitalMarch 18th, 2010 31
<strong>Galfar</strong> <strong>Engineering</strong> & <strong>Contracting</strong>Key ratiosYear to December 2007 2008 2009 2010E 2011E 2012EGrowthRevenues 62.6% 35.7% 13.0% -8.6% -2.9% -7.6%Gross profit 38.9% 4.5% -55.5% 60.5% 21.1% -8.5%EBITDA 44.1% 13.6% -35.3% 34.6% 17.3% -4.9%Net profit 33.7% 3.4% -83.3% 259.2% 41.0% -8.3%Equity 132.7% 18.5% -1.7% 11.0% 17.9% 10.9%Assets 48.5% 44.1% -0.8% -5.5% 2.2% -1.3%Margins & ProfitabilityGross profit margin 13.0% 10.0% 3.9% 6.9% 8.6% 8.6%EBITDA margin 15.1% 12.7% 7.3% 10.7% 12.9% 13.3%Net profit margin 8.3% 6.3% 0.9% 3.7% 5.3% 5.3%RoAE 44.1% 29.8% 4.6% 15.9% 19.5% 15.7%RoAA 10.3% 7.3% 1.0% 3.8% 5.5% 5.0%LeverageNet cash (debt) (<strong>OM</strong>R '000) (37,483) (93,253) (93,977) (83,921) (65,291) (41,763)Total debt to equity 78.3% 129.1% 120.1% 97.4% 80.1% 66.3%ValuationEPS 0.07 0.08 0.01 0.05 0.06 0.06BVPS 0.24 0.28 0.28 0.31 0.36 0.40P/BV 2.2 1.8 1.9 1.7 1.4 1.3P/E 6.9 6.7 40.0 11.1 7.9 8.6Fair value based P/E 5.9 5.7 34.1 9.5 6.7 7.3Dividend yield 6.52% 3.26% 1.96% 1.96% 3.91% 3.91%FCF yield -22.0% -37.0% 23.2% 7.2% 15.4% 20.1%LiquidityCash conversion cycle (15.5) 26.1 45.7 41.5 40.4 41.8Cash ratio 0.12 0.07 0.02 0.02 0.11 0.22Source: <strong>Galfar</strong>, SHUAA CapitalMarch 18th, 2010 32
This page was intentionally left blank
This page was intentionally left blank
<strong>Galfar</strong> <strong>Engineering</strong> & <strong>Contracting</strong>ResearchEconomicsKhatija Haque+9714 3199 752khaque@shuaacapital.comStrategyAhmad M. Shahin+9714 3199 742ashahin@shuaacapital.comBanks and DiversifiedFinancialsSofia El Boury+9714 3199 716selboury@shuaacapital.comGhida Obeid+9714 4283 536gobeid@shuaacapital.comPetrochemicalsLaurent-Patrick Gally+9714 3199 712lgally@shuaacapital.comReal Estate and ConstructionRoy Cherry+9714 3199 767rcherry@shuaacapital.comTaher Safieddine+9714 3199 715tsafieddine@shuaacapital.comTelecommunications, Mediaand TechnologySimon Simonian, CFA+9714 3199 763ssimonian@shuaacapital.comConsumer and RetailLaurent-Patrick Gally+9714 3199 712lgally@shuaacapital.comTransportation and LogisticsKareem Z. Murad+9714 3199 757kmurad@shuaacapital.comJafar Shami+9714 3199 714jshami@shuaacapital.comHeavy Industries and UtilitiesJessica Estefane+9714 3199 834jestefane@shuaacapital.comHala Fares+9714 3199 713hfares@shuaacapital.comTechnical AnalysisAdel Merheb+9174 3199 793amerheb@shuaacapital.comDataAhmad M. Shahin+9714 3199 742ashahin@shuaacapital.comNicole Chamat+961 1 974 479nchamat@shuaacapital.comDesignJovan Ruseski+9714 3199 759jruseski@shuaacapital.comClient Services:800 SHUAA (74822) – UAE only800 124 7482 - Saudi Arabia only+971 (4) 319 9603 – Internationalclientservices@shuaacapital.comSales Trading Desk:+971 (4) 319-9700+971 (2) 409-0777tradingdesk@shuaacapital.comMarch 18th, 2010 35
This page was intentionally left blankThis document has been issued by SHUAA Capital for informational purposes only. This document is not and should not beconstrued as an offer or the solicitation of an offer to purchase or subscribe or sell any investment or subscribe to any investmentmanagement or advisory service. This document is not intended as investment advice as to the value of any securities or as to theadvisability of investing in, purchasing, or selling any security. SHUAA Capital has based this document on information obtainedfrom sources it believes to be reliable. It makes no guarantee, representation or warranty as to its accuracy or completeness andaccepts no responsibility or liability in respect thereof or for any reliance placed by any person on such information. All opinionsexpressed herein are subject to change without notice. This document may not be reproduced or circulated without the priorwritten consent of SHUAA Capital psc.


