

Galfar Engineering & Contracting (GECS.OM)
Galfar Engineering & Contracting (GECS.OM)
Galfar Engineering & Contracting (GECS.OM)

You also want an ePaper? Increase the reach of your titles
YUMPU automatically turns print PDFs into web optimized ePapers that Google loves.
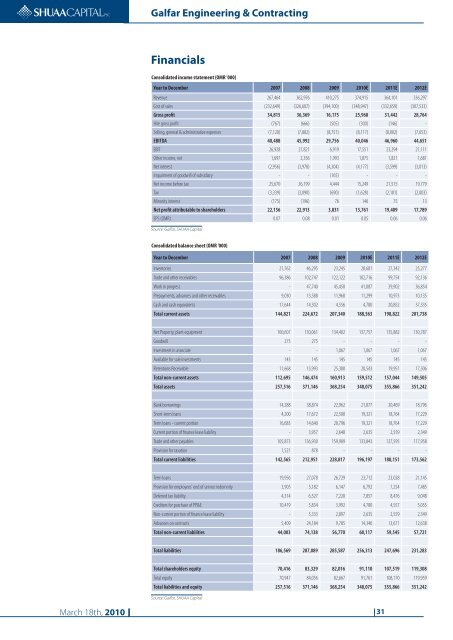
<strong>Galfar</strong> <strong>Engineering</strong> & <strong>Contracting</strong>FinancialsConsolidated income statement (<strong>OM</strong>R '000)Year to December 2007 2008 2009 2010E 2011E 2012ERevenue 267,464 362,976 410,275 374,915 364,101 336,297Cost of sales (232,649) (326,607) (394,100) (348,947) (332,659) (307,533)Gross profit 34,815 36,369 16,175 25,968 31,442 28,764Hire gross profit (767) (666) (505) (300) (146) -Selling, general & administrative expenses (7,120) (7,882) (8,751) (8,117) (8,002) (7,653)EBITDA 40,488 45,992 29,756 40,046 46,960 44,651EBIT 26,928 27,821 6,919 17,551 23,294 21,111Other income, net 1,697 2,356 1,993 1,875 1,821 1,681Net interest (2,956) (3,978) (4,304) (4,177) (3,599) (3,013)Impairment of goodwill of subsidiary - - (165) - - -Net income before tax 25,670 26,199 4,444 15,249 21,515 19,779Tax (3,339) (3,090) (690) (1,628) (2,181) (2,003)Minority interest (175) (196) 76 140 75 13Net profit attributable to shareholders 22,156 22,913 3,831 13,761 19,409 17,789EPS (<strong>OM</strong>R) 0.07 0.08 0.01 0.05 0.06 0.06Source: <strong>Galfar</strong>, SHUAA CapitalConsolidated balance sheet (<strong>OM</strong>R '000)Year to December 2007 2008 2009 2010E 2011E 2012EInventories 21,762 46,295 23,245 28,681 27,342 25,277Trade and other receivables 96,386 102,747 122,122 102,716 99,754 92,136Work in progress - 47,740 45,450 41,087 39,902 36,854Prepayments, advances and other receivables 9,030 13,588 11,968 11,299 10,973 10,135Cash and cash equivalents 17,644 14,302 4,556 4,780 20,852 37,335Total current assets 144,821 224,672 207,340 188,563 198,822 201,738Net Property, plant equipment 100,607 130,061 134,402 137,757 135,882 130,787Goodwill 275 275 - - - -Investment in associate - - 1,067 1,067 1,067 1,067Available for sale investments 145 145 145 145 145 145Retentions Receivable 11,668 15,993 25,300 20,543 19,951 17,506Total non-current assets 112,695 146,474 160,913 159,512 157,044 149,505Total assets 257,516 371,146 368,254 348,075 355,866 351,242Bank borrowings 14,288 38,874 22,962 21,077 20,469 18,796Short-term loans 4,200 17,672 22,500 19,321 18,764 17,229Term loans - current portion 16,683 14,640 20,796 19,321 18,764 17,229Current portion of finance lease liability - 3,957 2,648 2,635 2,559 2,349Trade and other payables 105,873 136,930 159,909 133,843 127,595 117,958Provision for taxation 1,521 878 - - - -Total current liabilities 142,565 212,951 228,817 196,197 188,151 173,562Term loans 19,956 27,078 26,729 23,712 23,028 21,145Provision for employees' end of service indemnity 3,905 5,182 6,147 6,792 7,254 7,485Deferred tax liability 4,314 6,527 7,220 7,857 8,476 9,048Creditors for purchase of PP&E 10,419 5,834 3,992 4,780 4,557 5,055Non-current portion of finance lease liability - 5,333 2,897 2,635 2,559 2,349Advances on contracts 5,409 24,184 9,785 14,340 13,671 12,638Total non-current liabilities 44,003 74,138 56,770 60,117 59,545 57,721Total liabilities 186,569 287,089 285,587 256,313 247,696 231,283Total shareholders equity 70,416 83,329 82,016 91,110 107,519 119,308Total equity 70,947 84,056 82,667 91,761 108,170 119,959Total liabilities and equity 257,516 371,146 368,254 348,075 355,866 351,242Source: <strong>Galfar</strong>, SHUAA CapitalMarch 18th, 2010 31


