

Galfar Engineering & Contracting (GECS.OM)
Galfar Engineering & Contracting (GECS.OM)
Galfar Engineering & Contracting (GECS.OM)

Create successful ePaper yourself
Turn your PDF publications into a flip-book with our unique Google optimized e-Paper software.
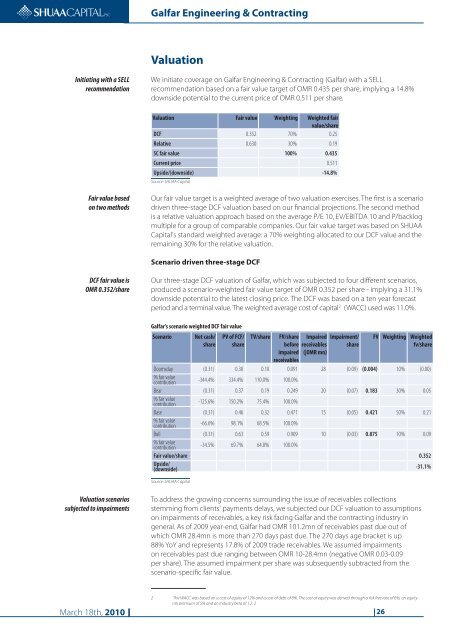
<strong>Galfar</strong> <strong>Engineering</strong> & <strong>Contracting</strong>ValuationInitiating with a SELLrecommendationWe initiate coverage on <strong>Galfar</strong> <strong>Engineering</strong> & <strong>Contracting</strong> (<strong>Galfar</strong>) with a SELLrecommendation based on a fair value target of <strong>OM</strong>R 0.435 per share, implying a 14.8%downside potential to the current price of <strong>OM</strong>R 0.511 per share.Valuation Fair value Weighting Weighted fairvalue/shareDCF 0.352 70% 0.25Relative 0.630 30% 0.19SC fair value 100% 0.435Current price 0.511Upside/(downside) -14.8%Source: SHUAA CapitalFair value basedon two methodsOur fair value target is a weighted average of two valuation exercises. The first is a scenariodriven three-stage DCF valuation based on our financial projections. The second methodis a relative valuation approach based on the average P/E 10, EV/EBITDA 10 and P/backlogmultiple for a group of comparable companies. Our fair value target was based on SHUAACapital's standard weighted average: a 70% weighting allocated to our DCF value and theremaining 30% for the relative valuation.Scenario driven three-stage DCFDCF fair value is<strong>OM</strong>R 0.352/shareOur three-stage DCF valuation of <strong>Galfar</strong>, which was subjected to four different scenarios,produced a scenario-weighted fair value target of <strong>OM</strong>R 0.352 per share - implying a 31.1%downside potential to the latest closing price. The DCF was based on a ten year forecastperiod and a terminal value. The weighted average cost of capital 12 (WACC) used was 11.0%.<strong>Galfar</strong>'s scenario weighted DCF fair valueScenarioNet cash/sharePV of FCF/shareTV/shareFV/share Impaired Impairment/before receivables shareimpaired (|<strong>OM</strong>R mn)receivablesFV Weighting Weightedfv/shareDoomsday (0.31) 0.30 0.10 0.091 28 (0.09) (0.004) 10% (0.00)% fair valuecontribution-344.4% 334.4% 110.0% 100.0%Bear (0.31) 0.37 0.19 0.249 20 (0.07) 0.183 30% 0.05% fair valuecontribution-125.6% 150.2% 75.4% 100.0%Base (0.31) 0.46 0.32 0.471 15 (0.05) 0.421 50% 0.21% fair valuecontribution-66.6% 98.1% 68.5% 100.0%Bull (0.31) 0.63 0.59 0.909 10 (0.03) 0.875 10% 0.09% fair valuecontribution-34.5% 69.7% 64.8% 100.0%Fair value/share 0.352Upside/(downside)-31.1%Source: SHUAA CapitalValuation scenariossubjected to impairmentsTo address the growing concerns surrounding the issue of receivables collectionsstemming from clients' payments delays, we subjected our DCF valuation to assumptionson impairments of receivables, a key risk facing <strong>Galfar</strong> and the contracting industry ingeneral. As of 2009 year-end, <strong>Galfar</strong> had <strong>OM</strong>R 101.2mn of receivables past due out ofwhich <strong>OM</strong>R 28.4mn is more than 270 days past due. The 270 days age bracket is up88% YoY and represents 17.8% of 2009 trade receivables. We assumed impairmentson receivables past due ranging between <strong>OM</strong>R 10-28.4mn (negative <strong>OM</strong>R 0.03-0.09per share). The assumed impairment per share was subsequently subtracted from thescenario-specific fair value.2 The WACC was based on a cost of equity of 12% and a cost of debt of 8%. The cost of equity was derived through a risk free rate of 6%, an equityrisk premium of 5% and an industry beta of 1.2. 2March 18th, 2010 26


