

Galfar Engineering & Contracting (GECS.OM)
Galfar Engineering & Contracting (GECS.OM)
Galfar Engineering & Contracting (GECS.OM)

Create successful ePaper yourself
Turn your PDF publications into a flip-book with our unique Google optimized e-Paper software.
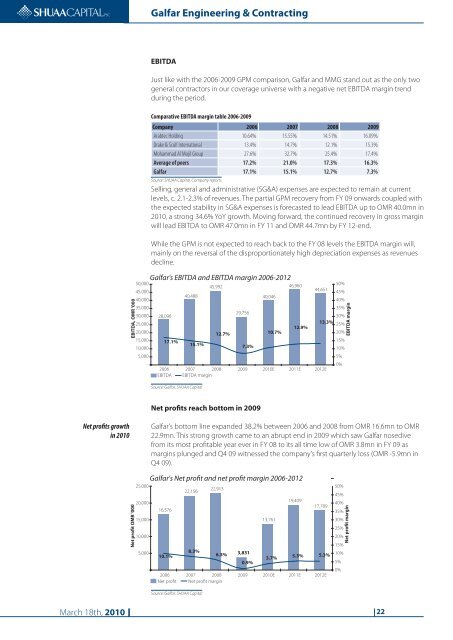
<strong>Galfar</strong> <strong>Engineering</strong> & <strong>Contracting</strong>EBITDAJust like with the 2006-2009 GPM comparison, <strong>Galfar</strong> and MMG stand out as the only twogeneral contractors in our coverage universe with a negative net EBITDA margin trendduring the period.EBITDA, <strong>OM</strong>R '00050,00045,00040,00035,00030,00025,00020,00015,00010,0005,000-Comparative EBITDA margin table 2006-2009Company 2006 2007 2008 2009Arabtec Holding 10.64% 15.55% 14.51% 16.09%Drake & Scull International 13.4% 14.7% 12.1% 15.3%Mohammad Al Mojil Group 27.6% 32.7% 25.4% 17.4%Average of peers 17.2% 21.0% 17.3% 16.3%<strong>Galfar</strong> 17.1% 15.1% 12.7% 7.3%Source: SHUAA Capital, Company reportsSelling, general and administrative (SG&A) expenses are expected to remain at currentlevels, c. 2.1-2.3% of revenues. The partial GPM recovery from FY 09 onwards coupled withthe expected stability in SG&A expenses is forecasted to lead EBITDA up to <strong>OM</strong>R 40.0mn in2010, a strong 34.6% YoY growth. Moving forward, the continued recovery in gross marginwill lead EBITDA to <strong>OM</strong>R 47.0mn in FY 11 and <strong>OM</strong>R 44.7mn by FY 12-end.While the GPM is not expected to reach back to the FY 08 levels the EBITDA margin will,mainly on the reversal of the disproportionately high depreciation expenses as revenuesdecline.<strong>Galfar</strong>'s EBITDA and EBITDA margin 2006-201228,09617.1%40,48815.1%Source: <strong>Galfar</strong>, SHUAA Capital45,99212.7%29,7567.3%40,04610.7%46,96012.9%44,6512006 2007 2008 2009 2010E 2011E 2012EEBITDA EBITDA margin50%45%40%35%30%13.3% 25%20%15%10%5%0%EBITDA marginNet profits reach bottom in 2009Net profits growthin 2010<strong>Galfar</strong>'s bottom line expanded 38.2% between 2006 and 2008 from <strong>OM</strong>R 16.6mn to <strong>OM</strong>R22.9mn. This strong growth came to an abrupt end in 2009 which saw <strong>Galfar</strong> nosedivefrom its most profitable year ever in FY 08 to its all time low of <strong>OM</strong>R 3.8mn in FY 09 asmargins plunged and Q4 09 witnessed the company's first quarterly loss (<strong>OM</strong>R -5.9mn inQ4 09).Net profit <strong>OM</strong>R '000<strong>Galfar</strong>'s Net profit and net profit margin 2006-201225,00022,15622,91320,00019,40916,57617,78915,00013,76110,0005,0008.3%3,83110.1%6.3%3.7%5.3% 5.3%0.9%-2006 2007 2008 2009 2010E 2011E 2012ENet profit Net profit margin50%45%40%35%30%25%20%15%10%5%0%Net profit marginSource: <strong>Galfar</strong>, SHUAA CapitalMarch 18th, 2010 22


