

Galfar Engineering & Contracting (GECS.OM)
Galfar Engineering & Contracting (GECS.OM)
Galfar Engineering & Contracting (GECS.OM)

You also want an ePaper? Increase the reach of your titles
YUMPU automatically turns print PDFs into web optimized ePapers that Google loves.
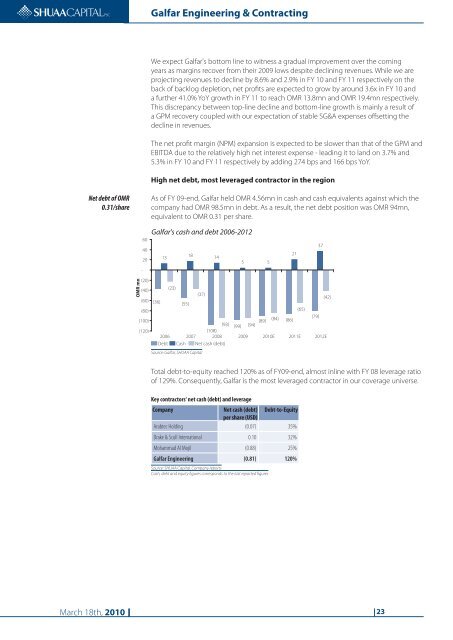
<strong>Galfar</strong> <strong>Engineering</strong> & <strong>Contracting</strong>We expect <strong>Galfar</strong>'s bottom line to witness a gradual improvement over the comingyears as margins recover from their 2009 lows despite declining revenues. While we areprojecting revenues to decline by 8.6% and 2.9% in FY 10 and FY 11 respectively on theback of backlog depletion, net profits are expected to grow by around 3.6x in FY 10 anda further 41.0% YoY growth in FY 11 to reach <strong>OM</strong>R 13.8mn and <strong>OM</strong>R 19.4mn respectively.This discrepancy between top-line decline and bottom-line growth is mainly a result ofa GPM recovery coupled with our expectation of stable SG&A expenses offsetting thedecline in revenues.The net profit margin (NPM) expansion is expected to be slower than that of the GPM andEBITDA due to the relatively high net interest expense - leading it to land on 3.7% and5.3% in FY 10 and FY 11 respectively by adding 274 bps and 166 bps YoY.High net debt, most leveraged contractor in the regionNet debt of <strong>OM</strong>R0.31/shareAs of FY 09-end, <strong>Galfar</strong> held <strong>OM</strong>R 4.56mn in cash and cash equivalents against which thecompany had <strong>OM</strong>R 98.5mn in debt. As a result, the net debt position was <strong>OM</strong>R 94mn,equivalent to <strong>OM</strong>R 0.31 per share.604020-<strong>Galfar</strong>'s cash and debt 2006-20121318 145 52137<strong>OM</strong>R mn(20)(40)(23)(60)(37)(36) (55)(42)(80)(65)(100)(84)(79)(89) (86)(93) (99) (94)(120)(108)2006 2007 2008 2009 2010E 2011E 2012EDebt Cash Net cash (debt)Source: <strong>Galfar</strong>, SHUAA CapitalTotal debt-to-equity reached 120% as of FY09-end, almost inline with FY 08 leverage ratioof 129%. Consequently, <strong>Galfar</strong> is the most leveraged contractor in our coverage universe.Key contractors' net cash (debt) and leverageCompanyNet cash (debt) Debt-to-Equityper share (USD)Arabtec Holding (0.07) 35%Drake & Scull International 0.10 32%Mohammad Al Mojil (0.88) 25%<strong>Galfar</strong> <strong>Engineering</strong> (0.81) 120%Source: SHUAA Capital, Company reportsCash, debt and equity figures corresponds to the last reported figuresMarch 18th, 2010 23


