Dissertation
Dissertation
Dissertation
You also want an ePaper? Increase the reach of your titles
YUMPU automatically turns print PDFs into web optimized ePapers that Google loves.
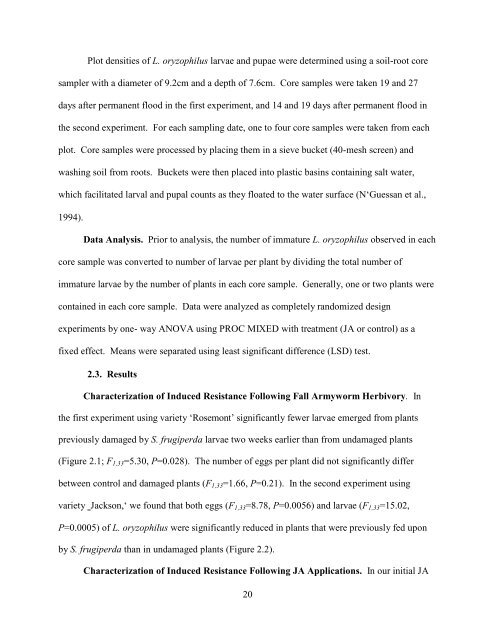
Plot densities of L. oryzophilus larvae and pupae were determined using a soil-root coresampler with a diameter of 9.2cm and a depth of 7.6cm. Core samples were taken 19 and 27days after permanent flood in the first experiment, and 14 and 19 days after permanent flood inthe second experiment. For each sampling date, one to four core samples were taken from eachplot. Core samples were processed by placing them in a sieve bucket (40-mesh screen) andwashing soil from roots. Buckets were then placed into plastic basins containing salt water,which facilitated larval and pupal counts as they floated to the water surface (N‘Guessan et al.,1994).Data Analysis. Prior to analysis, the number of immature L. oryzophilus observed in eachcore sample was converted to number of larvae per plant by dividing the total number ofimmature larvae by the number of plants in each core sample. Generally, one or two plants werecontained in each core sample. Data were analyzed as completely randomized designexperiments by one- way ANOVA using PROC MIXED with treatment (JA or control) as afixed effect. Means were separated using least significant difference (LSD) test.2.3. ResultsCharacterization of Induced Resistance Following Fall Armyworm Herbivory. Inthe first experiment using variety ‘Rosemont’ significantly fewer larvae emerged from plantspreviously damaged by S. frugiperda larvae two weeks earlier than from undamaged plants(Figure 2.1; F 1,33 =5.30, P=0.028). The number of eggs per plant did not significantly differbetween control and damaged plants (F 1,33 =1.66, P=0.21). In the second experiment usingvariety ‗Jackson,‘ we found that both eggs (F 1,33 =8.78, P=0.0056) and larvae (F 1,33 =15.02,P=0.0005) of L. oryzophilus were significantly reduced in plants that were previously fed uponby S. frugiperda than in undamaged plants (Figure 2.2).Characterization of Induced Resistance Following JA Applications. In our initial JA20


