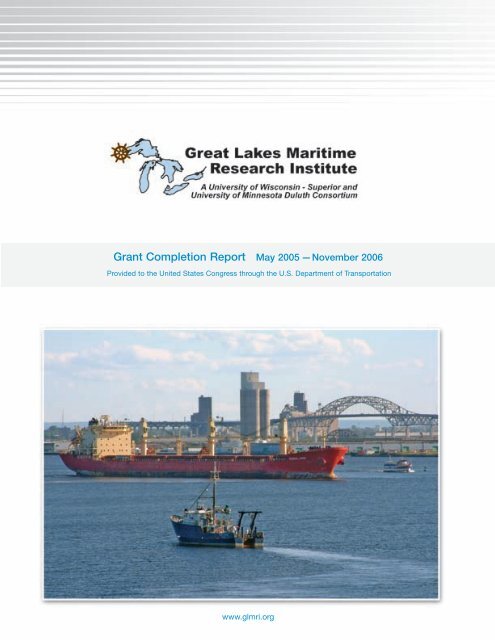
15 MB - Great Lakes Maritime Research Institute
15 MB - Great Lakes Maritime Research Institute
15 MB - Great Lakes Maritime Research Institute

You also want an ePaper? Increase the reach of your titles
YUMPU automatically turns print PDFs into web optimized ePapers that Google loves.
Mission StatementThe <strong>Great</strong> <strong>Lakes</strong> <strong>Maritime</strong> <strong>Research</strong><strong>Institute</strong> is dedicated to developing andimproving economically andenvironmentally sustainable maritimecommerce on the <strong>Great</strong> <strong>Lakes</strong> throughapplied research.A U.S. Department of Transportation, <strong>Maritime</strong> AdministrationNational <strong>Maritime</strong> Enhancement<strong>Institute</strong>2
This page intentionally left blank.3
Technical Report Documentation1. Report No.GLMRI-2006-00012. Government Accession No. 3. Recipient’s Catalog No:Catalog of Federal DomesticAssistance #20.0004. Title and SubtitleThe <strong>Great</strong> <strong>Lakes</strong> <strong>Maritime</strong> <strong>Research</strong> <strong>Institute</strong>5. Report Date: November 20066. Performing Organization Code7. Author/sRichard D. Stewart, Ph.DJames P. Riehl, Ph.DCarol J. WoloszDale BergeronTab 1: Michael D. Parsons, Ph.DTab 2: Peter Lindquist, Ph.DTab 3: Randall K. SkalbergTab 4: Abu R. Hasan, Ph.D , Daniel Pope, Ph.D, and James SkurlaTab 5: Steven M. Colman, Ph.D, and R. Douglas Ricketts, Ph.DTab 6: Joan Schumaker Chadde9. Performing Organization Name and AddressThe <strong>Great</strong> <strong>Lakes</strong> <strong>Maritime</strong> <strong>Research</strong> <strong>Institute</strong>291 Marshall W. Alworth Hall1023 University DriveDuluth, MN 5581212. Sponsoring Organization Name and AddressThe United State Department of TransportationOffice of the Secretary8. Performing Organization ReportNo.10. Work Unit No. (TRAIS)11. Contract or Grant No.DTOS59-05-G-0001913. Type of Report and PeriodCoveredEnd of Grant Period Report14. Sponsoring Agency CodeUS DOT<strong>15</strong>. Supplementary Notes16. AbstractThe <strong>Great</strong> <strong>Lakes</strong> <strong>Maritime</strong> <strong>Research</strong> <strong>Institute</strong> (GLMRI) was established to pursue research efforts inmarine transportation, logistics, economics, engineering, environmental planning and portmanagement. The consortium also draws on expertise in a wide range of other areas throughaffiliations with other “<strong>Great</strong> <strong>Lakes</strong>” universities. In this initial year of funded support, the <strong>Institute</strong>established formal affiliations with seven other <strong>Great</strong> <strong>Lakes</strong> universities, set up an external advisoryboard, engaged in extensive outreach to stakeholders and developed a prioritized research focus.This publication provides reports on the progress against the initial research agenda.17. Key Words: <strong>Great</strong> <strong>Lakes</strong>, <strong>Maritime</strong>, Data,Harbor Maintenance Tax, Fuel Alternatives,MARAD, NMEI, US DOT18. Distribution Statement: US Congress, US DOT, state DOTs, US Coast Guard, USArmy Corps of Engineers, GL Port Authorities19. Security Classification (of this report)Unclassified20. Security Classification (of this page)Unclassified21. No. Of Pages 22. Price-0-4
This page intentionally left blank.5
TABLE OF CONTENTSOverview and Background 8Consortium Partners 8Advisory Board 10University <strong>Research</strong> Affiliations 11Initial <strong>Research</strong> Focus 13Project Awards and Cooperative Efforts 14Outreach Events, Presentations and Participation <strong>15</strong>Extension Education and Outreach Support 18Future Plan/Beyond this Grant 18<strong>Research</strong> and Outreach Project Reports:Seaway-Sized Bulk Carrier Model for Hydrodynamic Optimization ofBallast-Free Ship Design, By Michael D. Parsons Tab 1Expanding Regional Freight Information Resources for the UpperMidwest: The <strong>Great</strong> <strong>Lakes</strong> <strong>Maritime</strong> Information Delivery System,By Peter Lindquist Tab 2Tax Systems and Barriers to <strong>Great</strong> <strong>Lakes</strong> <strong>Maritime</strong> Commerce,By Randall K. Skalberg Tab 3Alternatives to Petroleum Based Fuel for Marine VesselsBy Abu R. Hasan, Daniel Pope, and James Skurla Tab 4Feasibility Study: Usefulness of Modern Acoustic Methods to the <strong>Maritime</strong>Industry in Relation to Changes in Water Depth in the <strong>Great</strong> <strong>Lakes</strong>By Steven M. Colman and R. Douglas Ricketts Tab 5<strong>Great</strong> <strong>Lakes</strong> <strong>Maritime</strong> Transportation K-12 Education Program forTeachers, Students and CommunitiesBy Joan Schumaker Chadde Tab 66
This page intentionally left blank.7
Overview and Background:During March 2004, The University of Minnesota Duluth and University of Wisconsin-Superior formedthe consortium, The <strong>Great</strong> <strong>Lakes</strong> <strong>Maritime</strong> <strong>Research</strong> <strong>Institute</strong> (GLMRI). Federal funding to support theGLMRI was received in May of 2005. The US <strong>Maritime</strong> Administration (MARAD) designated theGLMRI as a National <strong>Maritime</strong> Enhancement <strong>Institute</strong> (NMEI) on June 1, 2005.$750,000 was federally appropriated through the Transportation Act of 2005, specifically for <strong>Great</strong> <strong>Lakes</strong><strong>Research</strong> by a NMEI. This appropriation provided partial funding to support of the research objectives inthe Coast Guard and <strong>Maritime</strong> Transportation Act of 2004 authorizing a U.S. designated <strong>Great</strong> <strong>Lakes</strong>NMEI.This report is the summary of research and effort accomplished through this grant, from thecommencement of the program through the first year of funded research.Consortium Partners:The transportation research centers of the University of Wisconsin-Superior and the University ofMinnesota Duluth have for several years jointly pursued transportation and logistics research, publicforums and funding. In March of 2004 these universities formally agreed to form a research institute thatwould focus on <strong>Great</strong> <strong>Lakes</strong> <strong>Maritime</strong> <strong>Research</strong>.The two Universities are located in the largest port on the <strong>Great</strong> <strong>Lakes</strong>. The communities have been atransportation hub for over <strong>15</strong>0 years. In addition to the maritime industry, the Twin Ports have serviceby four class 1 railroads, the terminus of the longest pipeline in North America, headquarters to overthirty trucking companies, an international airport and the largest single engine airplane manufacturer inthe US. The Twin Ports have a US Coast Guard Office of Marine Inspection and is the home port for thenew USCG Cutter Alder. The Twin Ports are also a Port of Entry with the U.S. Customs Office and TheImmigration and Naturalization Service.The <strong>Great</strong> <strong>Lakes</strong> <strong>Maritime</strong> <strong>Research</strong> <strong>Institute</strong> combines the strengths of two universities and theirrespective Transportation <strong>Research</strong> Centers. This dynamic combination provides a program area withtremendous breadth as a National <strong>Maritime</strong> Enhancement <strong>Institute</strong> serving the <strong>Great</strong> <strong>Lakes</strong> Region. TheUniversity of Wisconsin-Superior and the University of Minnesota Duluth have formally joined togetherto pool the considerable resources available to the two institutions to continue and expand <strong>Great</strong> <strong>Lakes</strong>maritime research. The universities have a history of supporting each other in the area of transportationresearch.The consortia that forms the GLMRI draws staff from two universities with experts in marinetransportation, logistics, economics, engineering, technology, computer management, management,marine environmental, planning, geography and port management. The consortium can also draw onexpertise in a wide range of other areas including among others, air and rail transportation management,operations research, mathematics and social sciences. Both universities are members of federallynominated University Transportation <strong>Research</strong> Centers.8
The faculty and administrators of the GLMRI have had a long-term involvement with the maritimeindustry including shippers, carriers, ports and government agencies. The consortium is committed toimproving the maritime system of the <strong>Great</strong> <strong>Lakes</strong> and the United States.<strong>Great</strong> <strong>Lakes</strong> <strong>Maritime</strong> <strong>Research</strong> <strong>Institute</strong>Co-Directors: UW-Superior and UMDUW-SuperiorTransportation andLogistics <strong>Research</strong>Center <strong>Research</strong>Contract <strong>Research</strong>to AffiliateUniversities or<strong>Research</strong> groupsUniversity of MN DuluthCollege of Science andEngineeringAdvisory Board9
Advisory Board:One of the first tasks of the <strong>Institute</strong> was to establish an advisory board. With input from the US DOT andthe <strong>Maritime</strong> Administration, the Co-Directors of the <strong>Institute</strong> came up with a list of representatives whohave expertise in maritime commerce, marine environmental issues or other segments of the <strong>Great</strong> <strong>Lakes</strong>Marine transportation system. The membership of the board was designed to bring together industry,academia and government leaders to advise the co-directors on the research agenda and to provide inputon topical priorities. The Advisory Board can be expanded to include additional relevant stakeholdersthat agree to participate. The list of advisory organizations/board members is listed below:- The Chairman of the <strong>Great</strong> <strong>Lakes</strong> Commission- The Administrator of the St. Lawrence Seaway Development Corporation- The US DOT <strong>Maritime</strong> Administration, Director of the <strong>Great</strong> <strong>Lakes</strong> Region- The Chairman of the Society of Naval Architects and Marine Engineers, <strong>Great</strong> <strong>Lakes</strong> Section- The Chairman of the American <strong>Great</strong> <strong>Lakes</strong> Ports Association- The Commander of the Ninth Coast Guard- The President of the Lake Carriers’ Association- The Army Corps of Engineers, Detroit District EngineerSeveral of the organizations have delegated their membership to a specific person in their organization.The current membership of the Advisory Board is listed below:Ms. Doris J. BautchDirector, MARAD, <strong>Great</strong> <strong>Lakes</strong> RegionSchaumberg, IL 60173Commander Gary CrootU.S. Coast Guard, Marine Safety OfficeDuluth, MN 55802Dr. Thomas HuntleyChairman, <strong>Great</strong> <strong>Lakes</strong> CommissionDuluth, MN 55812Mr. Craig MiddlebrookDeputy Administrator, St. Lawrence Seaway Development CorporationWashington, DC 20590Mr. Al HorsmonChairman, Society of Naval Architects and Marine Engineers (SNAME)Three Rivers, MI 49093Lieutenant Colonel William LeadyUS Army Corps of EngineersDistrict Engineer, Detroit DistrictDetroit, MI 4826610
Mr. Adolph OjardChairman, American <strong>Great</strong> <strong>Lakes</strong> Ports Association (AGLPA)Duluth, MN 55802Mr. James H.I. WeaklyPresident, Lake Carriers' AssociationCleveland, OH 44113On October 7, 2005, the first meeting of the GLMRI Advisory Board was held in Duluth, MN. TheBoard members recommended that the research agenda include a solid communication strategy alongwith a balance of the research agenda topics. The Co-Directors agreed to keep the board membersupdated on the progress of the research areas.The second meeting of the Advisory Board was held on October 6, 2006 in Duluth, MN. The Boardmembers reviewed the progress that the <strong>Institute</strong> had made over the first year, and reviewed the researchagenda for the future. The members were pleased with the progress that was made, and recommendedthat the Board continue to meet annually. Also, the members discussed the current make up of the Board,and agreed that the current membership was appropriate, but would consider/review other potentialmembers at the annual meetings.University <strong>Research</strong> Affiliations:One of the tasks identified in the 2005 Statement of Work was to build the base of affiliate researchuniversities to broaden the expertise. Universities in the <strong>Great</strong> <strong>Lakes</strong> region with expertise in the researchfocus areas were offered affiliations to partner in applicable areas. <strong>Research</strong>ers and other relevant affiliateassets from the affiliated universities are included as part of the research portfolio of the GLMRI, and theaffiliate may serve as project researchers based on submitted proposals in response to an annual Requestfor Proposals. <strong>Research</strong> affiliates are encouraged to leverage GLMRI resources in efforts to secureindependent and joint funding opportunities for <strong>Great</strong> <strong>Lakes</strong> maritime research. As of the end of thisgrant period, there are seven affiliate universities:<strong>Great</strong> <strong>Lakes</strong> <strong>Maritime</strong> AcademyAdmiral John Tanner1701 East Front StreetTraverse City, MI 49686Michigan Technological UniversityDr. William SprouleDept. of Civil and Environmental Engineering1400 Townsend DriveHoughton, MI 4993111
University of MichiganDr. Armin TroeschDept. of Naval Architecture and Marine Engineering2600 DraperAnn Arbor, MI 48109Purdue UniversityMr. Rick EvansAssistant Director, Industrial/Foundation AdministrationYoung Hall302 Wood StreetWest Lafayette, IN 47907-2108Purdue University North CentralDr. Keith SchwingendorfDean, College of Science1401 S. US Hwy 421Westville, IN 46391University of ToledoDr. Mark VonderembseDirector, Intermodal Transportation <strong>Institute</strong>2801 W. Bancroft St.Toledo, OH 43606University of Wisconsin-MadisonDr. Teresa AdamsMidwest Regional University Transportation Center14<strong>15</strong> Engineering Drive, Rm. 2250Madison, WI 53706On October 8, 2005, the first meeting for affiliate universities was held in Duluth, MN to reviewpossible collaborations and discuss opportunities for synergistic partnerships. With this information,combined with the feedback from the GLMRI Advisory Board meeting, a research agenda was finalizedfor this grant. A long-term communication and marketing strategy was also considered to develop anoutreach program.The second meeting of the affiliate universities was held on October 7, 2006 in Duluth, MN. Theprinciple investigators from the GLMRI research projects presented reports on the accomplishments madethroughout this initial period.12
Initial <strong>Research</strong> Focus: After the initial meeting of the Advisory Board in October2005, the consortium co-directors finalized the research agenda for the initial research pursued under the<strong>Institute</strong>. A call for proposals was released to affiliate universities, and proposals were submitted forconsideration within the time and fiscal constraints of the initial grant. The Call for Proposals highlightedthe following areas for research focus:- Economics and development of the <strong>Great</strong> <strong>Lakes</strong> (GL) marine transportation system (MTS)New MarketsConcepts to expand GL ship repair and ship buildingRemoving or streamlining regulatory barriers to maritime commerceThe use of smaller (handy size vessels)GL Passenger trade market studies- Economic Issues concerning <strong>Great</strong> <strong>Lakes</strong> port developmentImpacts of gentrification of the waterfrontsImpact of lock closure on the Soo- Security issues relative to the <strong>Great</strong> <strong>Lakes</strong> marine transportation systemThe use of Intelligent Transportation Systems to track cargo and shipsThe establishment of a cost-effective <strong>Great</strong> <strong>Lakes</strong> MTS security training program- Inter-modal transportation opportunities for <strong>Great</strong> <strong>Lakes</strong> transportation systemsHub and spoke MTS systemMTS Routes to relieve road congestionIntelligent transportation systems for seamless intermodal movementsFreight Corridors roads to facilitate overweight, oversize trucks linked to the MTSDistribution centers linked to the GL MTS- Marine transportation and port environmental issuesAddressing the future impact of the clean air bill on GL vesselsIssues in shipboard management of proposed ballast water treatment systemsBallast water free ship designs for GL and foreign tradeEstablishing a Green Ship programs on the <strong>Great</strong> <strong>Lakes</strong>- Marine transportation and port educationK-12 GL MTS education programs<strong>Maritime</strong> Commerce public education and outreachOther topics under consideration: Port Security Training and <strong>Research</strong>, Tourism, IntelligentMarine Transportation Systems, International Oceans Commission, Winter Shipping and PortAccess/Winter Navigation13
Specific Project Awards to University <strong>Research</strong>ers andOther Cooperative Efforts:After review of the proposals received through the two consortium universities and the Call for Proposalsto the Affiliate Universities, the following projects were selected for award. In addition to the directfunded research, GLMRI provided support to several other projects as cooperative arrangements to ongoingresearch projects from other centers and institutes. The research proposals submitted exceeded theavailable funds and a grant review process was used to select the proposals. <strong>Research</strong> reports areprovided as tabs to this publication on each of the completed efforts. Reports still pending will beavailable on the GLMRI website upon their completion. www.glmri.org1) Evaluate new vessel designs: Seaway-Sized Bulk Carrier Model for Hydrodynamic Optimization ofBallast-Free Ship Design. Led by University of Michigan. (Tab 1)2) Expanding Regional Freight Information Resources for the Upper Midwest through the developmentof a maritime information data delivery system. Led by University of Toledo. (Tab 2)3) Review of the tax systems and other economic barriers to maritime commerce impacting the <strong>Great</strong><strong>Lakes</strong>. Led by University of Minnesota Duluth. (Tab 3)4) <strong>Research</strong> of Bio-Diesel Fuel Alternatives for <strong>Maritime</strong> Applications. Led by University of MinnesotaDuluth. (Tab 4)5) Perform lake level and/or sediment studies. Led by University of Minnesota Duluth’s Large <strong>Lakes</strong>Observatory, utilizing the <strong>Research</strong> Vessel, R/V Blue Heron. (Tab 5)6) Providing a marine transportation and port education program for K-12 teachers. Led byMichigan Technological University. (Tab 6)7) Evaluation of a <strong>Great</strong> <strong>Lakes</strong> Short Sea Shipping Routes: Thunder Bay, Ontario to the Twin PortsFreight/passenger Ferry (Led by University of University of Wisconsin-Superior) (Report pending)8) Review Ballast Water Commercial Operations – Cooperative program with UW-S Lake Superior<strong>Research</strong> <strong>Institute</strong> and the <strong>Great</strong> Ships Initiative, Northeast Midwest <strong>Institute</strong>9) Study the potential for capacity expansion of the Detroit-Windsor Truck Ferry: Participants Universityof Toledo, Detroit Windsor Truck Ferry, Global Insights, and Transport Canada (Report pending)10) Review and examine policy issues and barriers related to making rail and maritime modes morecompetitive for short haul freight in the upper Midwest as part of the Upper Midwest Freight CorridorStudy (Cooperative effort led by the MRUTC, UW-Madison)14
Outreach Events, Presentations and Participation- GLMRI Co-Directors and staff participated on behalf of GLMRI and/or have made presentations on thebenefits of short-sea shipping and other research projects to various <strong>Great</strong> <strong>Lakes</strong> audiences- March 2, 2005 The Co-Directors presented an orientation of the <strong>Institute</strong> to TheLake Superior Harbor Technical Advisory Committee. Duluth MN- April 11&12, 2005 Dr. Stewart presented an update on GLMRI to the Journal ofCommerce Domestic <strong>Maritime</strong> Conference. Hilton Head Island, SC- April 17&18, 2005 Dr. Riehl and Carol Wolosz participated in the The James L.Oberstar Transportation Forum. Minneapolis, MN- April 20, 2005 Carol Wolosz presented a program overview at the MN Sea GrantAdvisory Board. Duluth, MN- June 4, 2005 Ms. Doris Bautch, Director of the <strong>Great</strong> <strong>Lakes</strong> Region for the US<strong>Maritime</strong> Administration, formally presented the letter to the codirectorsdesignating GLMRI as a National <strong>Maritime</strong> Enhancement<strong>Institute</strong> (NMEI) at a public ceremony. Duluth, MN- July 9&12, 2005 Dr. Stewart presents at Ports and Waterways section of theTransportation <strong>Research</strong> Board Semi-Annual Meeting. Boston, MA- July 7, 2005 Drs. Stewart and Riehl and Ms. Wolosz attended the The <strong>Great</strong><strong>Lakes</strong> Regional Collaboration Summit I. Duluth, MN- August 1, 2005 Congressman David Obey’s Visit and Briefings, University ofWisconsin-Superior. Superior, WI- August 5, 2005 Drs. Stewart and Riehl presented an overview of GLMRI to Centerfor Freshwater <strong>Research</strong> and Policy. Duluth, MN- September 1, 2005 Dr. Stewart presents at the St. Lawrence Seaway DevelopmentCorporation H 2 0 Wood Products meeting. Duluth, MN- September 8, 2005 Dr. Stewart at the Northern Networks Trade Conference. Duluth, MN- September <strong>15</strong>, 2005 Dr. Stewart presented at the Wisconsin Commercial Ports AnnualMeeting. Bayfield, WI.- September 20, 2005 Dr. Riehl met with the University of Minnesota, Center forTransportation Studies, director. Minneapolis, MN- September 26, 2005 Dr. Stewart at the Midwest Regional University TransportationCenter Meeting. Chicago, IL- October 7, 2005 GLMRI Advisory Board meeting, Duluth, MN<strong>15</strong>
- October 8, 2005 GLMRI Affiliate Universities Meeting and R/V Blue Heron Tour.Duluth, MN- November 2, 2005 Marine Industry Sustainability Initiative Group- November 14-<strong>15</strong>, 2005 Midwest Transportation Coalition – Freight Corridor StudyDr. Stewart presented. Milwaukee, WI- November 17-18, 2005 <strong>Great</strong> <strong>Lakes</strong> Regional Waterways Management Forum.Dr. Stewart presented. Point Edward, Ontario- December 16, 2005 Meeting with the Port Authority for Intermodal Plan for the Twin Ports. Dr.Stewart and Mr. Skurla attended. Duluth, MN- December 29, 2005 Dr. Richard Stewart and Adolph Ojard, the Duluth Seaway Port AuthorityDirector, did an interview with “Almanac North” on <strong>Great</strong> <strong>Lakes</strong> Shipping.“Almanac North” is a local television show run through the PublicBroadcasting System (PBS). Duluth, MN- January, 11, 2006 Dr. Stewart presented at he Wood Products Conference hosted bythe University of Minnesota Duluth. Duluth, MN- January 20, 2006 Dr. Stewart presented an update of GLMRI research projects at theAmerican <strong>Great</strong> <strong>Lakes</strong> Ports Association annual meeting. Toronto, Canada- January 22-25, 2006 Transportation <strong>Research</strong> Board. Dr. Stewart presented on at the Short SeaShipping in the United States and Canada Session. Dr. Riehl and CarolWolosz also attended the conference. Washington, D.C.- January 27, 2006 Carol Wolosz participated in the Society for Naval Architects and MarineEngineers (SNAME) Winter Meeting, Perrysburg, OH- March 8&9, 2006 Dr. Stewart gave a presentation on “What <strong>Great</strong> <strong>Lakes</strong> <strong>Maritime</strong>Environmental Course Should We Steer?” at <strong>Maritime</strong> Day. Cleveland, OH- March 27&28, 2006 Dr. Stewart and Carol Wolosz participated in the Northeast Midwest<strong>Institute</strong>’s planning meeting for the <strong>Great</strong> Ships Initiativedemonstration project. Duluth, MN- April 9&10, 2006 Dr. Stewart and Carol Wolosz attended The James L. OberstarForum on Transportation Policy and Technology. Minneapolis, MN- April 25&26, 2006 Carol Wolosz participated in the Upper Midwest Freight Workshop.Columbus, OH- May 17& 18, 2006 GLMRI co-sponsored The <strong>Great</strong> <strong>Lakes</strong> <strong>Maritime</strong> Academy’s T/SState of Michigan for local education and outreach tours in the TwinPorts harbor. A reception and harbor tour were provided to localdignitaries on May 17th. The ship was open for community tours onboth days of the visit. Duluth, MN16
- May 19, 2006 Dr. Stewart was keynote speaker at Duluth-Superior <strong>Maritime</strong> DayCommunity Ceremony, “The Future of <strong>Great</strong> <strong>Lakes</strong> <strong>Maritime</strong>Commerce”. Duluth, MN- May 22, 2006 Dr. Stewart presented ideas and direction to the Taconite AggregateTransportation Meeting Group at the Natural Resources <strong>Research</strong><strong>Institute</strong>. Duluth, MN- June 7, 2006 Dr. Stewart presented an update on the research projects at theHarbor Technical Advisory Committee. Superior, WI- June 9, 2006 Drs. Stewart and Wang and Ms. Wolosz participated in the meetingof the <strong>Great</strong> <strong>Lakes</strong> <strong>Maritime</strong> Information Delivery System, asponsored GLMRI research project. Detroit, MI- June 27, 2006 Dr. Stewart presented on “<strong>Great</strong> <strong>Lakes</strong> Environmental Issues” at theGreen Marine Conference. St. Catherines, Ontario- June 28, 2006 Drs. Stewart and Riehl provided program updates to CongressmanJames L. Oberstar and staff members for Congressman David Obey.Washington, D.C.- June 29, 2006 Drs. Stewart and Kwon and Ms. Wolosz provided program updatesto members of US DOT, The <strong>Maritime</strong> Administration and the St.Lawrence Seaway Development Corporation. Washington, D.C.- July 13, 2006 Dr. Stewart moderated a panel on Short Sea Shipping at Thor Fest.Duluth MN- July 26&27, 2006 Dr. Kwon attended the Marine Transportation System NationalAdvisory Council meeting. Norfolk, VA- August 17&18 Ms. Wolosz participated in the Midcontinent Transportation<strong>Research</strong> Forum, hosted by the University of Wisconsin-Madison,with sponsorship from GLMRI. Madison, WI- August 29, 2006 Dr. Stewart presented on <strong>Great</strong> <strong>Lakes</strong> <strong>Maritime</strong> Commerce to theTRB Committee on the St. Lawrence Seaway: Options to EliminateIntroduction of Non-indigenous Species into the <strong>Great</strong> <strong>Lakes</strong>, Phase II.Toronto, Canada- October 3, 2006 Dr. Stewart provided an update on the GLMRI research projects tothe Council of <strong>Great</strong> <strong>Lakes</strong> <strong>Research</strong> Centers. Duluth, MN- October 4, 2006 Dr. Stewart provided an update on the GLMRI research projects tothe <strong>Great</strong> <strong>Lakes</strong> Commission at their annual meeting. Duluth, MN- October 6, 2006 The 2 nd GLMRI Advisory Board meeting. Duluth, MN17
- October 7, 2006 The 2 nd GLMRI Affiliate Universities Meeting. Duluth, MN- October 13, 2006 Dr. Stewart provided an update on the GLMRI research projects tothe University Transportation Center meeting at the University ofWisconsin-Madison. Madison, WIExtension Education and Outreach SupportGLMRI is developing an education and outreach program, tied with MN and WI Sea Grant. Mr. DaleBergeron was hired in cooperation with MN Sea Grant to perform marketing and develop presentations toregional and governmental agencies. Ultimately, the goal of our outreach and educational efforts is tomake sure information generated within the research community makes its way into the hands of thosewho need it, whether those individuals are industry experts, policy makers, or the citizens of the <strong>Great</strong><strong>Lakes</strong> basin and beyond.In its continuous effort to develop and improve economically and environmentally sustainable maritimecommerce on the <strong>Great</strong> <strong>Lakes</strong>, GLMRI is not only supporting creative applied research, but is alsoworking with existing organizations, like MN Sea Grant, to build new partnerships to promote constituentdriven programs, and conduct educational activities that can effect both behavioral and economic changethrough local and regional, stakeholder focused programs. The primary goals are to continue to build andmaintain significant relationships with constituent groups. A dedicated effort has been made to reach outfor input, and to provide a neutral science-based resource for information.Our outreach efforts are focused on providing constituents with access to university-based research andtechnologies to address specific technical and economic issues in relation to the optimization of maritimecommerce in the <strong>Great</strong> <strong>Lakes</strong>. We will continue to use linkages to raise visibility, conduct conferencesand workshops, present talks, design and produce educational and informational materials, raiseawareness and work to change behaviors and improve creative public and private collaborations.One of the key outreach methods is to present the research in academic and professional forums andjournals. GLMRI funded research outcomes are being presented in 2007 at peer reviewed conferencesand in journals.Future Plan for GLMRI – Beyond this Grant:In fiscal year 2006, $2,000,000 was appropriated in the U.S. Transportation Bill to support maritimeresearch through GLMRI. In accordance with the intent of the Authorizing legislation, the 2006 US DOTAppropriations have been routed through MARAD to support the <strong>Great</strong> <strong>Lakes</strong> NMEI. The FY 07 amounthas been initially spread over two years, providing $1 million per year with approximately $400,000designated for affiliate university research projectsA call for proposals was released in April 2006 for the first year of projects, against this 2-year funding(Oct 2006 – Oct 2008). Eighteen proposals from the affiliated universities and the 2 host-universitieswere received requesting over $1.4 million. A review process that included outside reviewers fromMARAD made the final selection. As of the final writing of this report the following projects have beenawarded in support of the current research agenda:18
- Testing Relationships between Propagule Pressure and Colonization Success of InvasiveSpecies (University of Minnesota Duluth and the University of Wisconsin-Superior’s Lake Superior<strong>Research</strong> <strong>Institute</strong> in cooperation with the Northeast Midwest <strong>Institute</strong>’s <strong>Great</strong> Ships Initiative)- Evaluating the impact of long term storage at low temperatures of Biodiesel fuel blends forconsideration of use in marine vessels on the <strong>Great</strong> <strong>Lakes</strong> (University of Minnesota Duluth)- Part II: Hydrodynamic optimization testing of the model built under the first grant for theballast-free ship design (University of Michigan)- Phase II of implementing the <strong>Great</strong> <strong>Lakes</strong> <strong>Maritime</strong> Information Delivery System (University ofToledo)- A review of the <strong>Great</strong> <strong>Lakes</strong> shipbuilding and repair capability – Past, present and future(University of Michigan)- Structure of Bacterial Communities Associated with Accelerated Corrosive Loss of PortTransportation Infrastructure (University of Minnesota Duluth)- A multibeam bathymetry and sidescan-sonar survey of the Duluth-Superior Harbor andnearshore (University of Minnesota Duluth)- Continued support from Minnesota Sea Grant for extension education and outreach projects- Year 2 of a marine transportation and port education program for K-12 teachers (MichiganTechnological University)The <strong>Institute</strong> is becoming recognized in the area for leadership and its research capabilities. In its shortexistence, GLMRI has become an independent source for business studies as an “honest broker”. The<strong>Institute</strong> is evolving a permanent relationship with DOT and the <strong>Maritime</strong> Administration to maximizecontinued funding in support of maritime research on the <strong>Great</strong> <strong>Lakes</strong> through the National <strong>Maritime</strong>Enhancement <strong>Institute</strong>. During the next two years GLMRI will continue: outreach to stakeholders, holdadvisory and affiliate university meetings, and collaborate with MARAD and other relevant governmentagencies and stakeholder in supporting GLMRI’s mission.19
SeawaySized Bulk Carrier Model for Hydrodynamic Optimizationof BallastFree Ship DesignProf. Michael G. ParsonsDepartment of Naval Architecture and Marine Engineering2600 Draper RoadUniversity of MichiganAnn Arbor, MI 48109Prof. Miltiadis Kotinis Engineering Department, Office 239SUNY <strong>Maritime</strong> College6 Pennyfield AvenueThroggs Neck, NY 10465October 2, 2006Department of Naval Architecture and Marine EngineeringUniversity of MichiganAnn Arbor, MI 481092145This report represents the results of research conducted by the authors and does not necessarilyrepresent the views or policies of the <strong>Great</strong> <strong>Lakes</strong> <strong>Maritime</strong> <strong>Research</strong> <strong>Institute</strong>. This report doesnot contain a standard or specified technique. The authors and the <strong>Great</strong> <strong>Lakes</strong> <strong>Maritime</strong><strong>Research</strong> <strong>Institute</strong> do not endorse products or manufacturers. Trade or manufacturers’ namesappear herein solely because they are considered essential to this report.<strong>Research</strong> funded in part by the <strong>Great</strong> <strong>Lakes</strong> <strong>Maritime</strong> <strong>Research</strong> <strong>Institute</strong>1
This page intentionally left blank.2
Table of Contentspage1. Introduction 62. Background 73. General Description of Design Procedure 104. Model Construction Constraints 135. Model Propeller Selection and Geometric Scale Factor 146. Computational Fluid Dynamics (CFD) Analysis of the External Flow <strong>15</strong>7. Computational Fluid Dynamics (CFD) Analysis of theInternal Ballast Trunk Flow 188. Model Construction 199. Potential Economic Impacts of the <strong>Research</strong> Results 2110. References 22List of TablespageTable 3.1: BallastFree Bulk Carrier Main Particulars 11Table 3.2: BallastFree Bulk Carrier Ballast Condition 11Table 4.1: MHL Towing Tank Dimensions 13Table 5.1: MHL No. 23 Stock Propeller Characteristics 14Table 5.2: BallastFree Bulk Carrier Model Characteristics 14Table 6.1: BallastFree Bulk Carrier Model Resistance Calculations <strong>15</strong>3
This page intentionally left blank.4
List of FigurespageFigure 2.1: Typical Seawaysize Bulk Carrier (left) andBallastFree Concept Bulk Carrier (right) 8Figure 2.2: Typical Forward Plenum and Collision Bulkhead Arrangement 9Figure 2.3: Typical Aft Plenum Arrangement 9Figure 3.1: Polsteam Seawaysized Bulk Carrier Isa 10Figure 3.2: BallastFree Bulk Carrier Body Plan 11Figure 3.3: BallastFree Bulk Carrier Profile View 12Figure 3.4: BallastFree Bulk Carrier Plan View 12Figure 6.1: Pressure Contours Velocity Vectors at the Bow of theBallastFree Bulk Carrier Model 16Figure 6.2: Pressure Contours at the Stern of the BallastFree Bulk Carrier Model 16Figure 6.3: Velocity Vectors at the Bow of the BallastFree Bulk Carrier Model 17Figure 6.4: Velocity Vectors at the Stern of the BallastFree Bulk Carrier Model 17Figure 7.1: Computational Model Geometry of Double Bottom Structure 18Figure 8.1: Aft Portion of the Scale Model SeawaySized Bulk Carrier –Inverted Stern Quarter View 19Figure 8.2: Aft Portion of the Scale Model Seawaysized Bulk Carrier –Inverted Side View 205
1. IntroductionThe BallastFree Ship Concept has been recently invented [US Patent #6694908 2004] andinvestigated [Kotinis et al. 2004, Kotinis 2005, Ballast Water News 2004] at the University ofMichigan. Even though the feasibility of the concept was demonstrated, the aforementionedanalysis was limited by its required comprehensive research scope and associated budget. Thus,it was only feasible to support model testing that utilized an existing model. Although the vesseltype of greatest interest for the <strong>Great</strong> <strong>Lakes</strong> nonindigenous aquatic species introduction problemis the Seawaysized bulk carrier, the best available model was of a relatively finer, higherspeedbargecarrying Lighter Aboard Ship (LASH) vessel. This existing model was modified to utilizea more conventional stern, but the model test results were not directly applicable to the Seawaysizedbulk carriers studied in detail in the rest of the research effort.The current research focuses on the design of a typical Seawaysized bulk carrier and theconstruction of a scaled model to be utilized in subsequent towing tank experiments. This modelhas already been procured and is expected to be delivered to the University of Michigan at theend of October, 2006.A major part of the initial hydrodynamic analysis that was performed on the modifiedLASH vessel was based on the shipspecific Computational Fluid Dynamics (CFD) codeSHIPFLOW ® [Flowtech Int. 1998], which has been shown to have significant limitationsregarding the prediction of the important viscous flow near the stern.In the current research, the external flow around the BallastFree bulk carrier has beeninvestigated numerically using FLUENT ® [Fluent 2005]. These external flow results have beenutilized to obtain the necessary boundary conditions for numerical simulation (also inFLUENT ® ) of the water flow in the longitudinal ballast trunks. The internal flow was simulatedin order to estimate the flow rate scaling factor needed in preparation for the subsequent towingtank experiments.In the next stage of this research, the model will be utilized for towing tank experiments inorder to study, in more detail, the hydrodynamic impact of the BallastFree Ship Concept. Theexperimental and numerical hydrodynamic investigation, combined with an optimizationprocedure, is expected to lead to a design solution that could offer a net savings in RequiredFreight Rate (RFR) relative to alternate ballast water treatment methods and approaches. Thenumerical solution will be refined and validated through the scale model testing.6
2. BackgroundThe initial Sea Grant supported development of the BallastFree Ship Concept was reportedin a paper before the Annual Meeting of the Society of Naval Architects and Marine Engineers inWashington, DC, on October 2004 [Kotinis et al. 2004]. Overall, the investigation of theBallastFree Ship Concept has shown that it provides a viable alternative to the addition of costlyballast water treatment systems in order to meet the evolving performance requirements forballast water treatment. The concept essentially eliminates the transport of foreign ballast water.This should be more effective than current treatment methods in reducing the potential for thefurther introduction of nonindigenous aquatic species into the <strong>Great</strong> <strong>Lakes</strong> and coastal waters.Furthermore, it should be equally effective as international requirements extend below the 50micron range [IMO 2004].The traditional approach to ballast operations, since the introduction of steam machinery,has been the use of water ballast to increase the weight of the vessel in the light cargo condition.A paradigm shift in thinking would be to view the ballast condition as a change of buoyancyrather than an addition of weight in order to get the vessel to its safe ballast drafts. Such a shiftin thinking led to the invention of the BallastFree Ship Concept [US Patent #6694908 2004].In this concept, the traditional ballast tanks are replaced by longitudinal, structural ballasttrunks that extend beneath the cargo region of the ship below the ballast draft. The arrangementof an equal capacity conventional Seawaysize bulk carrier is shown on the left in Fig. 2.1; thearrangement of a BallastFree Ship Concept Seawaysize bulk carrier is shown for comparisonon the right. In this example, the three ballast trunks per side are connected to the sea through aplenum at the bow and a second plenum at the stern. Typical trunk and plenum arrangements atthe bow and stern of the vessel are illustrated in Fig. 2.2 and 2.3, respectively. These trunks areflooded with seawater to reduce the buoyancy of the vessel in the ballast condition in order to getthe vessel down to its ballast drafts. Since there is a natural hydrodynamic pressure differentialcreated between the bow region and the stern region of a ship due to its motion through thewater, a slow flow is induced in these open ballast trunks. This ensures that the ballast trunks arealways filled with slowlymoving “local seawater.” This will essentially ensure that there is notransport nonindigenous aquatic species across the globe. Therefore, the vessel becomes foreign“ballastfree” from the traditional viewpoint.When the ballast voyage is completed, the ballast trunks can be isolated from the sea byvalves and then pumped dry using conventional ballast pumps. The need for costly ballast watertreatment equipment or ballast water treatment chemicals would, thus, be eliminated. Thisapproach would also be equally effective for biota smaller than 50 microns. During the full loadcondition or any condition where ballast is not necessary, the double bottom ballast trunks can besegregated utilizing sluice gate valves. This is needed to provide the vessel adequate damagesurvivability.In order to provide adequate intact stability, equivalent damage survivability, equivalentcargo capacity, etc., the entire vessel design needs to be developed to support this concept ofballast operations as illustrated in Fig. 2.1. The ship requires a higher tank top in order to locateenough ballast trunk volume below the ballast draft and requires a greater hull depth in order to7
maintain the vessel’s capacity to carry light cargos, such as grain. The BallastFree ShipConcept also includes features to minimize the buildup of sediment within the ballast trunks andfacilitate their required cleaning; i.e., easier to clean 2.4 m high ballast trunks, elimination of thelower part of the floors next to the shell, etc.Figure 2.1: Typical Seawaysize Bulk Carrier (left) andBallastFree Concept Bulk Carrier (right)As noted, the recent Sea Grant sponsored research on the development of the BallastFreeShip Concept was limited by its required comprehensive research scope and associated budget.For budgetary reasons, it was only feasible to support model testing that utilized an existingmodel. Although the vessel type of greatest interest for the <strong>Great</strong> <strong>Lakes</strong> nonindigenous aquaticspecies introduction problem is the Seawaysize bulk carrier, the best available model was of arelatively finer, higherspeed bargecarrying Lighter Aboard Ship (LASH) vessel. This existingmodel was modified to utilize a more conventional stern, but the model test results were notdirectly applicable to the Seawaysize bulk carriers studied in detail in the rest of the researcheffort.8
Figure 2.2: Typical Forward Plenum and Collision Bulkhead ArrangementFigure 2.3: Typical Aft Plenum ArrangementBudget restrictions in the initial investigation phase also required that the model tests belimited to a single system design for a single existing model. There was no opportunity tooptimize the hydrodynamic design of the system to minimize the economic impact of the BallastFree Ship Concept design. Model tests and CFD simulations using a modified LASH vessel hullshowed that the specific ballast intake and discharge locations and method tested in the initialinvestigation resulted in a modest 2.2% increase in resistance but a more significant 7.4%increase in the required propulsion power. This specific result assumed a change in the ballastwater within the ballast trunks once every two hours, which would meet the environmental intentof the BallastFree Ship Concept. The large power increase could result in an undesirable enginesize increase and would result in fuel cost penalties. In that investigation, it was concluded thatfurther hydrodynamic optimization could eliminate most, if not all, of this significant addedpower requirement.9
3. General Description of Design ProcedureA typical Seawaysized bulk carrier was designed using data from similar vessels. Theprototype vessels were the Isa bulk carrier owned by the Polish Steamship Company (PZMPolsteam) as shown in Figure 3.1 and a recent bulk carrier class designed by the Jiangnanshipyard in China.Figure 3.1: Polsteam Seawaysized Bulk Carrier IsaThe vessel hydrostatic data match the data of typical bulk carriers of the same size. Theservice speed was assumed to be 14.5 knots, which results in a Froude number of 0.175. Thespeed of the vessel when in ballast draft was assumed to be <strong>15</strong>.5 knots, which results in a Froudenumber of 0.185. The stern region was designed to accommodate specific propellerhullclearances. For this purpose, the Det Nordske Veritas (DNV) requirements were utilized. Themain particulars of the BallastFree Bulk Carrier are presented in Table 3.1.The model testing of interest will be performed with the vessel at the ballast draft. Aconservative heavy weather ballast draft corresponds to a value of 40% of the summer load lineat the forward perpendicular and 70% at the aft perpendicular. These values were utilized in thecurrent study. The vessel particulars at this ballast condition are listed in Table 3.2.10
Table 3.1: BallastFree Bulk Carrier Main ParticularsWaterline length (m) 195.5Length between perpendiculars (m) 192.0Maximum beam (m) 23.76Depth to main deck (m) 16.0Fullload draft (m) 10.70Block coefficient 0.835Prismatic coefficient 0.837Waterplane area coefficient 0.909Midship section coefficient 0.998Fullload displacement (metric tons) 42,546Wetted surface area (m 2 ) 7673Table 3.2: BallastFree Bulk Carrier Ballast ConditionWaterline length (m) 189.5Maximum beam (m) 23.76Draft at F.P. (m) 4.28Draft at A.P. (m) 7.49Speed (knots) <strong>15</strong>.5Reynolds number (fresh water) 1.35*10 9The hull of the BallastFree Bulk Carrier has been designed in Maxsurf [Formation DesignSystems 2003]. The vessel lines are illustrated in Figures 3.2 through 3.4.Figure 3.2: BallastFree Bulk Carrier Body Plan11
Figure 3.3: BallastFree Bulk Carrier Profile ViewFigure 3.4: BallastFree Bulk Carrier Plan View12
4. Model Construction ConstraintsThe construction of a ship model to be tested in a towing tank needs to comply with certainrequirements that stem from the experimental procedure and the available testing equipment.The models tests will be performed at the towing tank of the University of Michigan MarineHydrodynamic Laboratory (MHL). The towing tank dimensions are shown in Table 4.1.Table 4.1: MHL Towing Tank DimensionsLength (m) 109.7Width (m) 6.70Depth (m) 3.20Tank crosssectional area (m 2 ) 21.44A significant constraint in the experimental procedure is the interference between the sidewalls and bottom of the tank and the pressure field and wave system generated by the motion ofthe model. This is usually termed “blockage effect” and results in total resistance measurementerrors (artificial increase). A general guideline is that the model crosssectional area be at most1/200 of the tank crosssectional area (in terms of the tank beam and water depth). Nevertheless,if the operating Froude number is relatively low (less than 0.20), the wave resistance is not alarge proportion of the total resistance, and thus correction factors can be introduced in thecalculation procedure when large models are utilized.If the vessel under investigation normally operates in deep water, a similar situation needsto be simulated in the towing tank experiments. Operation in shallow water is generallyconsidered to increase the resistance. A general guideline is that the ratio of the square root ofthe model crosssectional area over the tank water depth should not exceed a value of 0.25.13
5. Model Propeller Selection and Geometric Scale FactorA very significant parameter in determining the geometric scale factor of the model is thesize of the available stock propellers. Two propellers from the MHL stock (No.10 and No.23)were investigated during the propulsion analysis. The thrust requirements were based onHoltrop’s resistance and propulsive coefficients estimates [Holtrop 1984]. The total resistance ofthe BallastFree bulk carrier at the fullload condition was estimated at 573 kN. The propulsivecoefficients were also estimated using Holtrop’s empirical formulas. These were utilized asinput to the propeller analysis.The corresponding nondimensional thrust and torque versus coefficient of advance (Kt,Kq – J) charts of the propellers were utilized for the analysis. The results showed that the modelpropeller No.23 provides a higher propulsive efficiency (0.55) assuming a fullscale propellerdiameter of 6.0 m. The corresponding value of the geometric scale ratio is l = 37.92, which iswithin the acceptable range, based on the design constraints. This will result in a modelwaterline length of approximately 5 m. The amount of back cavitation is expected to be wellbelow the upper limit for merchant ships. A summary of the stock propeller No. 23characteristics is presented in Table 5.1. The model characteristics are demonstrated in Table5.2.Table 5.1: MHL No. 23 Stock Propeller CharacteristicsDiameter (in.) 6.229Pitch/Diameter (P/D) ratio 1.08Number of blades 4Expanded area ratio ( A E /A O ) 0.55Hub diameter (in.) 1.226Hub length (in.) 1.355MaterialBrassTable 5.2: BallastFree Bulk Carrier Model CharacteristicsGeometric scale factor l 37.92Waterline length (m) 5.00Maximum beam (m) 0.627Average draft (m) 0.<strong>15</strong>5F.P. draft (40% F.L.) 0.113A.P. draft (70% F.L.) 0.198Wetted surface area (m 2 ) 5.34Speed (m/s) 1.295Reynolds number (fresh water) 5.78*10 6The extent of laminar flow along the model length that corresponds to theaforementioned scale factor value and model speed is 9% (of the model length). The attachmentof tripwires or sandstrips to the model bow will be used to stimulate turbulence at a point closerto the forward stagnation point as expected at full scale.14
6. Computational Fluid Dynamics (CFD) Analysis of the External FlowThe commercial CFD code FLUENT ® was utilized to study the external flow around themodel of the BallastFree Bulk Carrier in the ballast condition. The model scale speed is 1.295m/s, which is calculated assuming Froude scaling. The obtained solution has been demonstratedto be grid–independent. The Realizable ke turbulence model was utilized in the calculations.The flow close to the hull was approximated with wall functions. The computational gridconsists of a hybrid mesh with 1,507,546 cells. The investigated flow corresponds to a doublemodelsolution; the freesurface is ignored and the waterplane is considered to be a plane ofsymmetry.The converged CFD solution can be utilized to obtain the hull resistance, which consists ofthe friction drag and the pressure (form) drag for this configuration. The friction drag around aship hull is usually estimated through a semiempirical formula adopted by the InternationalTowing Tank Conference (ITTC). The computed value is extremely close to the semiempiricalone. The form drag corresponds to only a small fraction of the total drag. The utilization of adoublemodel flow allows for the computation of the form factor, which is calculated as the ratioof the total drag (excluding the wave drag) to the ITTC friction drag estimate. The computedvalue is reasonable for the ship in the ballast condition. A summary of the results is presented inTable 6.1.Table 6.1: BallastFree Bulk Carrier Model Resistance CalculationsFriction drag coefficient (FLUENT) 3.32*10 3Friction drag coefficient (ITTC) 3.31*10 3Pressure (form) drag coefficient (FLUENT) 0.45*10 3Total drag coefficient (FLUENT) 3.77*10 3Form factor k 0.139An important aspect of the BallastFree Ship Concept is the location of the water inletand discharge plena. The steady pressure differential between the two locations will generate aslow water flow in the longitudinal ballast trunks. The volume flow rate is proportional to thesquare root of the pressure differential. It was demonstrated [Kotinis 2005] that the higher theflow rate the more effective (less time required) the flushing of the trunks. The computedpressure contours in the bow and stern region of the BallastFree Bulk Carrier are shown in Figs.6.1 and 6.2, respectively.The pressure contours in the bow region reveal that the pressure is high in a small regionnear the bulbous bow. However, starting at the forward perpendicular, the flow is relativelysmooth with low pressure and pressure gradient values. This is also observed in Fig. 6.3, wherethe velocity vectors in the bow region are plotted. The downward flow direction reduces theheight of the bow wave. The only significant drawback is with respect to the location of the bowplenum, as the positive pressure is limited to a small area starting at the stagnation point andextending aft to about 6% of the waterline length.<strong>15</strong>
Figure 6.1: Pressure Contours Velocity Vectors at the Bow of theBallastFree Bulk Carrier ModelFigure 6.2: Pressure Contours at the Stern of the BallastFree Bulk Carrier ModelThe stern region is governed by suction pressure, which has a peak near the bilge just aheadof the stern bulb. A significant positive pressure region exists above the stern bulb. Noseparation is observed in the velocity vector plot in Fig. 6.4. The location of the stern plenumwill be close to the aft end of the engine room (around x/L = 0.92) and above the inner bottom(2.4 m from the keel).16
Figure 6.3: Velocity Vectors at the Bow of the BallastFree Bulk Carrier ModelFigure 6.4: Velocity Vectors at the Stern of the BallastFree Bulk Carrier Model17
7. Computational Fluid Dynamics (CFD) Analysis of the Internal Ballast Trunk FlowThe internal trunk flow was investigated in both full and model scale. A typical trunkconfiguration [Kotinis 2005] was generated and the corresponding pressure boundary conditions,as calculated from the external flow simulations, were imposed on the inlet/outlet plena. Theforward plenum was located at a point about x/L = 0.04 between the 0.2 and 0.35 designwaterlines. The aft plenum was located at a point near x/L = 0.925 between the 0.3 and 0.45design waterlines.The pressure distribution was assumed to be the same in both full and model scale. Thisassumption is justified by the fact that the Reynolds number is relatively high in both cases andthe body at ballast draft is relatively streamlined (low form drag). The computational gridconsists of a hybrid mesh with 705,9<strong>15</strong> cells. The trunks were assumed to be filled with ballastwater and the natural trunk flushing was initiated by new ballast water entering the systemthrough the inlet plenum. The volume flow rate at the inlet and outlet plena was monitored untilconvergence to a constant value was observed. The unsteady flow solver in FLUENT wasutilized with a time step size of one second (1s). The solution at each time step was consideredto have converged when the residuals dropped by four orders of magnitude. The computationalmodel geometry of the double bottom structure is shown in Fig. 7.1.Figure 7.1: Computational Model Geometry of Double Bottom StructureThe average volume flow rate at full scale is 0.969 m 3 /s. The model scale solution has anaverage flow rate of 1.02*10 4 m 3 /s. The corresponding ratio is approximately 9,500. This resultis in agreement with the scaling factor between the ship scale flow rate and the model scale flowrate, Q s = Q m l 5/2 , theoretically derived in the initial investigation of the BallastFree ShipConcept based on Froude scaling. This scaling assumed that the flow rate scaling should beproportional to the scale factor l raised to the 2.5 power. The corresponding exponent of thegeometric scaling factor based on the numerical CFD results was approximately 2.52.18
8. Model ConstructionThe model of the SeawaySized Bulk Carrier for use in subsequent hydrodynamicoptimization testing has been contracted for construction by F.M. Pattern Works of NorthVancouver, BC. This is the primary deliverable of the project and its procurement representsapproximately half of the project funding. The model is under construction at the time of thiswriting and delivery of the completed 5 m scale model is expected near the end of October 2006.Progress photographs of the glue up of the aft portion of the hull are shown in Figs. 8.1 and 8.2.Figure 8.1: Aft Portion of the Scale Model SeawaySized Bulk Carrier –Inverted Stern Quarter View19
Figure 8.2: Aft Portion of the Scale Model Seawaysized Bulk Carrier –Inverted Side View20
9. Potential Economic Impacts of the <strong>Research</strong> ResultsThe hydrodynamic optimization of the BallastFree Ship Concept is expected todemonstrate that there is only a small, if any; propulsion power penalty associated with theconcept. In that case, it should result in a net Required Freight Rate savings relative to alternateballast water treatment methods such as filtration and UV treatment of about 0.20 $/ton of cargo.The concept should also provide superior protection from the further introduction ofnonindigenous aquatic species into the <strong>Great</strong> <strong>Lakes</strong> and coastal waters.21
10. ReferencesBallast Water News (2004) "The BallastFree Ship Fact or Fancy?" Ballast Water News, GlobalBallast Water Management Program, IMO, 17, AprilJune.Flowtech International AB (1998) “SHIPFLOW 2.4 User’s Manual.”Fluent (2005) “FLUENT 6.2 User’s Manual,” Fluent Inc., Lebanon, NH.Formation Design Systems Pty (2003) “MAXSURF Windows Version 9.6 User’s Manual.”Holtrop, J. (1984) “A Statistical ReAnalysis of Resistance and Propulsion Data,” InternationalShipbuilding Progress, 31363, November.IMO (2004) “International Convention for the Control and Management of Ships’ Ballast Water& Sediments,” Diplomatic Conference, February, London.Kotinis, M., Parsons, M. G., Lamb, T. and Sirviente, A. (2004) “Development and Investigationof the BallastFree Ship Concept” Transactions SNAME, 112, pp. 206240.Kotinis, M. (2005) “Development and Investigation of the BallastFree Ship Concept” Ph.D.Dissertation, University of Michigan, Department of Naval Architecture and MarineEngineering.U. S. Patent #6694908 (2004) “Ballast Free Ship System,” U. S. Patent and Trademark Office,Washington, DC.22
Expanding Regional Freight Information Resourcesfor the Upper Midwest:The <strong>Great</strong> <strong>Lakes</strong> <strong>Maritime</strong> Information Delivery SystemPeter S. Lindquist, Ph.D.Department of Geography and PlanningIntermodal Transportation <strong>Institute</strong>Mark A. Vonderembse, Ph.D.Intermodal Transportation <strong>Institute</strong>University of ToledoSeptember 29, 2006<strong>Research</strong> funded in part by the<strong>Great</strong> <strong>Lakes</strong> <strong>Maritime</strong> <strong>Research</strong> <strong>Institute</strong>This report represents the results of research conducted by the authors and does not necessarily representthe views or policies of the <strong>Great</strong> <strong>Lakes</strong> <strong>Maritime</strong> <strong>Research</strong> <strong>Institute</strong>. This report does not contain astandard or specified technique. The authors and the <strong>Great</strong> <strong>Lakes</strong> <strong>Maritime</strong> <strong>Research</strong> <strong>Institute</strong> do notendorse products or manufacturers. Trade or manufacturers’ names appear herein solely because they areconsidered essential to this report.
Table of Contents___________________________________________________________ChapterPageIntroduction . . . . . . . . . . . . . . . . . . . . . . . . . . . . . . . . . . . . . . . . . . . . . . . . . . . . . . . . . . . . . . . . . . 1Project Background . . . . . . . . . . . . . . . . . . . . . . . . . . . . . . . . . . . . . . . . . . . . . . . . . . . . . 2Data Acquisition . . . . . . . . . . . . . . . . . . . . . . . . . . . . . . . . . . . . . . . . . . . . . . . . . . . . . . . . . . . . . . . 3A New Perspective on Information Delivery . . . . . . . . . . . . . . . . . . . . . . . . . . . . . . . . . . . . . . . . 6Purpose and Goals of the Information Delivery System . . . . . . . . . . . . . . . . . . . . . . . . . 6Information Delivery Priorities for System Users . . . . . . . . . . . . . . . . . . . . . . . . . . . . . . 7Recommendations for Data Acquisition . . . . . . . . . . . . . . . . . . . . . . . . . . . . . . . . . . . . . . 8Looking Ahead: Next Steps . . . . . . . . . . . . . . . . . . . . . . . . . . . . . . . . . . . . . . . . . . . . . . . . . . . . . 10Specific Tasks . . . . . . . . . . . . . . . . . . . . . . . . . . . . . . . . . . . . . . . . . . . . . . . . . . . . . . . . . . . 10Partnerships . . . . . . . . . . . . . . . . . . . . . . . . . . . . . . . . . . . . . . . . . . . . . . . . . . . . . . . . . . . . 11A <strong>Great</strong> <strong>Lakes</strong> <strong>Maritime</strong> Exchange . . . . . . . . . . . . . . . . . . . . . . . . . . . . . . . . . . . . . . . . . . 11Conclusion . . . . . . . . . . . . . . . . . . . . . . . . . . . . . . . . . . . . . . . . . . . . . . . . . . . . . . . . . . . . . . . . . . . . 12References Cited . . . . . . . . . . . . . . . . . . . . . . . . . . . . . . . . . . . . . . . . . . . . . . . . . . . . . . . . . . . . . . . 13APPENDIX A . . . . . . . . . . . . . . . . . . . . . . . . . . . . . . . . . . . . . . . . . . . . . . . . . . . . . . . . . . . . . . . . . A1Schematic Diagram of the Structure of theCurrent Midwest FreightView DatabaseAPPENDIX B . . . . . . . . . . . . . . . . . . . . . . . . . . . . . . . . . . . . . . . . . . . . . . . . . . . . . . . . . . . . . . . . . B1Sample of Map Output from Midwest FreightViewAPPENDIX C . . . . . . . . . . . . . . . . . . . . . . . . . . . . . . . . . . . . . . . . . . . . . . . . . . . . . . . . . . . . . . . . . C1Code Specifications for <strong>Great</strong> <strong>Lakes</strong> Commercial DocksAPPENDIX D . . . . . . . . . . . . . . . . . . . . . . . . . . . . . . . . . . . . . . . . . . . . . . . . . . . . . . . . . . . . . . . . . D1Meeting Participants in the <strong>Great</strong> <strong>Lakes</strong> Data WorkshopDetroit, Michigan, June 9, 20062
____________________________________________________Expanding Regional Freight Information Resources for the Upper Midwest:The <strong>Great</strong> <strong>Lakes</strong> <strong>Maritime</strong> Information Delivery SystemExecutive Summary____________________________________________________This project marked the beginning of a longterm endeavor to develop and manage a comprehensive datarepository and information clearinghouse for the maritime industry in the <strong>Great</strong> <strong>Lakes</strong>. The system isenvisioned to facilitate the acquisition, storage, management, analysis and exchange of data betweenanalysts and decisionmakers within the industry. This system will thus serve as a resource for publicpolicy decisions and for drawing the necessary link between maritime freight movements, economicviability, and environmental quality throughout the <strong>Great</strong> <strong>Lakes</strong> and St. Lawrence Seaway. As such, thesystem will serve as a central focus for diverse interests within the industry to support the promotion ofsustainable maritime transportation in the region.This project was originally proposed to focus on expanding an existing detailed GISbased multimodalregional freight data reporting system named Midwest FreightView (MWFV). However, this approach wasmodified significantly over the course of the project based on interactions with representatives of themaritime industry in the <strong>Great</strong> <strong>Lakes</strong> Region. Stakeholders in the region attending the June 9 <strong>Great</strong> <strong>Lakes</strong>Data Workshop in Detroit rejected MWFV as the only component of the information delivery system infavor of a more diversified approach that incorporated webbased dissemination of prepared information inthe form of maps, reports, tables and graphics. While the core of the data repository would still reside in thecomprehensive MWFV GIS, the main user interface and information delivery system would be located on amore “user friendly” web page. The project team thus responded by amending the design of the system tomeet the needs of our partners in the industry and will be unveiling the new web page for the system inNovember, 2006.The main objective originally envisioned for MWFV was to generate and maintain a longterm databaseand data distribution system that would be available for state transportation agencies, regional planningagencies, port authorities and economic development organizations, as well as other interesteddecisionmakers and stakeholders within the region. This objective still remains as an important componentof the work completed in the first phase of this project. Much of the data acquired in the first phase of thisproject came from existing sources—both commercial and government. The data are currently beingstored on designated server space in the central repository at the GISAG Center at The University ofToledo and are undergoing incorporation into MWFV. Specific data assembled into this centralized datarepository currently include the following:1. Intrastate Employment patterns for each commodity type by SIC, NAICS, (DemographicsPlus, Inc. Business Counts Database);2. Population and Socioeconomic data representing Market Demand within the region3. Port Locations—U.S. (BTS National Transportation Atlas);4. Dock Locations (Army Corps of Engineers) and attributes:5. Waterway Network—<strong>Great</strong> <strong>Lakes</strong> and Inland Waterways (Army Corps of Engineers)4
6. Port Operations Data such as Tonnages, Commodities transshipped (Lake Carriers Assn.),Vessels Serviced, Equipment, etc.7. Baseline 2002 commodity flows through the Saint Lawrence Seaway and <strong>Great</strong> <strong>Lakes</strong> Systemobtained from the FHWA Freight Analysis Framework estimated from 2002 Commodity FlowSurvey Data. This data set provided the research team with a skeleton framework upon whichto add subsequent flow data.Other data dealing with dock locations and related operational attributes were manually entered into thedatabase. This process was the most labor intensive and time consuming of the data assembly tasks. Mostof this information has been compiled for docks on the American side of the <strong>Great</strong> <strong>Lakes</strong>. Thecorresponding information for the Canadian side of the <strong>Great</strong> <strong>Lakes</strong> is in its final stages of compilation.Dock identification codes were standardized within the database and documented.The data listed above will reside in the data reporting system built on a Citrix Metraframe installation.Currently a specialized ArcView GIS application provides the user interface. Users can access MWFVwith a web browser and Internet connection; all operations are carried out on the Toledo Server—the user’scomputers simply act as a terminal. The site is thus able to accommodate a wide range of users thatextends between casual browsers and “basic mappers” to more experience GIS and database users.The most recent activities undertaken have been to start compiling information on the various types ofcommodities transported on the <strong>Great</strong> <strong>Lakes</strong>, with an emphasis on observing the origins and destinations ofthese commodities, flow routes, tonnages, etc. In addition, the project team will investigate the acquisitionof AIS data to track vessel movements. Implementation of this technology will be actively pursued in thenext phase of the project.In addition to the data assembly operations, the project team set about to design a more generalizedinformation delivery system following our discussions with industry representatives at the June 9 <strong>Great</strong><strong>Lakes</strong> <strong>Maritime</strong> Data Workshop in Detroit. Workshop participants readily agreed that the data deliverysystem must serve as an accurate, current, comprehensive and userdriven data resource that will be used toinform public policy decisionmakers as to the value and utility of the <strong>Great</strong> <strong>Lakes</strong> <strong>Maritime</strong> TransportationSystem (GL MTS). Of particular importance in reporting to public officials are:• Jobs• Economic impact of <strong>Great</strong> <strong>Lakes</strong> shipping• Safety issues associated with diverting freight traffic to GL MTS• Environmental impacts/benefits compared to other modes• Shipper savings associated with GL MTS• Congestion effects of other modes in comparison to GL MTS• Competition effects of <strong>Maritime</strong> Transportation and rate increases in other modes• Shift in intermodal connections and transshipment costs (e.g., “full cost” studies –pavement damage, fuel savings, crashes, etc.,• The value of shipping to states, cities regions, etc.Workshop participants discussed additional data needs for regional stakeholders that require data tofacilitate projections and forecasts for freight movements under alternative scenarios involving alternativemodes or intermodal movements. Regulatory impacts were also emphasized in the discussion along withimproved coordination of public investments over the entire system to benefit all stakeholders within theregion despite their location or jurisdiction.5
Workshop participants also effectively argued that any system that requires a significant amount of trainingand practice would not be used as heavily as a more “user friendly” system consisting of prepared graphs,maps, bullet points, tables, and other features such as prepackaged reports in basic standard formats such asAnnual Reports, Executive Summaries, and reports of studies completed by analysts who used data fromthe repository. The project team responded to this point by proposing to develop a system that offers avariety of products and functions among varying degrees of expertise required by users. These include:• A detailed data repository for vessel movements, port functions, commodity flows, economicactivities and environmental impacts, etc.• A GIS data viewer for advanced users to view and analyze a variety of data• An information delivery site for maps, tables, graphics, text and other features• A data exchange to support user inquiries and furnish information on demand.• Assemble data and report information among different Geographic areas of impacts andjurisdictions (e.g., states and provinces, congressional districts, cities, counties, ports, etc.)• Establish a communication link within the system (e.g., email access) for regional stakeholdersto request specific information to be posted on the site. This function was agreed upon asessential if the information delivery was to be successful• Establish a system for data exchange to analysts in maritime industry agencies andorganizations; also develop a site in the system for analysts within the region to publish theresults of their analysis—particularly with regard to public policy issues of interest to the <strong>Great</strong><strong>Lakes</strong> <strong>Maritime</strong> Industry• Begin to develop a library function in the form of a data clearinghouse that reviews andsummarizes data from diverse sourcesboth public and commercialand provide links forusers to branch to from the site. The result of which is to provide the <strong>Great</strong> <strong>Lakes</strong> <strong>Maritime</strong>Industry with a comprehensive centralized resource for data and information. An example ofsuch a link would be for taxes, fees, and other costs; however, this component would notrepresent a core function of the data resource. It was further suggested that the site become agateway to maritime agencies (e.g., Coast Guard, USACE, etc.)All of these functions have been adopted into the design of the prototype information delivery site to beopened in November, 2006.One of the objectives of this project that was discussed at the June 9 meeting concerns the longtermviability of this information delivery resource. Eventually this data repository and delivery system must beable to sustain itself financially as other members of the maritime industry in this region. To this end, theproject team has begun to explore the establishment of a <strong>Great</strong> <strong>Lakes</strong> <strong>Maritime</strong> Exchange (GLMX) in theform of a nonprofit 501(c)(6) organization that would be financed through subscription fees by its partnersin the industry. This exchange could partner with MISNA (<strong>Maritime</strong> Information Services of NorthAmerica), an umbrella organization of maritime exchanges in the United States and British Columbia. Theprincipal investigator on the project team was invited to the MISNA National Meeting in Portland, Oregonin September, 2006 to gather more information on maritime exchange activities in North America. Thisapproach shows significant promise.The vision for the <strong>Great</strong> <strong>Lakes</strong> <strong>Maritime</strong> Information Delivery System Project evolved over the course ofthe project to produce a multidimensional system that will support a wider array of functions that includedata storage, delivery of prepared documents, GIS functionality, and a clearinghouse for information overthe entire industry. The project team will solicit feedback and suggestions for continuous improvement ofthe information delivery system; communication with the industry will be a major objective as thisresource evolves in the coming years.6
___________________________________________________Expanding Regional Freight Information Resources for the Upper Midwest:The <strong>Great</strong> <strong>Lakes</strong> <strong>Maritime</strong> Information Delivery System___________________________________________________IntroductionThis project marked the beginning of a longterm endeavor to develop and manage a comprehensive datarepository and information clearinghouse for the maritime industry in the <strong>Great</strong> <strong>Lakes</strong>. The system isenvisioned to facilitate the acquisition, storage, management, analysis and exchange of data betweenanalysts and decision makers within the industry. This system will thus serve as a resource for publicpolicy decisions and for drawing the necessary linkages between maritime freight movements, economicviability, and environmental quality throughout the <strong>Great</strong> <strong>Lakes</strong> and St. Lawrence Seaway. As such, thesystem will serve as a central focus for diverse interests within the industry to support the promotion ofsustainable maritime transportation in the region.This project was originally proposed to focus on expanding an existing detailed multimodal regional freightdata reporting system named Midwest FreightView (MWFV) by incorporating maritime transportation data.It was argued that significant increases in highway freight traffic volumes have produced increasingpressures on this system, resulting in the necessity to examine every transportation alternative to relieve thispressureespecially by maritime transportation. This system would also serve as an effective tool forevaluating intermodal transportation opportunities in the <strong>Great</strong> <strong>Lakes</strong> Region; it can be used to model flowsbetween modes to improve the flow of commodities within the region and to minimize environmentalimpacts. Finally, it was envisioned that expanding MWFV would enable stakeholders in the region to relatemaritime traffic flows to the regional economy of the Midwest and adjacent Canadian provinces.While the original objective of this project to develop a detailed maritime database that would be added tothe existing MWFV system, the project team began to see the necessity for an expanded effort in thedelivery of information from this resource. The scope of this project thus evolved over time as the projectteam interacted with stakeholders in the region. The watershed event in this change of focus took place atthe June 9 <strong>Great</strong> <strong>Lakes</strong> Data Workshop in Detroit. A significant number of the participants at the Workshopexpressed greater interest in having access to a wider array of prepared maps, reports, tables and graphics onthe project web site than a comprehensive GIS as the core of the information delivery system. The projectteam responded by revising the design of the system to meet the needs of our partners in the industry. Thisresulted in fewer deliverables in terms of raw data in the database, but a clearer picture of what an effectiveinformation delivery system will be for this industry. This revised vision for the regional informationdelivery system therefore forms the basis for a significant portion of this report.While the project team will not abandon our development of the GIS database as the core element of thedatabase management portion of the project, our emphasis in the delivery of data will shift to thedevelopment of a user interface that distributes the wider a variety of resources requested by users.The project team gathered additional insight as work progressed in this effort. In particular, it became clearthat the data currently stored and managed in the database needed to be enhanced through realtimeacquisition of vessel locations using AIS technology, compilation of detailed regional employment data bysector, and collection of detailed commodity flows by vessel. Data from these sources will be essential ifstakeholders desire an uptodate, reliable and effective resource that truly reflects the level of activitycurrently working in the lakes. Our stakeholders emphasized the importance of accurate and current7
information to share with government officials in the area of public policy. It can also be argued that suchdata would facilitate intermodal connectivity at ports if short sea shipping is to be a viable alternative indiverting freight off of congested highways. Such data would also be useful in our expanded efforts withthe Upper Midwest Freight Coalition to draw the link between transportation and the regional economy andin gaining a clearer understanding of patterns of freight flows within the region.Finally, this project report ends with a proposal for the establishment of a <strong>Great</strong> <strong>Lakes</strong> <strong>Maritime</strong> Exchangeusing the model developed by MISNA (<strong>Maritime</strong> Information Services of North America). Such anexchange would provide the foundation for continued data collection, management and exchange in the<strong>Great</strong> <strong>Lakes</strong> to support longterm sustainable maritime transportation.Project Background. As stated above, the original intent of this project was to expand MWFV to includemaritime transportation. This System was well positioned to carry out the task of assembling, storing andmanaging maritime data for the <strong>Great</strong> <strong>Lakes</strong> system. A major effort had already been undertaken in thedevelopment of MWFV. At present, MWFV is a distributed GIS developed to track patterns of intermodalfreight movements within a seven state area of the upper Midwest and two provinces of Canada. Theprincipal objectives of MWFV were threefold: 1) to provide a means to spatially relate existing andprojected freight flows to the regulatory environment and the physical capacity of the infrastructure, 2) totrack trends in freight movement over time and space, and 3) to link freight movement to populationcharacteristics and economic activity within the region. Users can take advantage of the GIS locationbasedquery and selection capabilities as well as mapping functions to illustrate these relationships. In addition,the system was designed to expand into providing advanced analysis capabilities such as vehicle routing andtravel time computations to evaluate the effectiveness of the network to support freight movement. As aresult, the system has begun to develop into an effective tool for economic development planning as a meansto measure accessibility to markets, identify bottlenecks in the network that hinder freight flows, and foridentifying feasible locations for warehousing, manufacturing, retail and intermodal connection facilities.The system displays data on highways, railroads, intermodal connections, and air transportation. However,little data are currently assembled for maritime transportation. The structure of the MWFV database ispresented in Appendix A.The system was developed as part of the Upper Midwest Freight Corridor Study, a cooperative venturebetween seven Midwestern state departments of transportation and the Midwest Region UniversityTransportation Center (MRUTC) at the University of Wisconsin, The University of IllinoisChicago, andThe University of Toledo. The data reside entirely in The GISAG Center at The University of Toledo andare accessed as part of a distributed GIS.One of the main objectives originally envisioned for MWFV was to generate and maintain a longtermdatabase and data distribution system that would be available for state transportation agencies, regionalplanning agencies, port authorities and economic development organizations, as well as other interesteddecisionmakers and stakeholders within the region. This requires ongoing efforts to furnish the most uptodatedata available from all modes in the transportation system. These data collection efforts arediscussed in detail in the next chapter.8
Data AcquisitionMuch of the data acquired in the first phase of this project came from existing sources—both commercialand government. The data are currently being stored on designated server space at the GISAG Center at TheUniversity of Toledo. These data will be added to MWFV in the Fall of 2006 when the project web page isposted. The challenge to the project team at this stage was to organize the data in such a way that allelements of the database were spatially compatible with respect to data structure format, georeferencing,scale, segmentation, and compatibility with widelyused GIS software. Specific data assembled into thecentralized data repository currently include the following:1. Intrastate Employment patterns for each commodity type by SIC, NAICS, (DemographicsPlus, Inc. Business Counts Database);2. Population and Socioeconomic data representing market demand within the region3. Port locations—U.S. (BTS National Transportation Atlas);4. Dock locations (Army Corps of Engineers) and attributes:5. Waterway Nenwork—<strong>Great</strong> <strong>Lakes</strong> and inland waterways (Army Corps of Engineers)6. Port operations data such as tonnages, commodities transshipped (Lake Carriers Assn.), vesselsserviced, equipment, etc.7. Baseline 2002 commodity flows through the Saint Lawrence Seaway and <strong>Great</strong> <strong>Lakes</strong> Systemobtained from the FHWA Freight Analysis Framework estimated from 2002 Commodity FlowSurvey Data. This data set provided the research team with a skeleton framework upon whichto add subsequent flow data as we obtain it.Please refer to Appendix B for a set of maps prepared on MWFV that display a sample of the data listedabove. Appendix B also provides an illustration of the user interface for MWFV and some of its analyticalcapabilities.While most of the data listed above have been obtained from existing digital data sources, other datadealing with dock locations and related operational attributes were manually entered into the database.This process was the most labor intensive and time consuming of the data assembly tasks. These effortshowever, yielded a data layer that displays the location of commercial docks with their associated dockdata available to be viewed. No such database exists to our knowledge. We are currently seekingpermissions to display the following characteristics for each of the docks:1. I.D. code number (please see Appendix C) 13. Operator2. Name 14. Owner3. Location <strong>15</strong>. Purpose4. Address 16. Slip length5. Phone number 17. Slip width6. County 18. Slip depth7. State/Province 19. Vessel loading equipment8. Waterway 20. Vessel loading speed9. Port 21. Vessel unloading equipment10. Mile (if located on a river) 22. Vessel unloading speed11. Latitude 23. Railway connections12. Longitude 24. Notes of interest9
Most of this information has been compiled for docks on the United States side of the <strong>Great</strong> <strong>Lakes</strong>. Thecorresponding information for the Canadian side of the <strong>Great</strong> <strong>Lakes</strong> is still in the final stages ofcompilation. An identification code system has been developed by the project team to uniquely identifythe commercial docks in this database. This code was developed because of a lack of standardization inidentification codes among agencies and firms. As this project is looking at the <strong>Great</strong> <strong>Lakes</strong> system as awhole, our ID code was designed to work for all docks on both the Canadian and US sides of the <strong>Lakes</strong>.The code is an eightdigit number system where each digit, or set of digits, represents a specific category(please see Appendix C for a detailed explanation of code numbers). The advantage of this ID system isthat each number represents something real, it is not a mere arbitrary number used for administrativefunctions. Users who understand this code system will be able to easily locate a dock and know what typesof commodities it handles. X0000000 First Digit – Country Code 0XX00000 Second & Third Digits – State/Province Code 000XX000 Fourth & Fifth Digits – Port Code 00000X00 Sixth Digit – Commodity Code 000000XX Seventh & Eight Digits – Specific Dock CodeThe data listed above are in the final stages of being merged into the MWFV data reporting site forviewing. The reporting site is best described as a file sharing data library consisting of geospatial data andnonspatial data in a usable format. Users of the site will have secured access to this repository. TechnicalSystem Specifications for the data repository are described as follows. The repository is situated on aaAppleÒ G4 XserveÒ file server with ATAboy2Ò RAID (Redundant Array of Inexpensive Disks) systemconnected to the World Wide Web (WWW) in the GISAG (Geographic Information Science and AppliedGeography Lab) at The University of Toledo. RAID LEVEL 5 is implemented for maximizing "High datareliability and Highest Transfer capacity" along with frequent data backups.The user interface for this data reporting system is built on a Citrix Metraframe installation of aspecialized ArcView GIS application. Users can access MWFV with a web browser and Internetconnection; all operations are carried out on the Toledo Server—the users’ computers simply act as aterminal. The site is thus able to accommodate a wide range of users that extends between casual browsersand “basic mappers” to more experienced GIS and database users.The original proposal submitted for this project asserted the following: “It is expected that the initialassembly, storage and delivery of the maritime component of MWFV will be completed by August 2006.However, it should be emphasized here that the longterm objective of this system is to provide a longtermregional freight observatory for the Upper Midwest. This project represents only the beginning of thisventure.” It was expected that the assembly of the data would be an ongoing process and that the initialstages of the project would involve the design and structuring of the database. These tasks are completed.We are now in the process of gathering a wider array of data. The data assembled listed in this reportrepresents the progress so far in this project.The most recent activities undertaken have been to start compiling information on the various types ofcommodities transported on the <strong>Great</strong> <strong>Lakes</strong>, with an emphasis on observing the origins and destinations ofthese commodities, flow routes, tonnages, etc. This segment of the project is in its very preliminary stageand will include an emphasis on acquiring the following data:10
1. Commodity type (SIC, NAICS) of existing freight shipped through the <strong>Great</strong> <strong>Lakes</strong> (by weightand declared value)—19992005;2. Ports of origin and destination for each commodity type—19992004;3. Establishment locations and employment by sector associated with each commodity typeshipped on the <strong>Great</strong> <strong>Lakes</strong>, (ES202 Database, Bureau of Labor Statistics (BLS), USDepartment of Labor).The major limitation in the acquisition of the data listed above is confidentiality. For example, the BLSrequires a signed waiver of any right to disclose ES202 data in disaggregate form; all data must bereported in aggregate or in derived form to avoid disclosing employment figures for any individual firm orestablishment. The same problems are going to occur when we propose to track commodity flows withinvessel movements—or even tracking individual vessels. If we are to acquire, store and manage these data,we must do so under confidentiality agreements with carriers, ports and shipping companies. We intend topursue this in the coming months. These agreements can greatly assist in the acquisition of AIS data totrack vessel movements. Implementation of this technology will be accompanied by discussions withmembers of the industry in the next phase of the project (Additional discussion of the incorporation of AISdata is included in later sections of this report).So far, the discussion in this report has been devoted to the assembly of data into a central data repositorywithin MWFV. However, the project team was also charged with the task of developing a moregeneralized information delivery system that requires very little technical training and GIS expertise on thepart of users. Representatives of the <strong>Great</strong> <strong>Lakes</strong> <strong>Maritime</strong> Industry emphasized the importance ofproviding useful information in a more generalized format that could be taken directly off of the webbaseddelivery system. In addition, industry representatives acknowledged the importance of storing andmanaging data that could be accessed and exchanged with other analysts in the industry. The results ofstudies conducted with data from the data repository could then be posted on this centralized delivery site.To date, the prototype delivery site is still in the final stages of development and will be unveiled inNovember 2006. These recommendations marked a significant departure from the approach originallyadopted by the project team. The details of this new approach are outlined in the following chapter.11
A New Perspective on Information DeliveryAs stated above, the emphasis on a purely GISbased information resource changed significantly afterdiscussions with stakeholders within the region pertaining to their data and information needs. Theobjectives for this initiative thus changed midway through the project. On June 9, 2006, The <strong>Great</strong> <strong>Lakes</strong><strong>Maritime</strong> <strong>Research</strong> <strong>Institute</strong> hosted the <strong>Great</strong> <strong>Lakes</strong> <strong>Maritime</strong> Data Workshop in Detroit. This meetingmarked the beginning of an initiative to assemble an internetbased data resource for <strong>Great</strong> <strong>Lakes</strong> Carriers,Ports and regional economic development organizations. Participants included:• US Army Corps of Engineers• American <strong>Great</strong> <strong>Lakes</strong> Ports Association• Canadian Chamber of <strong>Maritime</strong> Commerce• US <strong>Maritime</strong> Administration• NOAA• University of WisconsinSuperior (GLMRI)• University of Minnesota Duluth (GLMRI)• Lake Carriers Association• Transport Canada• <strong>Great</strong> <strong>Lakes</strong> Commission• St. Lawrence Seaway• Port of Duluth• Detroit Port Authority• University of ToledoA detailed list of attendees is provided in Appendix D. This meeting was the first of several meetings in amultiyear project sponsored by The <strong>Great</strong> <strong>Lakes</strong> <strong>Maritime</strong> <strong>Research</strong> <strong>Institute</strong>. Workshop participantsdiscussed in detail the purpose, goals and content of the data delivery system. This served to define thescope of the remainder of the first phase of this project and provided a clear direction for longterm effortsin this initiative. The recommendations are discussed in detail below.Purpose and Goals of the Information Delivery System. Workshop participants readily agreed thatthe data delivery system must serve as an accurate, current, comprehensive and userdriven data resource.In terms of its purpose, a critical objective of the system must be to provide data and information to informpublic policy decisionmakers as to the value and utility of the <strong>Great</strong> <strong>Lakes</strong> <strong>Maritime</strong> Transportation System(GL MTS). Of particular importance in reporting to public officials are:• Jobs• Economic impact of <strong>Great</strong> <strong>Lakes</strong> shipping• Safety issues associated with diverting freight traffic to GL MTS• Environmental impacts/benefits compared to other modes• Shipper savings associated with GL MTS• Congestion effects of other modes in comparison to GL MTS• Competition effects of <strong>Maritime</strong> Transportation and rate increases in other modes• Shift in intermodal connections and transshipment costs (e.g., “full cost” studies –pavement damage, fuel savings, crashes, etc.,• The value of shipping to states, cities regions, etc. (economic impact)Workshop participants discussed additional data needs for regional stakeholders that require data tofacilitate projections and forecasts for freight movements under alternative scenarios involving alternativemodes or intermodal movements. Regulatory impacts were also emphasized in the discussion along withimproved coordination of public investments over the entire system to benefit all stakeholders within theregion despite their location or jurisdiction.One additional concern dealing with the purpose of the data delivery system dealt with the question of“Where does the reach of the Marine Industry begin or end”? Does it begin and end at the ports or shouldit extend all the way from the origin to the destination? Participants argued for the scope of the database to12
“follow the cargo” to consider ripple effects, regional impacts and locational patterns in the supply chain(e.g., steelworkers and farmers in the region both depend on the maritime industry). This perspectivecertainly coincides with one of the original objectives of this project in linking marine freight movementsto the regional economy. These questions however, require detailed data that are not readily availablewithout the acquisition of ES202, vessel commodity flows, and vessel movements.Information Delivery Priorities for System Users. The most important outcome of the meeting dealtwith the form that the information delivery should take. The original design of the data delivery systemwas for a GIS format where users would query the database, perform simple analysis functions and preparegraphics, tables, text and maps as output. The challenge in implementing such a system however, concernsthe extent to which the system should support the query, manipulation and analysis of data (e.g., vehiclerouting, OD flow modeling, intermodal transfer simulation, etc.). In turn, developers of the system arefurther challenged by the need for users to gain the necessary expertise to operate the system.In response, meeting participants effectively argued that any system that requires a significant amount oftraining and practice would not be used as heavily as a more “user friendly” system consisting of preparedgraphs, maps, bullet points, tables, and other features such as prepackaged reports in basic standard formatssuch as Annual Reports, Executive Summaries, and reports of studies completed by analysts who used datafrom the repository. The project team responded to this point by proposing to develop a system that offersa variety of products and functions among varying degrees of expertise required by users. These include:• Basic prepared maps for viewing and download,• Prepared tables and graphs for viewing and download,• Simple mapping functions in the data viewer,• Query functions for more advanced users, and• Analysis functions and specialized functions in the database for advanced users.In addition, the project team noted that help functions could be furnished to assist users such as:• Technical manuals available in .pdf format in downloadable form for detailed directions on use• Webbased documentation / tutorials for instruction on the Toledo web site for specificfunctions such as basic mapping, query functions, and more advanced analysis functions.Additional tutorials can be posted documenting the contents of the database.• Online help functions to solve routine problems that are encountered as users operate thesystem.• Technical support via telephone and email using staff at the Toledo site at specified times tohelp users with more complex problems not available at the online help functions.The discussion concluded with the following recommended tasks for the project team in the next phase ofthe project:• Assemble, store, and manage raw data in the data set• Begin to develop data reporting standards with regard to data reconciliation among diverse sources,standardization of reported units, “currentness” of reported statistics, establishment of data acquisitionprotocols, quality control and accuracy checking, and to develop mechanisms to check for redundancyand duplication of efforts among contributors to the database. It was strongly recommended that thissystem “level the playing field” in data reporting by using the same units as other modes and regions—this resource must reflect the metrics used in the industry. Data reporting standards should bediscussed and reviewed on an ongoing basis (revisited every three years)13
• Assemble data and report information among different geographic areas of impacts andjurisdictions: States and Provinces Congressional districts Cities Counties Ports• Begin to prepare information in the form of maps, tables, text and graphics for stakeholderspertaining to public policy interests• Establish a communication link within the system (e.g., email access) for regional stakeholders torequest specific information to be posted on the site. This function was agreed upon as essential ifthe information delivery was to be successful• Establish a system for data exchange to analysts in maritime industry agencies and organizations• Develop a site in the system for analysts within the region to publish the results of theiranalysis—particularly with regard to public policy issues of interest to the <strong>Great</strong> <strong>Lakes</strong> <strong>Maritime</strong>Industry• Begin to develop a library function in the form of a data clearinghouse that reviews andsummarizes data from diverse sourcesboth public and commercialand provide links for usersto branch to from the site. The result of which is to provide the <strong>Great</strong> <strong>Lakes</strong> <strong>Maritime</strong> Industrywith a comprehensive centralized resource for data and information. An example of such a linkwould be for taxes, fees, and other costs; however, this component would not represent a corefunction of the data resource. It was further suggested that the site become a gateway to maritimeagencies (e.g., Coast Guard, USACE, etc.)One final charge to the project team resulting from the discussion was to begin thinking about how toimplement expedited data collection through technological innovations (e.g., AIS, informatics, electronicforms, etc.). It was suggested that a pilot project for automated data acquisition would be extremely usefulin later phases of the project. This recommendation in particular is to be actively pursued in the next phaseof the project.Recommendations for Data Acquisition. One final topic covered in the June 9 meeting dealt with datarequests for the site. It was recognized early in the discussion that data acquisition efforts must beprioritized given constraints in time, staffing and budget. Data priorities were highest for the following inthe initial phase of the project:• Cargo flows—vessel types, vessel size, types of commodities, origins, destinations• Facilities including docks, terminals, locks, equipment, and navigation facilities• Linking <strong>Great</strong> <strong>Lakes</strong> maritime freight movements and the economy of the <strong>Great</strong> <strong>Lakes</strong>Region (e.g., evaluating impacts of GL MTS freight movements on regional employment)• Environmental Data dealing with air and water emissions from <strong>Great</strong> <strong>Lakes</strong> vessels, including abaseline inventory of emissions data from great lakes vessels and a baseline ballast inventory• Data to support air and water pollution reductions based on diverting traffic from highwayand rail modes to marine transport modes• Data to support comparative analysis of <strong>Great</strong> <strong>Lakes</strong> Fleet vs. Railroads and Trucks interms of fuel consumption per tonmile along with effects of fuel costs on transport economics ofgreat lakes vessels vs. rail vs. truck over time• Compiled lists of current sources of data as part of the data library and clearinghouse functionof the site.14
Meeting participants contributed a number of additional recommendations related to longterm issuesassociated with the assembly, storage and management of the database. Of great importance was theestablishment of both baseline information and projected trends among a wide range of factors in theindustry. Specific recommendations included:• Consider the utility of data for projections into the future and tracking trends.• Data pertaining to investments in the infrastructure are critical. The system should account forcurrent costs, projected costs, investments (over different planning horizons) and the benefits ofinvestments; include the costs of making no investments• Include data that have been developed jointly between government and private interests—thesedata have considerable utility and credibility• Seek permissions in acquiring, storing and disseminating data. Acquire MOUs before includingdata in the system• Check for gaps in the data and additional needs for data that may not yet be available• Document caveats in working with the data—prepare a metadata reference page.The data collection efforts and recommendations for the project site obtained from the June 9 Meeting thusset the direction for the remainder of Phase I of this project and formed the basis for the approach to befollowed in subsequent phases of the project. Given the continuing nature of this project, the contents ofthis report should not only contain the progress of the project and work completed to date, but also a seriousdiscussion of the direction of our data management and delivery efforts in the upcoming months and years.The following section covers the direction that the project team plans to take in our next steps.<strong>15</strong>
Looking Ahead: Next StepsThe main objective of this resource is to maintain a longterm database and data distribution system builton a strong relationship with the political jurisdictions and stakeholders listed above. This data resourcewill serve as a central focus for these various interests to come together to focus on optimizing freightmovements within the region. With the addition of other interests such as firms, shippers, carriers, regionalplanning agencies, port authorities and economic development organizations, this resource can have adirect positive impact on the regional economy. Furthermore, this system was originally developed as partof the Upper Midwest Freight Corridor Study conducted as a cooperative venture between sevenMidwestern state departments of transportation and the Midwest Region University Transportation Center(MRUTC) at the University of Wisconsin, The University of IllinoisChicago, and The University ofToledo. The added input of the regional maritime industry stakeholders within the region during the June 9meeting further reinforces the relevance and utility of this resource for the region.Specific Tasks. It was made clear that the next phase of the project must carry out parallel tasks ofproviding a generalized information delivery system while still expanding data collection efforts in thedirection of acquiring flow data in greater detail with respect to commodities, origins and destinations, andvessel characteristics (including fuel consumption and emissions). The project team must link the maritimetransportation “network” to the highway and rail networks, which in turn can be linked to the regionaleconomy. These efforts also include detailed data library system and information clearinghouse functions.As a result, the next steps to be completed by the project team will involve the following distinct tasks:• Continue to assemble data in the centralized repository to include the following: Cargo flows—vessel types, vessel size, types of commodities, origins, destinations Baseline data for vessel movements including size, horsepower, emissions, fuelconsumption, ballast inventories, etc. Port Facilities including docks, terminals, etc. and relevant attributes dealing withcapacity, tonnages, etc. Linking <strong>Great</strong> <strong>Lakes</strong> maritime freight movements between origins, routes, portsand destinations as a means to link maritime freight flows to the regional economy Acquisition of additional economic data dealing with employment by sector,establishments, etc. Lock data including relevant attributes dealing with size, capacity, tolls, etc. Navigation facilities.• Documentation of data standards derived from data sources in the region (includingconsultation with data source agencies, <strong>Maritime</strong> Exchanges, Ports and other relatedorganizations) and reporting data in units consistent with the maritime industry and relatedtransportation modes• Begin a dialog with regional stakeholders with respect to their information needs in order toprepare maps, graphics, tables and text in a user friendly format• The development of an internetbased data reporting site for data resources and organizationswithin the region including links to related sites• Documentation of the data resources on the site.16
Given the inherent spatial nature of the transportation infrastructure, the organization of the data in thisstudy has been assembled within a geographic information system and will be stored in that format.However, the data will be made available outside of that format as well in tabular and other databasemanagement formats.Partnerships. This proposed project represents a partnership between the <strong>Great</strong> <strong>Lakes</strong> <strong>Maritime</strong><strong>Research</strong> <strong>Institute</strong>, the Intermodal Transportation <strong>Institute</strong> at The University of Toledo, and TheGeographic Information Science and Applied Geographics (GISAG) Center at the University of Toledo.The GISAG Center will provide all server space and data management services for this project. Access tothe Toledo Site will be linked from the GLMRI Web Page. The Toledo Project team will work closelywith Dr. Xiubin Wang of GLMRI to identify data for the system and to design the database and datadissemination system. Additional partnerships will be maintained with participants from the June 9meeting:• US Army Corps of Engineers• American <strong>Great</strong> <strong>Lakes</strong> Ports Association• Canadian Chamber of <strong>Maritime</strong> Commerce• US <strong>Maritime</strong> Administration• NOAA• University of WisconsinSuperior (GLMRI)• University of Minnesota Duluth (GLMRI)• Lake Carriers Association• Transport Canada• <strong>Great</strong> <strong>Lakes</strong> Commission• St. Lawrence Seaway• Port of Duluth• Detroit Port Authority• University of ToledoThe meeting participants suggested participation from additional industry stakeholders including CanadianShipowners, the St. Lawrence Seaway Development Corporation, Green Marine, AIS System, andinterested private shippers. One additional partnership that would yield longterm sustained viability forthis information delivery endeavor is with MISNA (<strong>Maritime</strong> Information Services of North America).The following section represents a proposal to join MISNA as their maritime exchange in the <strong>Great</strong> <strong>Lakes</strong>.A <strong>Great</strong> <strong>Lakes</strong> <strong>Maritime</strong> Exchange. One of the objectives of this project is to develop a longtermsustained information delivery resource for the <strong>Great</strong> <strong>Lakes</strong> Region. Eventually this data repository anddelivery system must be able to sustain itself financially as a member of the maritime industry in thisregion. To this end, it is proposed here that GLMRI and its partners in the industry consider theestablishment of a <strong>Great</strong> <strong>Lakes</strong> <strong>Maritime</strong> Exchange (GLMX) in the form of a nonprofit organization thatwould be financed through subscription fees by its partners in the industry. There are a number of suchexchanges in the coastal regions of the United States and in British Columbia. These exchanges partnerwith one another through MISNA, an umbrella organization of nonprofit 501(c)(6) maritime exchanges inthe United States and British Columbia. According to MISNA:[these maritime exchanges] represent a broad cross section of maritime interests in their respectiveregions vessel owners and agents, ports, pilots, towboat companies, stevedores and terminaloperators, admiralty lawyers, customs brokers and freight forwarders, ship repair firms, employerassociations, insurance agencies, marine surveyors, maritime unions and oil spill responseorganizations, just to name a few. [1].17
Again, according to MISNA, the marine exchanges comprising this organization carry out a range of tasksthat include:• Advance Vessel Schedule Information, including ETAs and ETDs• Advance and realtime vessel movement monitoring (AIS)• Actual Arrival and Departure Data• Vessel Traffic Analysis• Historical Vessel Movement• Port and Terminal Utilization Studies• Promote <strong>Maritime</strong> Interests [1].The principal investigator on the project team was contacted by MISNA in June, 2006 with the proposal tobegin a maritime exchange in the <strong>Great</strong> <strong>Lakes</strong>. To date, none exist in this region. Subsequently theprincipal investigator was invited to a MISNA National Meeting in Portland, Oregon in September, 2006.MISNA has established standards and protocols for data reporting that could be adopted in the <strong>Great</strong> <strong>Lakes</strong>without developing a new set independently. A sample of data obtained from vessel tracking includes thefollowing fields:• Ship Name• Lloyd’s Number• Ship Flag• Ship Type• Local Agent• Estimated Date of Arrival• Estimated Time of Arrival• Actual Time of Arrival• Arrival Port• Arrival Berth• Actual Date of Departure• Actual Time of Departure• Last Port of Call• Next Port of Call• Actual Date of ArrivalOne of the main functions for many of the maritime exchanges is realtime vessel tracking using the AISSystem as implemented in the <strong>Great</strong> <strong>Lakes</strong>/St. Lawrence Seaway system [2]. Continuous trackingenhances safety, optimizes transit times through better traffic management, optimizes scheduling of lockpassages, improves fleet management for ship owners and assists in navigation through the system,provides faster response times following accidents/incidents, provides data to support homeland securityefforts, and assists in tracking hazardous cargoes [2].It is further argued here that continuous tracking of vessels can provide a means for effective coordinationof intermodal connections in short sea shipping. The system can also provide input functions for longtermvessel tracking such as with the Automated Secure Vessel Tracking System [3]. Longterm vessel trackingcan provide useful data to track total vessel traffic over the entire system—including specific channelswhere dredging is needed or other navigation improvements are required. Continuous vessel tracking canalso provide needed data to track vessel emissions and to demonstrate savings in overall emissions bydiverting freight traffic from rail and highway to the lakes.It should be emphasized that maritime exchanges maintain strict confidentiality with their clientorganizations and do not disclose data among organizations without authorization. As discussedpreviously in this report, the same approach would be adopted in the <strong>Great</strong> <strong>Lakes</strong>. Thus a great lakesmaritime exchange could serve as another partner with GLMRI and the maritime industry as a commercialresource and merits consideration.18
ConclusionThe initial phase of the <strong>Great</strong> <strong>Lakes</strong> <strong>Maritime</strong> Information Delivery System Project began with an initialassumption that it would simply serve as an extension to the Midwest FreightView system developed forthe Upper Midwest Freight Corridor Study. The end of the first phase of the project yielded significantlydifferent results from what was originally envisioned. The new product will be a multidimensional systemthat will support the following functions:• A detailed data repository for vessel movements, port functions, commodity flows, economicactivities and environmental impacts, etc.• A GIS data viewer for advanced users to view and analyze a variety of data• An information delivery site for maps, tables, graphics, text and other features• An information clearinghouse and centralized data facility to furnish links to other informationresources, private vendors furnishing commercial products, and government agencies• A data exchange to support user inquiries and furnish information on demand.The project team anticipates that the initial prototype of the webbased information delivery resource willbe introduced to the <strong>Great</strong> <strong>Lakes</strong> maritime community in November, 2006. The project team will solicitfeedback and suggestions for improvements at that time. Continuous improvement of the informationdelivery system will also be a major objective as this resource evolves in the coming years. We will striveto maintain an open dialog with the members of the industry to assure our success in this endeavor.19
References Cited[1] <strong>Maritime</strong> Information Service of North America (MISNA), (2004) (Internet), History of MISNA, (citedSeptember, 2006), http://www.misnadata.org/content/history.php?m=<strong>15</strong>.[2] <strong>Great</strong> <strong>Lakes</strong>/St. Lawrence Seaway System (SLSDC and SLSMC), (2006) (Internet), AIS Project (citedSeptember, 2006), http://www.greatlakesseaway.com/en/navigation/ais_project.html.[3] <strong>Maritime</strong> Information Service of North America (MISNA), (2006) (Internet), Automated Secure VesselTracking System (ASVTS), (cited September, 2006), http://www.asvts.org20
APPENDIX ASchematic Diagram of the Structure of theCurrent Midwest FreightView Database22
Schematic Diagram of the Structure of the Current MWFV DatabaseA124
APPENDIX BSample of Map Output from Midwest FreightView<strong>Great</strong> <strong>Lakes</strong> <strong>Maritime</strong> Database26
Example 1: Basic Mapping FunctionsFigure Figure B.1Initial display for the user Interfacein Midwest FreightViewFigure B.2User activates pull down menu to open thehighway network in the <strong>Great</strong> <strong>Lakes</strong> Region.Figure B.3MWFV displays highway network in the viewwindow.B128
Figure B.4MWFV provides users with the ability to highlightspecific features in the display. In this case, majorhighways are highlighted.Figure B.5User activates pull down menu to display the<strong>Great</strong> <strong>Lakes</strong> Port locations in the system.Figure B.6MWFV displays port locations in the viewwindow.B229
Figure B.7User now queries the port data points for mapdisplay. In this case, the user opened the databaseto query ports for coal tonnages. The graduatedsymbols in the map thus provide a graphiccomparison among <strong>Great</strong> <strong>Lakes</strong> Ports for coaltonnage in 1995 (provided by Lake CarriersAssociation).Example 2: Display of Attributes forFeatures in the SystemFigure B.8User activates pull down menu to display the<strong>Great</strong> <strong>Lakes</strong> dock locations in the system.Figure B.9MWFV displays dock locations in the viewwindow. Note that at this scale, dock locationsare distributed in the same locations as ports;however there are more points in this map than inthe map in Figure II.6.B330
Figure B.10User points to a single dock and highlightsit with the cursor. (See yellow dot locatedat Sheboygan, Wisconsin)Figure B.11User opens attribute table and examineshighlighted record in the tablecorresponding to the dock location (noteonly a portion of the table is shown in thedisplay).B431
Example 3: Mapping the NetworkFigure B.12User activates pull down menu to open thewaterway network.Figure B.13MWFV displays USACE waterway networkfor both the <strong>Great</strong> <strong>Lakes</strong> and the InlandWaterway system. Given that MWFV wasdeveloped as an intermodal transportationdisplay system for the Upper Midwest FreightCorridor Study, more than one waterwaysystem is displayed.Figure B.14User highlights shortest path links on the <strong>Great</strong><strong>Lakes</strong>/St. Lawrence Seaway Network that weredeveloped to contain baseline commodityflows from the 2002 Freight AnalysisFramework. Flow data were based on 2002Commodity Flow Survey. Note that additionallinks are inserted to state centroids as a meansto capture statebased flows that originate orterminate away from the major ports in theregion.B532
Example 4: Linking the <strong>Great</strong><strong>Lakes</strong> <strong>Maritime</strong> TransportationSystem to the Regional Economy.Figure B.<strong>15</strong>User activates pull down menu to open theregional employment database. In this case,the user is opening employment data by censustract.Figure II.16MWFV displays a dot distribution map ofmanufacturing employment alongside <strong>Great</strong><strong>Lakes</strong> dock locations. MWFV was developedas an intermodal transportation display systemfor the Upper Midwest Freight Corridor Study,more than one waterway system is displayed.The map appears cluttered, prompting the userto “turn off” some of the map elements in thedisplay to produce the map in Figure B.17.Figure B.17MWFV displays an uncluttered dot distributionmap of manufacturing employment superimposedover <strong>Great</strong> <strong>Lakes</strong> dock locations. Notonly will users be able to cartographicallydisplay these relationships, but the data are alsostored in a convenient format for a wide varietyof statistical and spatial analyses.B633
APPENDIX CCode Specifications for <strong>Great</strong> <strong>Lakes</strong> Commercial Docks34
Code Specifications for <strong>Great</strong> <strong>Lakes</strong> Commercial DocksAn identification code system has been developed by the project team to uniquely identify the commercialdocks in this database. This code was developed because of a lack of standardization in identificationcodes among agencies and firms. As this project is looking at the <strong>Great</strong> <strong>Lakes</strong> system as a whole, our IDcode was designed to work for all docks on both the Canadian and American sides of the <strong>Lakes</strong>. The codeis an eightdigit number system where each digit, or set of digits, represents a specific category. Theadvantage of this I.D. system is that each number represents something real, it is not a mere arbitrarynumber used for administrative functions. This code system enables individuals to easily identify andlocate a dock and determine the types of commodities it handles.Code Key X0000000 First Digit – Country Code 0XX00000 Second & Third Digits – State/Province Code 000XX000 Fourth & Fifth Digits – Port Code 00000X00 Sixth Digit – Commodity Code 000000XX Seventh & Eight Digits – Specific Dock CodeThe advantage of this I.D. system is that each number represents an actual characteristic of the dock; it isnot an arbitrary number used for administrative functions.Identification System Code Index X0000000 First Digit – Country Code 1 Canada 2 United States 0XX00000 Second & Third Digits – State/Province Code 01 Illinois 02 Indiana 03 Michigan 04 Minnesota 05 New York 06 Ohio 07 Ontario 08 Pennsylvania 09 Quebec 10 Wisconsin 000XX000 Fourth & Fifth Digits – Port CodeIllinois: 01 Chicago 02 WaukeganIndiana: 01 Buffington 02 Burns International Harbor 03 Gary 04 Indiana HarborC136
Michigan: 01 Alpena 19 Marine City 02 Brevort 20 MenomineeMarinette 03 Calcite 21 Marquette 04 Charlevoix 22 Marysville 05 Cheboygan 23 Monroe 06 Detroit 24 Munising 07 Escanaba 25 Muskegon 08 Filer City 26 Ontanagon 09 Frankfort Harbor 27 Port Dolomite 10 Gladstone 28 Port Gypsum 11 Grand Haven 29 Port Huron 12 Gulliver 30 Port Inland 13 Harbor Beach 31 Portage Canal 14 Holland 32 Saginaw River <strong>15</strong> Ludington 33 Sault Ste. Marie 16 Macinac Island 34 St. Joseph 17 Manistee Harbor 35 Stoneport 18 Manistique 36 Traverse CityMinnesota: 01 Duluth – Superior 02 Silver Bay 03 Taconite Harbor 04 Two HarborsNew York: 01 Buffalo 02 Dunkirk 03 Ogdensburg 04 Oswego 05 RochesterOhio: 01 Ashtabula 02 Cleveland 03 Conneaut 04 Fairport Harbor 05 Huron 06 Kelly’s Island 07 Lorain 08 Marblehead 09 Sandusky 10 ToledoOntario: 01 Amherstburg 13 Morrisburg 02 Bath 14 Nanticoke 03 Bowmanville <strong>15</strong> Oshawa 04 Britt 16 Owen Sound 05 Bruce Mines 17 Pelee Island 06 Cornwall 18 Port Colborne 07 Goderich 19 Port Stanley 08 Hamilton 20 Sarnia 09 Little Current 21 Thunder Bay 10 Marathon 22 Toronto 11 Millhaven 23 Windsor 12 MississaugaC237
Pennsylvania: 01 ErieQuebec: 01 Baie Comeau 11 Port Alfred 02 Becancour 12 Port Cartier 03 Contrecoeur 13 Quebec City 04 Cote Ste. Catherine 14 Rimouski 05 GrosCacouna <strong>15</strong> Sept Iles 06 La Baie 16 Sorel 07 Lauzon Levis 17 St. Romuald 08 Mataine 18 Tracy 09 Montreal 19 Trois Riveres 10 Pointe Naire 20 ValleyfieldWisconsin: 01 Ashland 02 Duluth – Superior 03 Green Bay 04 Manitowoc 05 Menominee – Marinette 06 Milwaukee 07 Sheboygan 08 Sturgeon Bay 09 Washburn 00000X00 Sixth Digit – Commodity Code 1 Aggregate 2 Coal 3 General Cargo 4 Government 5 Grain 6 Iron Ore 7 Liquid 8 Passenger 9 Shipyard / LayUp 000000XX Seventh & Eight Digits – Specific Dock CodeThe Specific Dock Code is a twodigit number used to differentiate between docks in a particular port thathandle the same type of commodity. It is possible that there will be multiple docks with identical codenumbers up until these last two digits, which will always show the difference between specific docks in aport.C338
APPENDIX DMeeting Participants in the <strong>Great</strong> <strong>Lakes</strong> Data WorkshopDetroit, MichiganJune 9, 200640
ATTENDEESName Organization TitleJeff Ahlgren Coast Guard Sector Detroit ChiefDick Ash Army Corps of Engineers Operations <strong>Research</strong> AnalystHelen Brohl US <strong>Great</strong> <strong>Lakes</strong> Shipping Assn. Executive DirectorJonathan Brown Army Corps of Engineers Regional EconomistSteve Fisher American <strong>Great</strong> <strong>Lakes</strong> Ports Assn. DirectorDavid Grier Army Corps of Engineers Navigation AnalystTonya Harrington Army Corps of Engineers Regional EconomistRay Johnston Chamber of <strong>Maritime</strong> Commerce PresidentDave Knight <strong>Great</strong> <strong>Lakes</strong> Commission Program ManagerJatinder (Paul) Kochhar Transport Canada EconomistPatrick Lawrence University of Toledo ProfessorPeter Lindquist University of Toledo ProfessorBrian Link USCOC, NOAA, OCS G.L. Nav. AdvisorDouglas McDonald Army Corps of Engineers Washington LiaisonGlen Nekvasil <strong>Lakes</strong> Carriers Association Vice PresidentAdolph Ojard Duluth Seaway Port Authority Executive DirectorSteven Olinek Detroit/Wayne County Port Authority Deputy DirectorRichard Stewart University of WisconsinSuperior CoDirectorKevin Tunks <strong>Maritime</strong> Administration Enterprise ArchitectMark Vonderembse University of Toledo DirectorXiubin Wang University of WisconsinSuperior ProfessorCarol Wolosz University of Minnesota Duluth Program CoordinatorD142
Tax Systems and Barriersto <strong>Great</strong> <strong>Lakes</strong> <strong>Maritime</strong> CommerceFinal ReportPrepared by:Randall K. SkalbergAssistant ProfessorAccounting DepartmentLabovitz School of Business and EconomicsUniversity of Minnesota DuluthJames A. SkurlaActing DirectorBureau of Business and Economic <strong>Research</strong>Labovitz School of Business and EconomicsUniversity of Minnesota DuluthOctober 2006This report represents the results of research conducted by the authors and does not necessarily represent the viewsor policies of the <strong>Great</strong> <strong>Lakes</strong> <strong>Maritime</strong> <strong>Research</strong> <strong>Institute</strong>. This report does not contain a standard or specifiedtechnique. The authors and the <strong>Great</strong> <strong>Lakes</strong> <strong>Maritime</strong> <strong>Research</strong> <strong>Institute</strong> do not endorse products or manufacturers.Trade or manufacturers’ names appear herein solely because they are considered essential to this report.<strong>Great</strong> <strong>Lakes</strong> <strong>Maritime</strong><strong>Research</strong> <strong>Institute</strong>A University of Wisconsin-Superior andUniversity of Minnesota Duluth Consortium<strong>Research</strong> funded in part by the <strong>Great</strong> <strong>Lakes</strong> <strong>Maritime</strong> <strong>Research</strong> <strong>Institute</strong>
Acknowledgements<strong>Research</strong> Team:UMD Labovitz School of Business and EconomicsBureau of Business and Economic <strong>Research</strong>James A. Skurla, Acting DirectorJean Jacobson, Senior EditorRandall K. Skalberg, UMD Dept of AccountingPaul Hochsprung, Undergraduate <strong>Research</strong> AssistantNitya Malik, Undergraduate <strong>Research</strong> AssistantDavid Slegh, Undergraduate <strong>Research</strong> AssistantEla Martopullo, Undergraduate <strong>Research</strong> AssistantNicholas Linde, Undergraduate <strong>Research</strong> AssistantVickie Almquist-Minko, Executive Administrative SpecialistBureau of Business and Economic <strong>Research</strong>19 School of Business and EconomicsUniversity of Minnesota DuluthDuluth, MN 55812-2496 (218) 726-8614<strong>Great</strong> <strong>Lakes</strong> <strong>Maritime</strong> <strong>Research</strong> <strong>Institute</strong> Contact:Eil Kwon, Director, Transportation <strong>Research</strong> ProgramsCo-Director, <strong>Great</strong> <strong>Lakes</strong> <strong>Maritime</strong> <strong>Research</strong> <strong>Institute</strong>University of Minnesota DuluthAlso thanks to:Glen G. Nekvasil, Vice President - Operations Vice President - CorporateCommunications, Lake Carriers' AssociationSteve Fisher, Executive Director, American <strong>Great</strong> <strong>Lakes</strong> Ports AssociationGregg M. Ward, Vice President, Detroit-Windsor Truck FerryAdolph Ojard, Executive Director, Duluth Seaway PortRay Skelton, Duluth Seaway Port Authority Security Director and Environmentaland Government Affairs DirectorAndy McDonald, Senior Planner, Metropolitan Interstate Committee (MIC),Metropolitan Planning Organization (MPO) for the Duluth-SuperiorMark Ross, United States Department of Treasury, Bureau of the Public Debt,Office of Public Debt Accounting, Trust Fund Management Branch.University of New Orleans, NPWI, and SCOOPRodriguez, O'Donnell, Ross & Fuerst<strong>Great</strong> <strong>Lakes</strong> & Ohio River Division, Army Corps of Engineers Dredging Districtsii
This page intentionally left blank.iii
Table of ContentsExecutive Summary.......................................................................................... (viii)Chapter 1: Introduction...........................................................................................11.1 <strong>Research</strong> issue........................................................................................11.2 Background............................................................................................21.3 Relevant literature .................................................................................4Data..................................................................................................4<strong>Research</strong> Contributions....................................................................51.4 Methodology, basic approach ................................................................71.5 Report organization................................................................................7Chapter 2: <strong>Great</strong> <strong>Lakes</strong> <strong>Maritime</strong> Tax Inventory...................................................82.1 Tax data..................................................................................................82.2 Analysis of Tax Data .............................................................................81) Federal Commercial <strong>Maritime</strong> AssessmentsOther than <strong>Great</strong> <strong>Lakes</strong> ........................................................92) Federal Commercial <strong>Maritime</strong> Assessments<strong>Great</strong> <strong>Lakes</strong> Only .............................................................. 103) Top Collections Assessments ....................................................104) Tables of Assessments by Stakeholder......................................125) Kinds of Assessments Levied on <strong>Great</strong> <strong>Lakes</strong> Commerce........186) Harbor Maintenance Tax Tables .............................................. 232.3 Challenges of <strong>Great</strong> <strong>Lakes</strong> <strong>Maritime</strong> Infrastructure:Army Corps of Engineers Dredging on the <strong>Great</strong> <strong>Lakes</strong> Ports......242.4 Highlighting the Harbor Maintenance Tax..........................................28Chapter 3: The U.S. Harbor Maintenance Tax,a Bad Idea Whose Time has Passed?.........................................................29History of the Harbor Maintenance Tax ....................................................29Legal Challenges to the HMT’s Validity...................................................30Litigation Subsequent to US-Shoe.............................................................31Problems with the Harbor Maintenance Tax Today..................................32Application to Imports but not Exports ..........................................32The HMT Discourages the Most Fuel Efficient Means ofTransportation.....................................................................32HMT Violates GATT......................................................................32The HMT Unfairly Taxes High Value Cargo When Compared toLow Value Cargo............................................................... 33The HMT Has Prevented Some Types of Waterborne Transportfrom Flourishing in the <strong>Great</strong> <strong>Lakes</strong>................................. 33As Currently Enacted the HMT is Difficult to Properly Enforce . 33The HMT is a Barrier to International Trade................................ 33The HMT Results in a Shift in Container-Borne Cargoto Canadian Ports ............................................................. 34iv
The HMT Generates Substantially More Revenue than the U.S.Currently Needs for Harbor Maintenance........................ 34The Income from the HMT Is Not Fairly Allocated to theCommercial Ports Which Generate HMT Revenues.........34The HMT Does Not Allocate Its Tax Burden to Either1) Ports which Require the Largest Dredging ExpendituresOr, 2) Vessels which Require the Deepest Drafts............ 35The Income from the HMT is Used for Work at Some Portsbut Not Others................................................................. 35HMT Revenue is a Small Portion of Total Transportation TaxRevenue and a Small Portion of TransportationSpending ......................................................................... 36Attempts to Fix the HMT’s Flaws .............................................................36The 1992 Attempt to Reduce the HMT ....................................... 36The Trust Fund Excess/HMT Rate Reduction Bill........................36The Harbor Services Fund .............................................................36The Support for Harbor Investment Program Act of 1999............37The Container Port Exemption Bill of 2002..................................37The $100,000,000 Import Value Port Limit Bill of 2003..............37The Ferry Borne Trailer Cargo Exemption Bill of 2004 ...............37The Short Sea Shipping Tax Exemption Act of 2005....................37The <strong>Great</strong> <strong>Lakes</strong> Short Sea Shipping Enhancement Act of 2006 ..37Proposed Solutions to the HMT Problem ..................................................38Proposal 1: Abolish the HMT and Fund Harbor MaintenanceUsing General Government Revenue ................................38Proposal 2: Abolish the HMT and Fund Harbor MaintenanceUsing an Increase in the Diesel Fuel Excise Tax...............38Proposal 3: The Short Sea Shipping Tax Credit ............................40Chapter 4: Potential Economic Impacts of the <strong>Research</strong> Results.........................42Chapter 5: Conclusion............................................................................................44References..............................................................................................................45AppendicesAppendix A: Tax Inventory Data ........................................................... A-1Appendix B: Commercial <strong>Maritime</strong> Assessments Tax Code Inventory B-1Appendix C: Detailed HMT Timeline .................................................... C-1Appendix D: Estimating Harbor Maintenance Tax Revenues................ D-1List of TablesTable 2.1: Overview of Federal Agencies Ranked by Number ofAssessment on <strong>Maritime</strong> Commerce ...................................8Table 2.2: Federal Commercial <strong>Maritime</strong> Assessments Other thanv
<strong>Great</strong> <strong>Lakes</strong> Panama Canal Commission (PCC)..................9Table 2.3: Top Ten Revenue Producing Commercial <strong>Maritime</strong>Federal Assessments ..........................................................10Table 2.4: <strong>Great</strong> <strong>Lakes</strong> Assessments Paid by Passenger andNon-Passenger Vessel Operators.......................................12Table 2.5: <strong>Great</strong> <strong>Lakes</strong> Assessments Paid by Passengerand Non-Passenger Owners ...............................................<strong>15</strong>Table 2.6: <strong>Great</strong> <strong>Lakes</strong> Assessments Paid by Passengerand Non-Passenger Exporters............................................16Table 2.7: <strong>Great</strong> <strong>Lakes</strong> Assessments Paid by Passengerand Non-Passenger Importers............................................17Table 2.8: <strong>Great</strong> <strong>Lakes</strong> Assessments Paid by Passengerand Non-Passenger Other Stakeholders.............................17Table 2.9: Tax Assessments on <strong>Great</strong> <strong>Lakes</strong> <strong>Maritime</strong> Commerce..........18Table 2.10: Duty Assessments on <strong>Great</strong> <strong>Lakes</strong> <strong>Maritime</strong> Commerce.......19Table 2.11: Fee Assessments on <strong>Great</strong> <strong>Lakes</strong> <strong>Maritime</strong> Commerce ........20Table 2.12: Other Assessments, Including Permits, AdministrativeCharges, and Other User Fees on <strong>Great</strong> <strong>Lakes</strong><strong>Maritime</strong> Commerce ..........................................................22Table 2.13: Harbor Trust Fund Transfers and Revenues 1988-2000.........23Table 2.14: Total Bid Dollars by Corps of Engineers, by Districtin the <strong>Great</strong> <strong>Lakes</strong> & Ohio River Division, 2000-2005.....25Table 2.<strong>15</strong>: USACE Activity by Port, 2000-2004 .....................................25Table 3.1: Harbor Maintenance Trust Fund Balances ..............................34Table 3.2: U.S. Fuel Consumption and Demand ......................................38Table 3.3: Percent Change in U.S. Fuel Consumption .............................39Table 3.4: 2005 U.S. Diesel Excise Tax and Daily, Yearly Demand.......39Table 3.5: U.S. Tax Collections and Revenue, Diesel Excise TaxCompared to HMT.............................................................40Table 4: Estimated Economic Impact per $Million Increasein Shipping.........................................................................42Table 4.1: Value Added Impact ..........................................................42Table 4.2: Employment Impact...........................................................42Table 4.3: Output Impact ....................................................................43Table 4.4: Total Impact.......................................................................43List of FiguresFigure 1: Overview of Ports on the <strong>Great</strong> <strong>Lakes</strong>: Waterborne Commerce,Cargo Volume by Port in Tonnes, 1990 ..............................2Figure 2: <strong>Great</strong> <strong>Lakes</strong> & Ohio River Division, Army Corps of EngineersDredging Districts............................................................. 24Figure 3: Edward L. Ryerson Photograph...............................................29Figure 4: HMT Timeline .........................................................................41vi
vii
Executive SummaryThis project inventories the tax impact on the <strong>Great</strong> <strong>Lakes</strong> marine transportation systemimposed by federal regulations. This project also identifies the unique tax burdens placedon the commercial maritime regulatory process in the <strong>Great</strong> <strong>Lakes</strong>, and presents ananalysis of the <strong>Great</strong> <strong>Lakes</strong> maritime tax structure focusing on its most significant tax, theHarbor Maintenance Tax (HMT). Finally this project discusses possible changes to thecurrent tax structure to improve the efficiency of port maintenance tax collection andexpenditure, and to improve intermodal transportation fuel efficiency. This study wasfunded by a grant from the <strong>Great</strong> <strong>Lakes</strong> <strong>Maritime</strong> <strong>Research</strong> <strong>Institute</strong>.The primary public policy intent of this study is to advance understanding of the taxstructure of commercial maritime on the <strong>Great</strong> <strong>Lakes</strong>. The primary purpose of this studyfor the research team at the Labovitz School of Business and Economics is to accomplishthe contract’s goals and objectives, and to suggest methods for increasing efficiency inthe relationship between tax policy and commercial maritime operations.The inventory database includes individual assessments currently levied on thecommercial maritime industry by federal agencies (119 assessments) derived from datapublished by the United State General Accounting Office.Each data record is made up of variables which include: assessment name; description ofthe assessment; agency that levies the assessment; type of service provided; tax, or dutyassociated with assessment; type of vessel the assessment is levied on; commerce type ofvessel the assessment is levied on; flag type of vessel the assessment is levied on; payorof the assessment; entity that collects the assessment; type of fund that receives thecollections; entity that uses the collections; formula and frequency of assessment;collection amounts for FY 1989 through FY 1991, FY 1996 through FY 1998, andestimated collections for FY 1999; collection limitations; and laws and regulations. Mostvariables have footnotes. The database is presented in Appendix A to this report (withoutnotes) and the full data is available in digital format from the <strong>Great</strong> <strong>Lakes</strong> <strong>Maritime</strong><strong>Research</strong> <strong>Institute</strong>.Detailed views of these data presented in this report include tables for 1) FederalCommercial <strong>Maritime</strong> Assessments Other than <strong>Great</strong> <strong>Lakes</strong> and Federal Commercial<strong>Maritime</strong> Assessments <strong>Great</strong> <strong>Lakes</strong> Only; 2) Top Collections Assessments; 3) Tables ofAssessments by Stakeholder; 4) Kinds of Assessments Levied on <strong>Great</strong> <strong>Lakes</strong>Commerce; and 5) Harbor Maintenance Tax Tables.Tables also present U.S. Army Corps of Engineers’ (USACE) port maintenance activitydata by district within the <strong>Great</strong> <strong>Lakes</strong> & Ohio River Division. District data is alsopresented in detail by port, including ports in the districts of Buffalo, Chicago, Detroit,Huntington, Louisville, Nashville, and Pittsburgh.As has been discussed in Stewart’s 2003 Twin Ports Intermodal Freight TerminalStudy[1] and Fruin and Fortowsky’s 2004 Modal Shifts from the Mississippi River andDuluth/Superior to Land Transportation Study [2], beneficiaries of USACE dredgingactivity do not necessarily correspond with payors of the HMT. For instance, the HMTviii
paid by the now terminated Incan Superior railcar ferry (estimated at $200,000 in 1991)delivered no benefit to this vessel requiring a loaded draft of about 17 feet in a navigationchannel of 27 feet [3]. The report includes an overview of beneficiaries of the HMT,with detailed <strong>Great</strong> <strong>Lakes</strong> port by port totals for 2000 to 2004 amounts spent for portmaintenance supported by the collections of the HMT.Following the presentation of the tax inventory, the U.S. Harbor Maintenance Tax isreviewed under the inquiry: “The U.S. Harbor Maintenance Tax, a Bad Idea WhoseTime has Passed?”The history of the Harbor Maintenance Tax is shown including legal challenges to theHMT’s validity and problems with the harbor maintenance tax today. Implications of thishistory are discussed including the HMT’s application to imports but not exports and howthe HMT discourages the most fuel efficient means of transportation. Also presented arearguments showing the HMT unfairly taxes high value cargo when compared to lowvalue cargo, that the HMT has prevented some types of waterborne transport fromflourishing in the <strong>Great</strong> <strong>Lakes</strong>, and that as currently enacted the HMT is difficult toproperly enforce. These findings suggest that the HMT is a barrier to international tradeand may result in a shift in container-borne cargo to Canadian ports.The report presents data from the U.S. Treasury Department of Public Debt which showsrevenues and transfers of the Harbor Maintenance Trust Fund through 2005 and part of2006. Tables for these data show that the HMTF generates substantially more revenuethan the U.S. currently expends for harbor maintenance. Comparisons with the USACEactivity by port suggest that income from the HMT is not fairly allocated to thecommercial ports which generate HMT revenues; for instance, that the HMT does notallocate its tax burden to either ports which require the largest dredging expenditures, orvessels which require the deepest drafts, and that the income from the HMT is used forwork at some ports but not others. The report also notes that HMT revenue is a smallportion of total transportation tax revenue and a small portion of transportation spending.Strategies and attempts to “fix” the HMT’s flaws are also discussed, including the 1992attempt to reduce the HMT; the trust fund excess/HMT rate reduction bill; the HarborServices Fund; the Support for Harbor Investment Program Act of 1999; the containerport exemption bill of 2002; the $100,000,000 import value port limit bill of 2003; theferry borne trailer cargo exemption bill of 2004; the Short Sea Shipping Tax ExemptionAct of 2005; and the <strong>Great</strong> <strong>Lakes</strong> Short Sea Shipping Enhancement Act of 2006.Three proposals are presented in the HMT review: 1)Abolish the HMT and Fund HarborMaintenance Using General Government Revenue; or 2) Abolish the HMT and FundHarbor Maintenance Using an Increase in the Diesel Fuel Excise Tax; or 3) <strong>Institute</strong> aShort Sea Shipping Tax Credit. Each proposal shares the possible outcome of increasedshipping activity on the <strong>Great</strong> <strong>Lakes</strong>. A conference call among port and shippingstakeholders confirmed the likelihood of some increase in shipping activity following theincentive provided by removing the tax.The input-output modeling tool IMPLAN® provides a general estimate of the economicimpact of possible increase in shipping activity. For purposes of estimation, the impactof an assumption of $1 million in increased shipping output for the economy of the Stateix
of Minnesota is reported in 2005 dollars. Value Added, Employment and Outputmeasures are modeled here with three effects, sometimes referred to as “rounds ofspending”: the direct effect (the initial new spending), the indirect effect (additional interindustryspending), and an induced effect (additional household expenditure from thedirect and indirect impact). The modeling shows that for every million dollars inincreased maritime shipping activity, the economy of Minnesota could see an additionaltotal Value Added impact of $581,519, an additional $500,000 in Output, and almosteight new jobs added to the economy.The report concludes by noting: Analysis of the federal assessment structure for current<strong>Great</strong> <strong>Lakes</strong> maritime commerce shows an array of 119 various fees, duties, taxes andother assessments. Among these the Harbor Maintenance Tax deserves special andimmediate attention for reform as a failed taxation system that arose out of the “user feefever” of the 1980s.A substantial portion of the HMT’s tax base was found to be unconstitutional by the U.S.Supreme Court, leaving an unbalanced, unfair and excessive tax in effect. The HarborMaintenance Trust Fund continues to grow well beyond the amounts expended for harbormaintenance. At least nine attempts have been made to reform this failed system in thepast ten years, none of which were successful. It’s time for Congress to abolish thisfailed method of taxation and replace the revenue stream with funds from either theTreasury’s general fund or funds generated by an increase in the diesel fuel excise tax.x
Chapter 1: Introduction1.1 <strong>Research</strong> issue.This project inventories the tax impact on the <strong>Great</strong> <strong>Lakes</strong> marine transportation systemimposed by federal regulations. This project also identifies the unique tax burdens placedon the commercial maritime regulatory process in the <strong>Great</strong> <strong>Lakes</strong>, and presents ananalysis of the <strong>Great</strong> <strong>Lakes</strong> maritime tax structure focusing on its most significant tax, theHarbor Maintenance Tax (HMT). Finally this project discusses possible changes to thecurrent tax structure to improve the efficiency of port maintenance tax collection andexpenditure; as well as to improve intermodal transportation fuel efficiency.This study was funded by a grant from the <strong>Great</strong> <strong>Lakes</strong> <strong>Maritime</strong> <strong>Research</strong> <strong>Institute</strong>.The contract for this study has the following project description:This topic addresses the tax impact on the <strong>Great</strong> <strong>Lakes</strong> (GL) marinetransportation system (MTS) imposed by federal tax codes and regulations.This project will attempt to identify the unique tax burdens placed on thecommercial maritime regulatory process in the <strong>Great</strong> <strong>Lakes</strong>.This project proposes to recommend methods for decreasing the tax impact on<strong>Great</strong> <strong>Lakes</strong> shipping from both a tax burden and a compliance standpoint and tooffer a viable option for government to help ease the tax complexities thatshipping companies face.The primary public policy intent of this study is to advance understanding of the taxstructure of commercial maritime transportation on the <strong>Great</strong> <strong>Lakes</strong>.The primary purpose of this study for the research team at the Labovitz School ofBusiness and Economics is to accomplish the contract’s goals and objectives, and tofurther the discussion of the possibilities for increasing efficiency in the relationshipbetween tax policy and commercial maritime operations.1
1.2 Background.Figure 1: Overview of Ports on the <strong>Great</strong> <strong>Lakes</strong>: Waterborne Commerce, Cargo Volumeby Port in Tonnes, 1990. Source: <strong>Great</strong> <strong>Lakes</strong>: An Environmental Atlas and ResourceBook, EPA.The Center for Naval Analysis notes that responsibility for managing U.S. ports and itswaterways system is spread among various federal agencies and stakeholders.Management is fragmented and there is no mechanism for coordination [4]. The Centerfurther indicates that unless all entities work together in unison, it will not be possible toensure that all ships and cargoes can move efficiently into and out of U.S. ports, globalprices will rise, and U. S. global competitiveness will drop.Support for such a reformed tax system can be found with <strong>Great</strong> <strong>Lakes</strong> United, anorganization devoted to sustainable development on the <strong>Great</strong> <strong>Lakes</strong>. In their2
presentation, “A Transportation Infrastructure to Sustain Our Economy” at the MovingTowards a Sustainable <strong>Great</strong> <strong>Lakes</strong> Conference held in 2003, the organization notes,“One way to sustainabl[y] develop the commercial navigation industry that shouldbe given serious consideration is through tax reform. While this is a discussionunto itself, tax reform holds the potential to increasingly support the most fuelefficientmeans of moving bulk goods as water levels change because of, largely,fossil fuel consumption itself. In other words, with tax reform, the role ofcommercial navigation could become more and more important…” [5].The <strong>Great</strong> <strong>Lakes</strong> Commission’s Strategic Plan notes that in order to promote “[s]trongand growing commercial navigation on the <strong>Great</strong> <strong>Lakes</strong> and St. Lawrence Seaway” oneimportant objective is to “promote the efficient and cost-effective movement of goodsand people at the domestic and U.S./Canadian levels by eliminating infrastructure andpolicy barriers” [6]. One of these policy barriers is the myriad of taxes imposed on <strong>Great</strong><strong>Lakes</strong> shipping.Unfortunately, the importance of minimizing policy barriers on <strong>Great</strong> <strong>Lakes</strong> shipping hasnot been universally accepted. The Bush Administration’s fiscal year 2006 Budgetcontained a provision which would have imposed tolls on the U.S. portion of the St.Lawrence Seaway. As Minnesota Congressman Mark Kennedy noted,We believe this new fee will negatively impact agricultural exports from ourstates. Affordable commercial navigation is important to midwest farmers.Millions of tons of agricultural products such as wheat, corn, soybeans, oats,barley, peas and beans are exported through the Seaway each year. The <strong>Great</strong><strong>Lakes</strong> shipping industry estimates that the toll proposal will add 30 cents to thecost of each ton of export grain. International grain sales are often won or lost bypennies per ton.Cost effective shipping is important to other economic sectors as well. Theregion's steel industry is heavily dependent upon the Seaway. In turn, the NorthAmerican automotive industry relies upon cost effective steel products. At <strong>Great</strong><strong>Lakes</strong> ports, thousands of Americans are employed on the docks aslongshoremen, crane operators, warehousemen, truckers, cargo inspectors, tugoperators, vessel agents, marine pilots, etc.The toll proposal discriminates against the <strong>Great</strong> <strong>Lakes</strong> navigation system and theshippers that rely upon it. In fact, it is the only new maritime user fee in theAdministration's budget. <strong>Great</strong> <strong>Lakes</strong> ports compete with those on the East Coastand Gulf of Mexico for the handling of import and export cargoes. A new taximposed exclusively on <strong>Great</strong> <strong>Lakes</strong> shipping will disadvantage products from ourregion, and possibly result in a diversion of cargo to other ports with a resultingloss of jobs on our docks.It is important to note that <strong>Great</strong> <strong>Lakes</strong> navigation system users are already paying3
a user fee to support the operation and maintenance of the St. Lawrence Seaway(and other navigation infrastructure). The Harbor Maintenance Tax (HMT) wasenacted in 1986 for that specific purpose. It is currently assessed at all <strong>Great</strong><strong>Lakes</strong> and coastal ports. Revenue from the tax is deposited to the HarborMaintenance Trust Fund, which today carries a surplus balance of $459 million.New Seaway tolls would represent double taxation of navigation system users forthe same purpose [7].Such a proposal takes a step away from strategic regulation of <strong>Great</strong> <strong>Lakes</strong> shipping, andinstead looks at this enterprise as a revenue source to be utilized elsewhere within thegovernment’s budget. The proposed new toll on <strong>Great</strong> <strong>Lakes</strong> shipping, which in additionto dramatically increasing the tax cost to ship products through the lakes, would alsoinclude yet another layer of compliance for shipping companies. Rather than imposingsuch a new toll in an ad hoc manner, our research would propose a streamlined,simplified method for taxing shipped product. Chapter 3 of this report continues thisdiscussion of possible changes to the tax structure.1.3 Relevant literatureDataData sources for background to the tax structure presented in this report were derivedfrom the following:− United States. <strong>Maritime</strong> Administration. Dept of Transportation. Industry SurveySeries: <strong>Great</strong> <strong>Lakes</strong> Operators 2005. Nov. 2005. 18 May 2006http://www.marad.dot.gov/marad_statistics/ [8].This reports findings of a survey (conducted by the MARAD) of the U.S.-flagcarriers who account for 93 percent of the 2004 domestic (lake) <strong>Great</strong> <strong>Lakes</strong>traffic, and includes data on annual cargo, industries supplied to, carriers’investment preferences. This work supplies data on annual cargo transported onthe GL, and industries served.− United States General Accounting Office. <strong>Maritime</strong> Industry: FederalAssessments Levied on Commercial Vessels (GAO/RCED-93-65FS, Mar. 5,1993, and especially the supplement to this report, Commercial <strong>Maritime</strong>Industry: Supplemental Information on Federal Assessments (GAO/RCED-99-260S) [9].This key resource, and conversations with the U.S. Department of the Treasury,supplied the information from which data transcription for the assessmentinventory was made.4
− United States General Accounting Office. Commercial <strong>Maritime</strong> Industry:Updated Information on Federal Assessments, 09/16/1999, GAO/RCED-99-260)[10].− United States General Accounting Office. Marine Transportation: FederalFinancing and a Framework for Infrastructure Investments (GAO-02-1033September 2002) [11].− <strong>Great</strong> <strong>Lakes</strong> Waterborne Commerce. United States. <strong>Institute</strong> for Water Resources.Department of the Army Corps of Engineers. Waterborne Commerce of the US.2004. 23 May 2006 [12].This source supplied tables about commerce on the <strong>Great</strong> <strong>Lakes</strong>, and includesdefinitions, details on freight traffic, and in specific data on ton-mileage/freighttonsof foreign and domestic freight carried on the <strong>Great</strong> <strong>Lakes</strong>.<strong>Research</strong> Contributions<strong>Research</strong>ers whose discussions furthered our understanding of the specifics ofstakeholders’ positions, such as the port authorities, vessel operators/carriers, terminaloperators, trucking companies, warehouse or container freight station operators, railroads,importers and exporters, freight forwarders, cruise line operators, contract security forces,labor groups and dock workers, and trade associations include the following:For background on <strong>Great</strong> <strong>Lakes</strong> Marine Transportation Systems:− Stewart, Richard D. <strong>Great</strong> <strong>Lakes</strong> Marine Transportation System. <strong>Great</strong> <strong>Lakes</strong><strong>Maritime</strong> <strong>Research</strong> <strong>Institute</strong>. 10 Mar. 2006 [13].This white paper was prepared for the Midwest Freight Corridor Study andreports current operations, strategies for optimizing the GLMTS and GLchallenges (physical and non-physical, regulations).− The Cleveland Trans-Erie Ferry Feasibility Study May 20, 2004 [14].The Cleveland-Cuyahoga County Port Authority authorized a feasibility studyconcerning the commencement of a ferry service on Lake Erie. An analysis of USand Canadian laws was done, and included helpful discussions such asPart 1: US laws and regulations, HMT, Dept. of Homeland Security and marinesafety; Part 2: Canadian laws; Part 3: Index of US and Canadian laws mostapplicable to implementation of ferry service; Part 4: Three legal memoranda andspecial focus on HMT, truck cabotage and the Canadian Coasting Trade Act.For St. Lawrence Seaway Traffic Report:5
− St. Lawrence Seaway Management, Transport Canada and St. Lawrence SeawayDevel . US Dept of Transportation. St. Lawrence Seaway Traffic Report 2005Navigation Season. 2005. 17 May 2006 www.greatlakes-seaway.com [<strong>15</strong>].Including St. Lawrence Seaway combined data tables on toll traffic, cargo, andports.For Environment Advantages of Waterborne Transportation:− United States. <strong>Maritime</strong> Administration. Dept of Transportation. EnvironmentalAdvantages of Inland Barge Transportation. 1994 [16].Including discussion of energy efficiency of barge transportation results inenvironmental benefits and fuel savings.− United States. <strong>Maritime</strong> Administration. Dept of Transportation. TransportationMode Comparison Energy Environment Efficiency. 7 Jan. 2002. 6 June 2006http://www.mvr.usace.army.mil/navdata/tr-comp.htm [17].Including discussion of relative energy efficiencies.For status of HMTF:− United States. <strong>Institute</strong> for Water Resources. Army Corps of Engineers. Status ofthe Harbor Maintenance Trust Fund Fiscal Years 2000, 2001, 2002. 12 June 2006[18].− And also conversation and data from the U.S. Department of Treasury for updatedHMT revenues and transfersFor Bureau of Transportation Financials:− United States. Bureau of Transportation Statistics. Dept of Transportation.Government Transportation Financial Statistics 2003. 2004. 9 June 2006 [19].For articles on HMT:− United States. Congressional Budget Office. Impose a New Harbor-MaintenanceFee. 12 June 2006http://www.cbo.gov/bo2005/bo2005_showhit1.cfm?index=300-03 [20].− The U.S Harbor Maintenance Tax Controversy: Is there a solution?Kumar, Shashi N. " The U.S Harbor Maintenance Tax Controversy: Is There aSolution?" International Journal of <strong>Maritime</strong> Economics 4 (2002): 149-163. 12June 2006 [21].6
− Short Sea Vessel Service and Harbor Maintenance TaxNational Ports & Waterways <strong>Institute</strong>. Short Sea Vessel Service and HarborMaintenance Tax. Oct. 2005. Short Sea Shipping Cooperative Program, SCOOP;University of New Orleans. 9 June 2006 [22].For dredging information:− Duluth Superior Dredging Report from United States. Detroit District. ArmyCorps of Engineers. Annual Report/Contract Dredging Report. 10 Feb. 2006. 26July 2006 [23].− The National Dredging Needs Study of Ports and HarborsPlanning and Management Consultants, Ltd Illionis. The National DredgingNeeds Study of Ports and Harbors. 12 June 2006 [24].1.4 Methodology, basic approachThis project presents an inventory of taxes, fees, duties and assessments on <strong>Great</strong> <strong>Lakes</strong>maritime commerce. An analysis of the current scenario variables presents assessments inrelative significance. The project then recommends methods for decreasing the taximpact on <strong>Great</strong> <strong>Lakes</strong> shipping from both a tax burden and a compliance standpoint andoffers a viable option for government to help ease the tax complexities that shippingcompanies face.The project conducts a review of current tax regulations as applied to <strong>Great</strong> <strong>Lakes</strong>shipping and provides proposals for an improved tax system for <strong>Great</strong> <strong>Lakes</strong> shipping.1.5 Report organizationThis report is divided into the following Chapters:Chapter 1: IntroductionChapter 2: <strong>Great</strong> <strong>Lakes</strong> <strong>Maritime</strong> Tax InventoryChapter 3: Harbor Maintenance Tax ReviewChapter 4: Potential Economic Impacts of the <strong>Research</strong> ResultsChapter 5: ConclusionThe report includes a reference section which includes citations for all sources mentionedin the body of the report. This report also includes four appendices.Tables and figures are listed separately in the Contents pages as List of Tables and List ofFigures and follow chapter numbers plus sequential table or figure number.7
Chapter 2: <strong>Great</strong> <strong>Lakes</strong> <strong>Maritime</strong> Tax Inventory2.1 Tax dataData include individual assessments currently levied on the commercial maritimeindustry by federal agencies (119 assessments).Note: Most variables have footnotes. The database is presented in Appendix A to thisreport (without notes) and the full data is available in digital format from the <strong>Great</strong> <strong>Lakes</strong><strong>Maritime</strong> <strong>Research</strong> <strong>Institute</strong>.Each data record is made up of the following variables:Assessment nameDescription of the assessmentAgency that levies the assessmentType of service provided, tax, or duty associated with assessmentType of vessel the assessment is levied onCommerce type of vessel the assessment is levied onFlag type of vessel the assessment is levied onPayor of the assessmentEntity that collects the assessmentType of fund that receives the collectionsEntity that uses the collectionsFormula and frequency of assessmentCollection amounts for FY 1989 through FY 1991, FY 1996 through FY 1998,and estimated collections for FY 1999Collection limitationsLaws and regulations2.2 Analysis of Tax DataAn overview of federal agencies represented in this inventory shows the following rankorder by number of assessments:2.1 Overview of Federal Agencies Ranked by Number of Assessment on <strong>Maritime</strong>CommerceCoast Guard, U.S. Dept. of Transportation 25National Marine Fisheries Services, National Oceanic and Atmospheric Administration 23Federal <strong>Maritime</strong> Commission 17Panama Canal Commission 17Customs Service, U.S. Treasury 13<strong>Maritime</strong> Administration, U.S. Dept. of Transportation 8Federal Communications Commission 8Internal Revenue Service, U.S. Treasury 3Animal, Plant, and Health Inspection Service, U.S. Dept. of Agriculture 3National Marine Fisheries Services, National Oceanic and Atmospheric Administration 1Grain Inspection, Packers, and Stockyards Administration, U.S. Dept. of Agriculture 1Centers for Disease Control and Prevention, U.S. Dept. Health and Human Services 18
Detailed views of these data presented in this report include the following breakouts:1) Federal Commercial <strong>Maritime</strong> Assessments Other than <strong>Great</strong> <strong>Lakes</strong>Federal Commercial <strong>Maritime</strong> Assessments <strong>Great</strong> <strong>Lakes</strong> Only2) Top Collections Assessments3) Tables of Assessments by Stakeholder4) Kinds of Assessments Levied on <strong>Great</strong> <strong>Lakes</strong> Commerce5) HMT Tables1) Federal Commercial <strong>Maritime</strong> Assessments Other than <strong>Great</strong> <strong>Lakes</strong>Table 2.2: Federal Commercial <strong>Maritime</strong> Assessments Other than <strong>Great</strong> <strong>Lakes</strong>Panama Canal Commission (PCC)Name ofAssessment:Description of Assessment:Docking /Undocking For providing tug services for vessels docking, undocking, orTug Service FeeExtraordinaryTransit Tug ServiceFeeGeneral TugService FeeHandling Lines forDocking AfterTransit Service FeeHandling Tug LineService FeeHandling VesselLines Service FeeLaunch ServiceFee-DredgingDivisionLaunch ServiceFee-Marine BureauOffshore PilotageFeePilotage Fee at theGamboa Mooringshifting at berth (a)For providing tug services for vessels with physical or operatingdeficiencies at the time of transit and for vessels that request tugservice (a)For towing through the Canal and other transit tug services notcovered by a fixed fee (a)For PCC deckhands to assist the vessel crew in handling thecables that guide the vessel while docking after transit of theCanal (a)For PCC deckhands placed on board the vessel to receive andsecure the ropes from the tugboats to the vessel (a)For PCC deckhands to connect cables attached to locomotiveslocated on the side walls of Panama Canal locks to vesselstransiting the locks (a)For Dredging Division launches used to transport officers of theNational Port Authority of Panama or other Canal users as peragreement with the National Port Authority to assist small vesselsin lieu of a tug and to visit vessels for inspection purposes asauthorized by PCC (a)For Marine Bureau launches used to transport officers of theNational Port Authority of Panama or other canal users as peragreement with the National Port Authority to assist small vesselsin lieu of a tug and to visit vessels for inspection purposes asauthorized by PCC (a)Collected by:PCCPCCPCCPCCPCCPCCPCCPCCPayor:Owner oroperatorOwner oroperatorOwner oroperatorOwner oroperatorOwner oroperatorOwner oroperatorOwner oroperatorOwner oroperatorOwner oroperatorOwner oroperatorFor requiring or requesting a PCC pilot to board or debark avessel outside the Atlantic breakwater (a)PCCFor providing a PCC pilot at the PCC mooring facility at Gamboa(a)PCCFor providing a PCC pilot for vessels undergoing a dock trial (a)Pilotage Fee During Note: Testing a vessel’s engine while it is securely docked at aOwner orDock Trialpier to see if repairs will hold is an example of a dock trial. PCC operatorPort Pilotage Fee For providing a PCC pilot to dock, moor, or anchor a vessel after PCC Owner or9
transiting the Canal or to pilot the vessel beyond Canal waters (a)Sea Tug Service For providing tug services involving a trip to sea (a) PCCSpecial AdmeasurementFor determining a vessel’s Panama Canal tonnage and issuing aPanama Canal tonnage certificate when the vessel arrivesService Fee without proper documentation (a)PCCStandard TugServiceFor providing tug services to vessels coming into and out of eachset of locks and through Gaillard Cut (a)Tolls For Transit For utilizing the Panama Canal Waterway (a) PCCTransit BookingFee For reserving a time for vessels to transit the Panama Canal (a) PCCPCCoperatorOwner oroperatorOwner oroperatorOwner oroperatorOwner oroperatorOwner oroperator2) Federal Commercial <strong>Maritime</strong> Assessments <strong>Great</strong> <strong>Lakes</strong> Only:For the list of assessments that apply to the <strong>Great</strong> <strong>Lakes</strong> Only, please see the material inAppendix A to this report. For a version of these data that includes all variables,including footnotes, in digital or paper form, please see the <strong>Great</strong> <strong>Lakes</strong> <strong>Maritime</strong><strong>Institute</strong> or the University of Minnesota Duluth Labovitz School Bureau of Business andEconomic <strong>Research</strong>.3) Top Collections AssessmentsTable 2.3: Top Ten Revenue Producing Commercial <strong>Maritime</strong> Federal AssessmentsName of Assessment:Description of Assessment:Collections inThousands1999 (est.)Customs DutiesMerchandise Processing FeeHarbor Maintenance FeeTotal duties are calculated by summing the total dollars collectedfor consumption entries, warehouse withdrawals, mail entries,passenger baggage entries, crew member baggage entries,military baggage entries, informal entries, vessel repair entries, andother duties. Note: The "other duties" consist of duties in whichpayments of supplemental duties are recorded posted as cashreceipts. $18,030,233For processing documentation for imported cargo that is broughtinto the United StatesFor the loading or unloading of imported commercial cargo fromcommercial vessels at a U.S. port for which federal funds havebeen used since 1977 for construction, maintenance, or operation(Note: This assessment does not apply to ports de-authorized byfederal law before 1985.)$924,250$598,231Tolls For Transit For utilizing the Panama Canal Waterway $567,239Air/Sea Passenger feeInland Waterways Fuel TaxThis fee is levied for inspection and processing services that areprovided for all passengers aboard commercial vessels or aircraftarriving in the U.S. Customs territory from a place outside theUnited States.A tax imposed on any liquid used as a fuel on certain U.S. inlandand intercoastal waterways Note: Collected taxes are used forconstruction and rehabilitation of the inland waterways.$246,385$120,00010
Guarantee Fee for MARAD'sTitle XI ProgramVessel Tonnage TaxDocking /Undocking TugService FeeHandling Lines for DockingAfter Transit Service FeeFor covering a portion of the principal and interest on guaranteedfinancing in the event of a default and administrative, custodial, andinsurance costs associated with defaulted equipment Note:Collections specifically reimburse the agency for the potentialexpenses incurred in the event of a default.A tax on vessels entering the United States from any foreign port orplace (Note: Tax is based on the net tonnage of the vessel, as wellas the origin of the vessel's voyage).For providing tug services for vessels docking, undocking, orshifting at berthFor PCC deckhands to assist the vessel crew in handling thecables that guide the vessel while docking after transit of the Canal$100,000$67,989$53,300$40,40011
4) Tables of Assessments by StakeholderTable 2.4: <strong>Great</strong> <strong>Lakes</strong> Assessments Paid by Passenger and Non-Passenger Vessel OperatorsName of Assessment: Type of Service: Collected by: 1999 (est.)Harbor Maintenance Fee Miscellaneous Customs Service 598,231Inland Waterways Fuel Tax Taxes IRS 120,000Vessel Tonnage Tax Taxes Customs Service 67,989Ship Passengers International Departure Tax Taxes IRS 18,543Collection of Fees for Sanitation Inspection of Cruise Ships Physical Services HHS: USPHS (CDC) 1,300Stowage Examination Fee Physical Services USDA: GIPSA 1,175Reimbursement of Travel and Subsistence Costs for Overseas VesselInspections Physical Services DOT: Coast Guard 1,000Ship Radio Station License Regulatory Fee Admin. Proc. & Assoc. Services FCC 508International Telecommunications Settlements Physical services FCC 435Ship Radio Station License Application Fee Admin. Proc. & Assoc. Services FCC 427Certification Fee for Payment of Vessel Tonnage Tax and CertifyAdmeasurment by Foreign Vessels Admin. Proc. & Assoc. Services Customs Service 88Entry of Vessel from Foreign Port Fee Admin. Proc. & Assoc. Services Customs Service 72Clearance of Vessel to Foreign Port Fee Admin. Proc. & Assoc. Services Customs Service 56New Agreement Filings Requiring Commission Review Admin. Proc. & Assoc. Services FMC 48FMC: Special Permission Application Fee Admin. Proc. & Assoc. Services FMC 43Agreement Filing for Terminal and Carrier Exempt Agreements Application Fee Admin. Proc. & Assoc. Services FMC 25Ageement Filing Under Delegated Authority Application Fee Admin. Proc. & Assoc. Services FMC 24Agreement Amendment Filing Requiring Commission Action Admin. Proc. & Assoc. Services FMC 17Radio Communications Equipment Carriage Exemption Processing Fee Admin. Proc. & Assoc. Services FCC 10FMC: Special Docket Application Fee Admin. Proc. & Assoc. Services FMC 9Filing fee for service contracts and amendments Admin. Proc. & Assoc. Services FMC 8Receiving Post Entry Admin. Proc. & Assoc. Services Customs Service 6Receiving Manifest and Granting Permit to Unlade (s) Admin. Proc. & Assoc. Services Customs Service 512
Table 2.4: <strong>Great</strong> <strong>Lakes</strong> Assessments Paid by Passenger and Non-Passenger Vessel OperatorsIssuance Fee for a Permit to Proceed (p) Admin. Proc. & Assoc. Services Customs Service 4Petition for Rulemaking Fee Admin. Proc. & Assoc. Services FMC 1Formal Complaint Filing Fee Admin. Proc. & Assoc. Services FMC 1Additions and changes to filer registration Admin. Proc. & Assoc. Services FMC 1Name of Assessment: Type of Service: Collected by: 1999 (est.)Harbor Maintenance Fee Miscellaneous Customs Service 598,231Inland Waterways Fuel Tax Taxes IRS 120,000Vessel Tonnage Tax Taxes Customs Service 67,989Ship Passengers International Departure Tax Taxes IRS 18,543Collection of Fees for Sanitation Inspection of Cruise Ships Physical Services HHS: USPHS (CDC) 1,300Stowage Examination Fee Physical Services USDA: GIPSA 1,175Reimbursement of Travel and Subsistence Costs for Overseas VesselInspections Physical Services DOT: Coast Guard 1,000Ship Radio Station License Regulatory Fee Admin. Proc. & Assoc. Services FCC 508International Telecommunications Settlements Physical services FCC 435Ship Radio Station License Application Fee Admin. Proc. & Assoc. Services FCC 427Certification Fee for Payment of Vessel Tonnage Tax and CertifyAdmeasurment by Foreign Vessels Admin. Proc. & Assoc. Services Customs Service 88Entry of Vessel from Foreign Port Fee Admin. Proc. & Assoc. Services Customs Service 72Clearance of Vessel to Foreign Port Fee Admin. Proc. & Assoc. Services Customs Service 56New Agreement Filings Requiring Commission Review Admin. Proc. & Assoc. Services FMC 48FMC: Special Permission Application Fee Admin. Proc. & Assoc. Services FMC 43Agreement Filing for Terminal and Carrier Exempt Agreements ApplicationFee Admin. Proc. & Assoc. Services FMC 25Ageement Filing Under Delegated Authority Application Fee Admin. Proc. & Assoc. Services FMC 24Agreement Amendment Filing Requiring Commission Action Admin. Proc. & Assoc. Services FMC 17Radio Communications Equipment Carriage Exemption Processing Fee Admin. Proc. & Assoc. Services FCC 10FMC: Special Docket Application Fee Admin. Proc. & Assoc. Services FMC 9Filing fee for service contracts and amendments Admin. Proc. & Assoc. Services FMC 8Receiving Post Entry Admin. Proc. & Assoc. Services Customs Service 6Receiving Manifest and Granting Permit to Unlade (s) Admin. Proc. & Assoc. Services Customs Service 513
Table 2.4: <strong>Great</strong> <strong>Lakes</strong> Assessments Paid by Passenger and Non-Passenger Vessel OperatorsIssuance Fee for a Permit to Proceed (p) Admin. Proc. & Assoc. Services Customs Service 4Petition for Rulemaking Fee Admin. Proc. & Assoc. Services FMC 1Formal Complaint Filing Fee Admin. Proc. & Assoc. Services FMC 1Additions and changes to filer registration Admin. Proc. & Assoc. Services FMC 114
Table 2.5: <strong>Great</strong> <strong>Lakes</strong> Assessments Paid by Passenger and Non-PassengerOwnersName of Assessment:Type ofService:Collected by:1999 (est.)U.S. TotalsinthousandsGuarantee Fee for MARAD's Title XIProgram Miscellaneous DOT: MARAD $100,000Agricultural Quarantine andInspection User Fee (for commercialvessels over 100 net tons)PhysicalServicesCustomsService $23,386Commercial Vessel FeePhysicalservicesCustomsService $18,973Direct User Fees for Inspection andExamination of U.S. or ForeignCommercial VesselsPhysicalServicesDOT: CoastGuard $10,700Approval of Exchange of Certificate ofDocumentation Requiring MortgageConsentAdmin. Proc. &Assoc.ServicesDOT: CoastGuard $2,500Fisheries Obligation GuaranteeProgram Guarantee Fee Miscellaneous NOAA: NMFS $1,735Collection of Fees for SanitationInspection of Cruise ShipsPhysicalServicesHHS: USPHS(CDC) $1,300Reimbursement of Travel andSubsistence Costs for OverseasVessel InspectionsPhysicalServicesDOT: CoastGuard $1,000Title XII War Risk Interim Binder FeesBarge /Bulk Carrier FeeEvidence of Financial Responsibilityfor Water Pollution Certificate FeeShip Radio Station LicenseRegulatory FeeInternational TelecommunicationsSettlementsShip Radio Station LicenseApplication FeeNew Agreement Filings RequiringCommission ReviewFMC: Special Permission ApplicationFeeAgreement Filing for Terminal andCarrier Exempt AgreementsApplication FeeMiscellaneousAmerican WarRisk Agency $800Physical Customsservices Service $791Admin. Proc. &Assoc.DOT: CoastServices Guard $772Admin. Proc. &Assoc.Services FCC $508Physicalservices FCC $435Admin. Proc. &Assoc.Services FCC $427Admin. Proc. &Assoc.Services FMC $48Admin. Proc. &Assoc.Services FMC $43Admin. Proc. &Assoc.Services FMC $25<strong>15</strong>
Agreement Filing Under DelegatedAuthority Application FeeAgreement Amendment FilingRequiring Commission ActionCOFR for Indemnification ofPassengers for Nonperformance ofTransportation Application FeeRadio Communications EquipmentCarriage Exemption Processing FeeFMC: Special Docket Application FeeCOFR to Meet Liability Incurred forDeath or Injury to Passengers orOther Persons on VoyagesApplication FeeForeign Transfer of Ownership orRegistry Application FeeForeign Transfer of OwnershipPursuant to MARAD ContractsForeign Fishing Permit ApplicationFeeFormal Complaint Filing FeePetition for Rulemaking FeeAquaculture PermitAdmin. Proc. &Assoc.Services FMC $24Admin. Proc. &Assoc.Services FMC $17Admin. Proc. &Assoc.Services FMC $<strong>15</strong>Admin. Proc. &Assoc.Services FCC $10Admin. Proc. &Assoc.Services FMC $9Admin. Proc. &Assoc.Services FMC $8Admin. Proc. &Assoc.Services DOT: MARAD $7Admin. Proc. &Assoc.Services DOT: MARAD $7Admin. Proc. &Assoc.Services NOAA: NMFS $4Admin. Proc. &Assoc.Services FMC $1Admin. Proc. &Assoc.Services FMC $1Admin. Proc. &Assoc.Services NOAA: NMFS $1Table 2.6: <strong>Great</strong> <strong>Lakes</strong> Assessments Paid by Passenger and Non-Passenger Exporters1999 (est.) U.S.Name of Assessment:Type ofService: Collected by:Totals inthousandsCustoms DutiesMerchandise Processing FeePhytosanitary Certificate Fee forPlants and Plant ProductsExport Health CertificateEndorsement Fees for AnimalsStowage Examination FeeMiscellaneousCustomsService $18,030,233Admin. Proc. &Assoc.CustomsServices Service $924,250PhysicalServices USDA: APHIS $4,791PhysicalServices USDA: APHIS $3,823PhysicalServices USDA: GIPSA $1,17516
Table 2.7: <strong>Great</strong> <strong>Lakes</strong> Assessments Paid by Passenger and Non-Passenger Importers1999 (est.) U.S.Name of Assessment:Type ofService: Collected by:Totals inthousandsCustoms DutiesMerchandise Processing FeeHarbor Maintenance FeeStowage Examination FeeMiscellaneousAdmin. Proc. &Assoc.ServicesCustomsService $18,030,233CustomsService $924,250CustomsService $598,231MiscellaneousPhysicalServices USDA: GIPSA $1,175Table 2.8: <strong>Great</strong> <strong>Lakes</strong> Assessments Paid by Passenger and Non-Passenger Other StakeholdersPayor:Name of Assessment:Harbor Maintenance FeeAir/Sea Passenger feeExport Health CertificateEndorsement Fees for AnimalsInternational TelecommunicationsSettlementsNew Agreement Filings RequiringCommission ReviewFMC: Special Permission ApplicationFeeAgreement Filing for Terminal andCarrier Exempt AgreementsApplication FeeAgreement Filing Under DelegatedAuthority Application Feeforeign trade zoneuser, domesticshipper, oroperator ofcommercialpassenger vesselIndividualpassengerbrokerU.S. ship ownersutilizingtelecommunicationservices offforeign coastsmarine terminaloperatorNVOCCmarine terminaloperatormarine terminaloperatorType ofService:MiscellaneousPhysicalservicesPhysicalServicesCollectedby:1999 (est.)U.S.Totals inthousandsCustomsService $598,231CustomsService $246,385USDA:APHIS $3,823Physicalservices FCC $435Admin. Proc. &Assoc.Services FMC $48Admin. Proc. &Assoc.Services FMC $43Admin. Proc. &Assoc.Services FMC $25Admin. Proc. &Assoc.Services FMC $2417
Agreement Amendment FilingRequiring Commission ActionCOFR for Indemnification ofPassengers for Nonperformance ofTransportation Application FeeFMC: Special Docket Application FeeCOFR to Meet Liability Incurred forDeath or Injury to Passengers orOther Persons on VoyagesApplication FeeForeign Fishing Permit ApplicationFeeFormal Complaint Filing FeePetition for Rulemaking Feemarine terminaloperatorchartererNVOCCchartererrepresentative ofthe foreign fishingnationshipper, or otherinterested partyshipper, or otherinterested partyAdmin. Proc. &Assoc.Services FMC $17Admin. Proc. &Assoc.Services FMC $<strong>15</strong>Admin. Proc. &Assoc.Services FMC $9Admin. Proc. &Assoc.Services FMC $8Admin. Proc. &Assoc.ServicesNOAA:NMFS $4Admin. Proc. &Assoc.Services FMC $1Admin. Proc. &Assoc.Services FMC $<strong>15</strong>) Kinds of Assessments Levied on <strong>Great</strong> <strong>Lakes</strong> CommerceTable 2.9: Tax Assessments on <strong>Great</strong> <strong>Lakes</strong> <strong>Maritime</strong> CommerceAssessment NameType of Service1999 U.S.Totals Est.inThousandsHarbor Maintenance "Fee" [declared a tax by U.S. Supreme Court, 1998] Miscellaneous $598,231For the loading or unloading of imported commercial cargo from commercial vessels at a U.S. port for which federal fundshave been used since 1977 for construction, maintenance, or operation (Note: This assessment does not apply to portsde-authorized by federal law before 1985.)Inland Waterways Fuel Tax (Not applied to <strong>Great</strong> <strong>Lakes</strong> per se butapplied to inland and intercoastal waterways) Taxes $120,000A tax imposed on any liquid used as a fuel on certain U.S. inland and intercoastal waterways Note: Collected taxes areused for construction and rehabilitation of the inland waterways.Vessel Tonnage Tax Taxes $67,989A tax on vessels entering the United States from any foreign port or place (Note: Tax is based on the net tonnage of thevessel, as well as the origin of the vessel's voyage).Ship Passengers International Departure Tax Taxes $18,543A tax imposed on each passenger who embarks from or disembarks in a U.S. port and whose voyage extends over 1 ormore nights (more than 24 hours)18
Table 2.10: Duty Assessments on <strong>Great</strong> <strong>Lakes</strong> <strong>Maritime</strong> CommerceAssessment NameType of Service1999 U.S.Totals Est.inThousandsCustoms Duties Miscellaneous $18,030,233Total duties are calculated by summing the total dollars collected for consumption entries, warehouse withdrawals, mailentries, passenger baggage entries, crew member baggage entries, military baggage entries, informal entries, vesselrepair entries, and other duties. Note: The "other duties" consist of duties in which payments of supplemental duties arerecorded posted as cash receipts.19
Table 2.11: Fee Assessments on <strong>Great</strong> <strong>Lakes</strong> <strong>Maritime</strong> Commerce (descriptions available in the appendix matter to this report)1999 U.S. totals est. inassessment nametype of servicethousandsMerchandise Processing Fee Admin. Proc. & Assoc. Services $924,250Tolls For Transit Physical services $567,239Air/Sea Passenger fee Physical services $246,385Guarantee Fee for MARAD's Title XI Program Miscellaneous $100,000Docking /Undocking Tug Service Fee Physical services $53,300Handling Lines for Docking After Transit Service Fee Physical services $40,400Transit Booking Fee Admin. Proc. & Assoc. Services $35,200Agricultural Quarantine and Inspection User Fee Physical Services $23,386Commercial Vessel Fee Physical services $18,973Direct User Fees for Inspection and Examination of U.S. or Foreign Commercial Vessels Physical Services $10,700Offshore Pilotage Fee Physical services $5,300High Seas Fishing Compliance Act Permit Application Admin. Proc. & Assoc. Services $5,000Phytosanitary Certificate Fee for Plants and Plant Products Physical Services $4,791Export Health Certificate Endorsement Fees for Animals Physical Services $3,823Approval of Exchange of Certificate of Documentation Requiring Mortgage Consent Admin. Proc. & Assoc. Services $2,500Fisheries Finance Program Application Fee Admin. Proc. & Assoc. Services $1,735Fisheries Obligation Guarantee Program Guarantee Fee Miscellaneous $1,735Collection of Fees for Sanitation Inspection of Cruise Ships Physical Services $1,300Stowage Examination Fee Physical Services $1,175Launch Service Fee-Dredging Division Physical services $1,087Reimbursement of Travel and Subsistence Costs for Overseas Vessel Inspections Physical Services $1,000Title XII War Risk Interim Binder Fees Miscellaneous $800Barge /Bulk Carrier Fee Physical services $791Evidence of Financial Responsibility for Water Pollution Certificate Fee Admin. Proc. & Assoc. Services $772Ship Radio Station License Regulatory Fee Admin. Proc. & Assoc. Services $508Ship Radio Station License Application Fee Admin. Proc. & Assoc. Services $427Bluefin Tuna Permit Application Fee Admin. Proc. & Assoc. Services $414Special Ad-measurement Service Fee Physical services $240Coastal Migratory Pelagic Fish Permit Application Fee Admin. Proc. & Assoc. Services $9720
Certification Fee for Payment of Vessel Tonnage Tax and Certify Ad-measurement byForeign Vessels Admin. Proc. & Assoc. Services $88Entry of Vessel from Foreign Port Fee Admin. Proc. & Assoc. Services $72Atlantic Swordfish Permit Application Fee Admin. Proc. & Assoc. Services $63Clearance of Vessel to Foreign Port Fee Admin. Proc. & Assoc. Services $56Reef Fish Permit Application Fee Admin. Proc. & Assoc. Services $44FMC: Special Permission Application Fee Admin. Proc. & Assoc. Services $43Snapper-Grouper Permit Application Fee Admin. Proc. & Assoc. Services $36Shark Permit (fee) Admin. Proc. & Assoc. Services $29Agreement Filing for Terminal and Carrier Exempt Agreements Application Fee Admin. Proc. & Assoc. Services $25Agreement Filing Under Delegated Authority Application Fee Admin. Proc. & Assoc. Services $24Groundfish Endorsements Permit Admin. Proc. & Assoc. Services $23Marine Mammal Authorization Program Registration Fee Admin. Proc. & Assoc. Services $22Spiny Lobster Permit Application Fee Admin. Proc. & Assoc. Services $<strong>15</strong>COFR for Indemnification of Passengers for Nonperformance of Transportation ApplicationFee Admin. Proc. & Assoc. Services $<strong>15</strong>Radio Communications Equipment Carriage Exemption Processing Fee Admin. Proc. & Assoc. Services $10FMC: Special Docket Application Fee Admin. Proc. & Assoc. Services $9COFR to Meet Liability Incurred for Death or Injury to Passengers or Other Persons onVoyages Application Fee Admin. Proc. & Assoc. Services $8Foreign Transfer of Ownership or Registry Application Fee Admin. Proc. & Assoc. Services $7Foreign Transfer of Ownership Pursuant to MARAD Contracts Admin. Proc. & Assoc. Services $7South Atlantic Rock Shrimp Permit Admin. Proc. & Assoc. Services $7Receiving Manifest and Granting Permit to Unlade (s) Admin. Proc. & Assoc. Services $5Commercial Spiny Lobster Permit Admin. Proc. & Assoc. Services $5Issuance Fee for a Permit to Proceed (p) Admin. Proc. & Assoc. Services $4Foreign Fishing Permit Application Fee Admin. Proc. & Assoc. Services $4Pelagics Permit Admin. Proc. & Assoc. Services $2Formal Complaint Filing Fee Admin. Proc. & Assoc. Services $1Petition for Rulemaking Fee Admin. Proc. & Assoc. Services $1Vessel Certificate of Inclusion Application Fee Admin. Proc. & Assoc. Services $1Aquaculture Permit Admin. Proc. & Assoc. Services $1Bottomfish /Seamount Groundfish Permit Admin. Proc. & Assoc. Services $1Conciliation Service Application Fee Admin. Proc. & Assoc. Services $0Declaratory Order Application Fee Admin. Proc. & Assoc. Services $0Informal Procedures Application Fee Admin. Proc. & Assoc. Services $021
Petition for Investigation to Determine Existence of Adverse Conditions Affecting U.S.-flagCarriers Admin. Proc. & Assoc. Services $0Petition for Relief for U.S.-flag Vessels Operating in Foreign-to-Foreign Trades Admin. Proc. & Assoc. Services $0Petition for Section 19 Relief Admin. Proc. & Assoc. Services $0Authority to Transfer Ownership of Ships Built With Construction Subsidies Application Fee Admin. Proc. & Assoc. Services $0Foreign Fishing Observer Fee Physical Services $0Foreign Fishing Poundage Fee Miscellaneous $0Golden Crab Permit Admin. Proc. & Assoc. Services $0Wreckfish Permit Application Fee Admin. Proc. & Assoc. Services $0Table 2.12: Other Assessments, including Permits, Administrative Charges, and Other User Fees on <strong>Great</strong><strong>Lakes</strong> <strong>Maritime</strong> Commerce1999 U.S. Totals Est. inAssessment nameType of ServiceThousandsInternational Telecommunications Settlements Physical services $435Payment of line charges for U.S. ships communicating via foreign coast earth stationsNew Agreement Filings Requiring Commission ReviewFor processing new agreements that require review by the CommissionAdmin. Proc. & Assoc.Services $48Agreement Amendment Filing Requiring Commission ActionFor processing agreement amendments that require review by the CommissionReceiving Post EntryAdmin. Proc. & Assoc.Services $17Admin. Proc. & Assoc.Services $6For processing a report of merchandise found but not manifested for vessels entering into the U.S. Customs territory (Note: Name changeonly).Permission to Correct Clerical Errors on Service ContractsApplicationAdmin. Proc. &Assoc. Services $0For processing requests to correct clerical or administrative errors in the essential terms of a serivce contract22
6) HMT TablesAs noted above and in the references, Harbor Maintenance Trust Fund data is availableonly through the U.S. Treasury Bureau of Public Debt. The data from the source does notmake available the answer to some interesting questions about compliance levels for theHMT, the details of how much refund activity has followed the Supreme Court decisionto grant exclusion for exporters, and HMT collections by port.Table 2.13: Harbor Trust Fund Transfers and Revenues 1988-200623
2.3 Challenges of <strong>Great</strong> <strong>Lakes</strong> <strong>Maritime</strong> Infrastructure: Army Corps of EngineersDredging on the <strong>Great</strong> <strong>Lakes</strong> PortsTable 2.<strong>15</strong> presents comparative ACE activity data by district within the <strong>Great</strong> <strong>Lakes</strong> &Ohio River Division. District data is also presented in detail by port. Figure 2 shows thegeographic distribution of districts within the division.BuffaloChicagoDetroitHuntingtonLouisvilleNashvillePittsburghFigure 2: <strong>Great</strong> <strong>Lakes</strong> & Ohio River Division, Army Corps of Engineers Dredging Districts.Source: http://www.lrd.usace.army.mil/As has been discussed in Stewart’s 2003 Twin Ports Intermodal Freight Terminal Studyand Fruin and Fortowsky’s 2004 Modal Shifts from the Mississippi River andDuluth/Superior to Land Transportation study, beneficiaries of ACE dredging activity donot necessarily correspond with payors of the HMT. For instance, the HMT paid by thenow terminated Incan Superior railcar ferry (estimated at $200,000 in 1991) delivered nobenefit to this vessel requiring a loaded draft of about 17 feet in a navigation channel of27 feet [25]. An overview of beneficiaries of the HMT follows, with detailed <strong>Great</strong> <strong>Lakes</strong>port by port totals for 2000 to 2004 amounts spent for port maintenance supported by thecollections of the HMT.24
Table 2.14: Total Bid Dollars by Corps of Engineers, by District in the <strong>Great</strong> <strong>Lakes</strong> & Ohio River Division,2000-2005District 2000 2001 2002 2003 2004 2005DETROIT $10,444,958 $10,966,793 $8,475,339 $6,493,502 $5,485,298 $10,172,216BUFFALO $5,533,946 $5,892,469 $4,942,435 $3,<strong>15</strong>7,400 $6,497,900 $4,025,160HUNTINGTON $141,800 $1,392,221 $1,012,881 $1,544,632 $1,922,831 $1,232,033CHICAGO $4,548,503 $2,784,000 - - - -LOUISVILLE $3,463,784 $3,577,197 $3,650,087 $3,843,<strong>15</strong>3 $4,053,216 -PITTSBURGH $334,095 $1 $2 $112,846 $1 $32,000Total Dollars(Bid) $587,819,249 $790,126,695 $1,013,629,099 $600,260,707 $666,377,838 $466,963,933Source: BBER. http://www.usace.army.mil/Table 2.<strong>15</strong>: Buffalo District Detail, ACE Activity byPort, 2000-2004Year Port Actual $ Spent2000 Fairport Harbor $798,6452000 Lorain Harbor $361,0952000 Huron $334,1492000 Dunkirk $231,1852000 Irondequoit Harbor $146,8992000 Wilson Harbor $116,5222000 Oak Orchard Harbor $96,9592000 Cleveland(Cuy.R.) -2000 Sandusky -2000 Toledo Harbor -2000 Toledo(River) -2000 TOTALS $2,085,4542001 Maumee River/Bay $1,725,0002001 Ashtabula $660,8002001 Fairport $651,2892001 Sandusky $472,4632001 Rochester $464,7352001 Toussaint $382,7242001 Vermilion $204,6172001 Cuyahoga2001 TOTALS $4,561,6272002 Toledo Maumee River $947,8672002 Huron $468,1112002 Toledo Maumee River $385,0002002 Dunkirk $273,<strong>15</strong>82002 Cuyahoga River -2002 Fairport -2002 TOTALS $2,074,1362003 Buffalo River & Black Rock C $2,0032003 Cleveland $2,0032003 Huron Harbor $2,0032003 Lorain Harbor $2,0032003 TOTALS $8,0122004 Maumee Bay $1,542,1002004 Cleveland Harbor $1,376,7082004 Maumee River $830,600Rocky River/Vermilion2004 Harbor $414,9582004 Cooley Canal/West Harbor $410,2502004 Conneaut Harbor $390,7242004 Toussaint Harbor $218,8702004 Buffalo River -G. Sodus/Oak2004 Orchard/Oswego -2004 Rochester Harbor -2004 TOTALS $5,184,211Chicago District2000 Calumet Harbor & River, Il $2,762,2892000 Burns Small Boat Hbr, In $1,350,0812000 Michigan City Hbr, In $839,8002000 Waukegan Harbor, Il $434,6842000 TOTALS $5,386,8542001 Calumet Harbor & River, Il -2001 Waukegan Harbor, Il -2001 TOTALS -25
Detroit District2000 St Clair River, Mi $1,861,8962000 Green Bay Harbor, Wi $1,825,4002000 Saginaw River, Mi $1,471,9012000 Holland Harbor, Mi (Inner) $1,033,0702000 Clinton River, Mi $764,4042000 Detroit River, Mi (Eo&Ll) $754,3112000 Duluth-Superior Hbr Mn&Wi $705,9862000 Two Rivers Harbor, Wi $310,7162000 St Joseph Harbor, Mi (8a) $252,2492000 Caseville Harbor, Mi (8a) $212,<strong>15</strong>62000 Ontonagon Harbor, Mi $197,0912000 Lexington Harbor, Mi (8a) $165,2752000 Grand Haven Hbr, Mi (Outer) $<strong>15</strong>7,8852000 Saugatuck Harbor, Mi $140,3302000 Menominee Harbor, Wi $138,3652000 Manitowoc Harbor, Wi $128,4282000 Harrisville Harbor, Mi (8a) $113,4092000 Whitefish Point, Mi $95,6802000 Leland Harbor, Mi $85,2702000 Big Bay Harbor, Mi $82,1852000 Holland Harbor, Mi (Outer) $75,5892000 Pentwater Harbor, Mi $73,7872000 South Haven Harbor, Mi $48,0572000 Arcadia Harbor, Mi $41,8042000 TOTALS $10,735,2442001 Green Bay Harbor, Wi $2,451,3792001 Milwaukee County Port, Mi $633,9862001 Duluth-Superior Hbr Mn&Wi $546,5362001 Saginaw River, Mi $427,9272001 Ludington Harbor, Mi $417,8942001 Point Lookout Hbr, Mi (8a) $409,9752001 Manitowoc Harbor, Wi $382,8602001 Monroe Harbor, Mi $341,3942001 Little Lake Harbor, Mi $338,0232001 Ontonagon Harbor, Mi $319,8102001 Manistee Harbor, Mi $277,3282001 St Joseph Harbor, Mi (O) $262,7092001 Saugatuck Harbor, Mi $259,1412001 Bolles Harbor, Mi $193,1232001 Au Sable Harbor, Mi $189,7292001 St Joseph Hbr, Mi (I) $168,6142001 Port Sanilac Harbor, Mi $<strong>15</strong>9,5622001 Grand Haven Harbor, Mi(O) $148,5652001 Saxon Harbor, Mi (8a) $133,1672001 North Manitou Is Hbr, Mi $121,9502001 Duluth Superior Hbr Mn&Wi $118,2762001 Cornucopia Harbor, Wi $98,9202001 Holland Harbor, Mi (O) $84,8882001 Pentwater Harbor, Mi $82,7442001 Leland Harbor, Mi $80,0722001 Black River(Up), Mi $70,3842001 White Lake Harbor, Mi $59,1332001 New Buffalo Harbor, Mi $45,5322001 Arcadia Harbor, Mi $37,3922001 Milwaukee Harbor, Wi $21,5972001 St Marys River, Mi -2001 TOTALS $8,882,6112002 Detroit River, Mi $1,876,1102002 Green Bay Harbor, Wi $1,758,9992002 Saginaw River, Mi $1,636,7222002 Duluth-Superior Hbr Mn&Wi $813,5502002 Rouge River, Mi $609,2482002 Ontonagon Harbor, Mi $537,7052002 Big Suamico Harbor, Wi $303,9822002 Muskegon Harbor., Mi $283,2162002 South Haven Harbor, Mi $198,5912002 St Joseph Harbor, Mi(O) $193,5872002 Portage Lake Harbor, Mi $190,5062002 Grand Haven, Harbor Mi (O) $170,8242002 Port Wing Harbor, Wi $160,4242002 Holland Harbor, Mi (O) $126,5482002 Leland Harbor, Mi $79,2962002 Pentwater Harbor, Mi $65,2452002 Arcadia Harbor, Mi $62,6442002 TOTALS $9,067,1972003 St Marys River, Mi $1,825,0922003 Green Bay Harbor, Wi $1,804,4552003 Black River (Ph), Mi $617,8782003 Ontonagon Harbor, Mi $435,8602003 Monroe Harbor, Mi $329,9472003 Little Lake Harbor, Mi $238,5732003 Port Washington Harbor, Wi $185,5952003 St Joseph Harbor, Mi $126,8852003 Holland Harbor, Mi $126,5002003 Grand Haven Harbor, Mi $103,6012003 Leland Harbor, Mi $80,5462003 New Buffalo Harbor, Mi $67,1242003 Lexington Harbor, Mi $60,4432003 Port Sanilac Harbor, Mi $57,4072003 Pentwater Harbor, Mi $37,38926
2003 Arcadia Harbor, Mi $33,2462003 Grand Traverse Bay Hbr, Mi2003 TOTALS $6,130,5412004 Manistee Harbor, Mi $402,4082004 St Joseph Harbor, Mi $286,3362004 Holland Harbor, Mi $217,7492004 Grand Haven Harbor, Mi $177,7102004 Port Austin Harbor, Mi $172,8962004 Saugatuck Harbor, Mi $<strong>15</strong>9,0562004 Bolles Harbor, Mi $135,2382004 Little Lake Harbor, Mi $104,6022004 Frankfort Harbor, ,Mi $90,9052004 Leland Harbor, Mi $83,0102004 Pentwater Harbor, Mi $78,1692004 Arcadia Harbor, Mi $39,4242004 Ontonagon Harbor, Mi $02004 Detroit River, Mi -2004 Duluth-Superior Mn&Wi -2004 Muskegon Harbor, Mi -2004 Saginaw River, Mi -2004 St Clair River, Mi $1,947,5012004 TOTALS $3,895,004Louisville2000 Ohio Riv Open (4 Yr Opt) $2,410,1902000 TOTALS $2,410,1902001 Ohio Riv Open(1of4yr Opt) $1,998,4812001 TOTALS $1,998,4812002 Ohio Riv Open 2nd Of 4yr Opt $1,665,8722002 TOTALS $1,665,8722003 Ohio Riv Open 3rd Of 4yr Opt $1,963,5412003 TOTALS $1,963,5412004 Ohio Riv Open 4yr Of 4yr Opt $1,945,3502004 TOTALS $1,945,350Huntington2000 Portsmouth Harbor $140,3872000 TOTALS $140,3872001 Elk River Harbor $439,7292001 Big Sandy Harbor $418,7212001 Kanawha River $143,0502001 TOTALS $1,001,5002003 Big Sandy River - Opt Yr 1 $811,9902003 Elk River $236,0292003 Portsmouth Harbor $88,4752003 TOTALS $1,136,49427
2.4 Highlighting the Harbor Maintenance TaxFrom the foregoing tables we find the Harbor Maintenance Tax to be very significant tothe overall burdens placed on <strong>Great</strong> <strong>Lakes</strong> maritime commerce. Noting especially theranking of assessments for the top revenue producing assessments, we note from Table2.3 HMT is third in assessments paid by importers, behind Customs Duties, andMerchandise Processing Fee.The HMT is unique to commerce assessments in that the revenue is dedicated tomaintenance of maritime transportation infrastructure. The following chapter in thisreport discusses the HMT and possible changes to the current tax structure to improve theefficiency of port maintenance tax collection and expenditure, and to improve intermodaltransportation fuel efficiency.28
Chapter 3: The U.S. Harbor Maintenance Tax, a Bad Idea Whose Time hasPassed?It’s a sunny mid-summer afternoon at South Bass Island on Lake Erie north of Sandusky,Ohio. The harbor on South Bass Island is filled with hundreds of recreational boatersenjoying the beautiful summer weather, touring the island’s historic sites and stopping forlunch and cold beverage at many of the island’s bars and restaurants. If you travel to thesouth end of the island, you might see an ore carrier traveling through the <strong>Great</strong> <strong>Lakes</strong>.The ore carrier will not, however, stop at South Bass Island since its shallow water harboris not suitable for deep water commercial vessels.The Edward L. Ryerson leaves Duluth Harbor bound for Cleveland with a cargo of25,000 tons of taconite a few tons below its maximum capacity. In an unusual attempt toutilize this excess capacity, the Ryerson agrees to accept a small container from St. JudeMedical in Minneapolis. The container (which weighs only a few pounds) holds 500 newheart valves bound for the Cleveland Clinic. The Ryerson can handle the extra weight,and its merchant mariners barely noticethe additional cargo. Upon arrival inCleveland, the two cargo items (taconiteand heart valves) are unloaded andforwarded to US Steel and the ClevelandClinic for further processing. Bothproducts are subject to a tax that fewU.S. taxpayers are familiar with, theU.S. Harbor Maintenance Tax or HMT.Here is where the similarity in transportof these two items ends. The HMT is anad valorem (value based) tax, so theFigure 3: Edward L. Ryersonheart valves draw $4,165 in tax while thetaconite draws $1,836 in tax. It’s ananomaly in our tax system that a tax intended to recover the government’s cost of canaland port dredging would impose a lower amount of tax on 25,000 tons of unprocessedsteel raw materials, than it does on a few pounds of heart valves, but that is how the HMTis structured.It’s also an anomaly that the recreational boaters at South Bass Island received $132,310dollars in dredging services in 1999. An amount paid entirely by the HMT, a tax that isnot assessed to them at all, but rather is borne by the ore carrier and all other forms ofcommercial maritime transportation. As shown in the foregoing <strong>Great</strong> <strong>Lakes</strong> taxinventory section of this report, the HMT is one of the most significant contributors to<strong>Great</strong> <strong>Lakes</strong> maritime infrastructure. This section of the report will address the problemsnoted above, and explain why the HMT should be abolished.History of the Harbor Maintenance TaxAs shown in the HMT timeline in the previous report section, and as detailed inAppendix C, the U.S. has a long history of taxing products transported onboard ship;29
some of the first taxes imposed by the southern colonies were import taxes [26]. In 1789,Congress authorized the first improvement projects for navigable channels. The ArmyCorps of Engineers was established in 1824 as the agency charged with maintaining thenation’s water navigation [27].The HMT was enacted as part of the Water Resources Development Act of 1986 [28].Prior to the HMT’s enactment, general funds from the U.S. Treasury were used to coverthe federal government’s share of costs to maintain and deepen both inland ports andcoastal ports. The HMT was intended to recover a portion of the federal government’scost of maintaining the nation’s deep draft navigation channels [29]. The Act createdboth the HMT and the Harbor Maintenance Trust Fund (HMTF). The HMTF is the trustfund which holds HMT revenues from the time they are collected, until they aredisbursed by Congressional appropriation [30].Originally, the HMT was intended to recover only 40% of port maintenance costs.However, in 1990 the HMT was more than tripled by Congress to its current rate equal to0.125 percent of the value of the commercial cargo involved [31]. This dramatic increasein the HMT was intended to recover 100 percent of maintenance dredging expenses. TheHMT currently is imposed at the time of unloading [32] on importers and domesticshippers, but the term domestic shipper would include foreign flag vessels travelingbetween U.S. ports [33]. The HMT was created as an ad valorem tax in an attempt tominimize its impact on U.S. exports, especially price sensitive bulk commodities [34].The impact on U.S. exports was eliminated by a U.S. Supreme Court decision in Marchof 1998, where the court held that the HMT was unconstitutional as applied to exports[35]. One might have expected that this dramatic change in application of the HMTwould have resulted in a major drop in HMT revenues. However, the decrease in HMTrevenue from 1997 to its low-water mark in 1999 was only 21.99% [36]. By 2001, HMTrevenues had once again exceeded their pre-1998 levels [37].Legal Challenges to the HMT’s ValidityThe principal legal challenge to the HMT began with a constitutional challenge based onthe export clause of the U.S. Constitution. The U.S. Shoe Corporation brought an actionon November 3, 1994 against the U.S. Government in the Court of International Trade(CIT). U.S. Shoe sought a refund of the HMT it had paid on exports arguing that theHMT was an unconstitutional tax as applied to exports [38]. Both the CIT and the Courtof Appeals for the Federal Circuit held that the HMT was a tax, not a user fee, and that asa tax, it violated the Export Clause. The U.S. Supreme Court agreed to hear the case afterthe decision by the Federal Circuit.The first step in the Supreme Court’s analysis of the HMT was to determine whether theCIT had proper jurisdiction over the case as filed by U.S. Shoe. The scope of the CIT’sjurisdiction is established by 28 U.S.C. §<strong>15</strong>81. The HMT’s own jurisdictional provisionstates that for jurisdiction purposes, the HMT, “shall be treated as if such tax were acustoms duty” [39]. The CIT’s jurisdictional statute states that the CIT has jurisdictionover civil actions against the U.S. that, “…arises out of any law of the United States30
providing for – (1) revenue from imports or tonnage; (4) administration and enforcementwith respect to the matters referred to in paragraphs (1) – (3) of this subsection….” [40].The Supreme Court found HMT claims to be within the jurisdiction of the CIT because atthat time, the HMT applied to both imports and exports and its specific jurisdictionalprovision references revenue from imports. Even though the lawsuit involved the HMT’sapplicability to exports, it was possible for the CIT to rely on jurisdiction created overimports [41].The Supreme Court then turned to the issue of whether the HMT was a “tax” whichwould potentially be impermissible under the Export Clause, or whether it qualified as a“user fee” which might survive Export Clause scrutiny. The Court found that the HMT isa tax, basing its decision on the Congressional description of the HMT as a “tax on anyport use” [42]. The Court went on to analyze the HMT and determined that it is not auser fee. It distinguished prior cases involving user fees such as the civil aircraftregistration fee, [43] and other valid user charges that involved either the DormantCommerce Clause or the Takings Clause, finding that the Export clause contained a“simple direct and unqualified prohibition on any taxes or duties…on exports” [44]. TheCourt then analogized the HMT to the excise tax on tobacco that was the subject of theCourt’s 1876 decision in Pace v. Burgess [45]. In Pace, the stamps required to selltobacco in the export market, “‘bore no proportion whatever to the quantity or value ofthe package on which [the stamp] was affixed’ and the fee was not excessive” [46].Since the amount of HMT paid by an exporter, “does not correlate reliably with thefederal harbor services used or useable exporter” [47] it imposes a tax, not a user fee, andas such was invalid as applied to exports. The Court invalidated the HMT as it applied toexports, but since the Export Clause does not prohibit taxing imports or domestictransportation, the HMT continues to apply to both imported items and domestictransportation.Litigation Subsequent to U.S. ShoeSince the Court’s decision in U.S. Shoe, the Harbor Maintenance Tax has continued to becontroversial. On February 28, 2000, the Court of Appeals for the Federal Circuit ruledthat there was no statute of limitations for exporters asserting claims for refund of theHMT. This effectively required the U.S. Customs Service to refund all HMT paid onexports back to April 1, 1987, the original effective date of the HMT [48]. Exporters,whether they were involved in the U.S. Shoe litigation or not, immediately began to fileclaims for refund of the HMT paid on exports.The second post-U.S. Shoe suit involved interest on refunds of HMT. Here the exportersdid not fare as well. The Court of Appeals for the Federal Circuit ruled that the U.S.government was not required to pay interest along with refunds of the unconstitutionallycollected HMT [49]. The court’s decision was based on the principal that, “interest mayonly be recovered in a suit against the government if there has been a clear and expresswaiver of sovereign immunity by contract or statute, or if interest is part of compensationrequired by the Constitution” [50]. The court found that nothing in the HMT statute, theConstitution, or other equitable principals required payment of interest on HMT refunds.31
Problems with the Harbor Maintenance Tax TodayApplication to Imports but not Exports. As a result of the U.S. Supreme Court’sdecision in U.S. Shoe, described in the litigation section above, as it exists today, theHarbor Maintenance Tax applies to imported products and products transporteddomestically, but it does not apply to exported products. Undoubtedly, exported productsput as much burden on U.S. harbors and shipping channels as do imports, but they areexempt from this ad valorem tax. To resolve this imbalance, either of two steps could betaken. The U.S. Constitution could be amended to allow taxation of exports (a verydifficult and likely unsuccessful approach) or, the HMT could be replaced with anothersystem of taxation that passes constitutional muster.The HMT Discourages the Most Fuel Efficient Means of Transportation. Watertransportation is the most fuel efficient method of transportation currently available in theUnited States. Ships can transport a ton of cargo 514 miles using one gallon of dieselfuel, whereas trucks can transport that same ton of cargo only 59 miles on the samegallon of fuel. As an ad valorem tax, the HMT serves to encourage the use of trucktransport for higher value lower weight cargo, leaving waterborne transport as a viableoption only for lower-value high-weight cargo. In an era where the U.S. is increasinglydependent of foreign oil, we simply cannot afford to have a tax policy that discouragesfuel efficiency in transportation. A recent example of U.S. efforts to make tax policyconsistent with fuel efficiency can be found in the modification of §179. This provisionreduced the small business write-off for sport utility vehicles, (SUVs) from $100,000 to amaximum of $24,000) [51]. Eliminating the HMT would allow companies to usewaterborne transit for items which are currently transported using less fuel efficientmeans. This not only reduces America’s dependence on foreign oil, but could reducehighway traffic and reduce the number of accidents that occur on our highways [52].The HMT Violates GATT. After the decision in U.S. Shoe, the HMT applies to importsbut not to exports. On February 6, 1998 the European Communities brought a Requestfor Consultations (RC) against the United States in the World Trade Organization’sDispute Settlement Body. Canada, [53] Japan, [54] and Norway [55] also joined in theRC. The RC alleged that the HMT violated Articles I, II, II, VIII and X of GATT, aswell as the Understanding on the Interpretation of Article II: 1(B) of GATT [56]. TheEuropean Community’s RC was introduced a few weeks before the Supreme Court’sdecision in U.S. Shoe, but the U.S. Shoe decision at least arguably makes the EC’s claimagainst the HMT even stronger. By dropping the HMT on exports, but maintaining it onimports, the U.S. has unintentionally violated the national treatment obligation underGATT [57]. This in effect allows tax free port use to products originating in the U.S. butimposes a tax on imported products, a direct violation of the national treatment clause ofGATT Article III [58]. One important exception to this rule applies to user fees which areimposed for services actually rendered. However, as the Supreme Court noted in U.S.Shoe, the HMT is not a valid user fee because it has little or no direct relationship toservices provided to importers [59]. The WTO has not acted on the European32
Community’s RC. No panel has been established to act on the Request for Consultations[60]. Abolishing the HMT would clearly be viewed favorably by our European and othertrading partners.The HMT Unfairly Taxes High Value Cargo When Compared to Low Value Cargo.As noted in the preceding section, one effect of the HMT is to impose a large tax burdenon high value cargo. While the intent of the HMT is to provide a revenue source fordredging and harbor maintenance, its effect is to strongly discourage manufacturers ofhigh value non-bulk items from using waterborne transportation. While this wouldappear to suggest that a tonnage tax would be a fairer means of generating harbormaintenance revenue, fuel efficiency and other issues and opportunities indicate thatgenerating this revenue elsewhere actually represents better national tax policy.The HMT has Prevented Some Types of Waterborne Transport from Flourishing inthe <strong>Great</strong> <strong>Lakes</strong>. Both Roll-On/Roll-Off (RORO) and various truck ferry services havebeen very difficult to establish on the <strong>Great</strong> <strong>Lakes</strong> due in large part to the existence of theHMT. It effectively transfers goods and products that could be shipped on the <strong>Great</strong><strong>Lakes</strong> to both truck and rail-based transportation systems. The HMT creates adisincentive for maritime shipping of both ferry cargo and containerized cargo. As an advalorem tax, the HMT imposes a requirement that containerized cargo be valued for thepurpose of assessing HMT. The burden of the HMT is two-fold: First, the HMTrepresents an added cost of 0.125 percent for the product shipped. But also, compliancewith the HMT requires valuation of items within any container or vehicle transportedonboard a ship, requiring a substantial volume of paperwork [61]. There is currently oneoperating truck-only ferry on the <strong>Great</strong> <strong>Lakes</strong>, the Detroit/Windsor Truck Ferry, ferryservice exists to various islands such as the Erie Islands and the Apostle Islands, and aRO-Pax (Roll-On/Roll-Off with Passenger Service), the Michigan Car Ferry Service onLake Michigan [62]. The opportunities for additional truck ferry and RO/RO service onthe <strong>Great</strong> <strong>Lakes</strong> are substantially limited by the imposition of the HMT. Previousresearch has indicated that the HMT (applied to both imports and exports at the time) wasan important factor and perhaps even the primary factor in the termination of RO/ROservice between Duluth, Minnesota and Thunder Bay, Canada [63].As Currently Enacted the HMT is Difficult to Properly Enforce. The HMT currentlyapplies to imports and to domestic transportation. With respect to imports, it is collectedby the U.S. Customs Service when the goods arrive in a U.S. port and clear customs.Payment is voluntary with respect to domestic shipping. Since the Customs Servicedoesn’t monitor domestic shipping there is no clear enforcement tool for domesticallyshipped items. While potential compliance problems alone are usually not sufficient tomilitate elimination of a tax system, when the system is as flawed as the current HMT, itmay be better to eliminate the tax altogether than to try to create a new and expensivesystem to ensure taxpayer compliance.The HMT is a Barrier to International Trade. Our trading partners in Europeparticularly those who are members of the European Community have routinelyexpressed strong opposition to the HMT. Its imposition on imports (many of which come33
from Europe) but not on exports is perceived as a tariff on imported goods. While thiswas clearly not the intention of the Supreme Court’s U.S. Shoe decision [64], thedecision’s effect is unavoidable. Eliminating the HMT would eliminate this inadvertent“tariff”.The HMT Results in a Shift in Container-Borne Cargo to Canadian Ports. Portrelatedjobs currently employ about five million U.S. workers. These workers earnroughly $44 billion in annual personal income. With respect to containerized cargo, thePort of Seattle estimates that each container of goods that arrives in port adds about$1,000 to the local economy [65]. Containerized cargo (and bulk cargo as well) enteringthe U.S. through U.S. ports is subject to the HMT. If the cargo is containerized andenters a Canadian port where the container is moved to a truck or train, it avoids theHMT altogether. The HMT puts ports near the Canadian border at a competitivedisadvantage. This disadvantage results in job losses at U.S. ports, some of the highestpaid union jobs in the U.S. [66].The HMT Generates Substantially More Revenue than the U.S. Currently Needs forHarbor Maintenance. The HMT has been a very effective (perhaps too effective)vehicle for generating revenue for the Army Corps of Engineers dredging and harbormaintenance activities. There is currently a $3.1 billion surplus in the HarborMaintenance Trust Fund, an amount sufficient to support the Army Corps of Engineer’sdredging and harbor maintenance at the current rate for 3 ½ years. The HMT could beabolished currently, and a replacement revenue stream could be deferred or phased inover a period as long as three years without risking any of the Corps’ ability to completeimportant dredging and harbor repairs.Table 3.1: Harbor Maintenance Trust Fund Balances (figures rounded to nearest thousand)Beg.Balance Revenue Total Balance ExpendituresEndingBalanceNetChangeFY 97 $866,063 $789,166 $1,655,230 $549,502 $1,105,728 $239,665FY 98 $1,112,241 $687,870 $1,800,111 $511,093 $1,289,018 $176,777FY 99 $1,289,018 $6<strong>15</strong>,601* $1,904,619 $295,662 $1,608,957 $319,939FY 00 $1,608,957 $760,554 $2,369,511 $701,869 $1,667,642 $58,685FY 01 $1,667,642 $810,769 $2,478,411 $659,570 $1,818,841 $<strong>15</strong>1,199FY 02 $1,818,841 $710,789 $2,529,630 $656,214 $1,873,417 $54,576FY 03 $1,873,417 $804,518 $2,677,935 $585,855 $2,092,080 $218,663FY 04 $2,092,080 $922,383 $3,014,463 $648,200 $2,366,263 $274,183FY 05 $2,366,263 $1,122,630 $3,488,892 $705,956 $2,782,936 $416,674*See estimated collections for 1999 (Table 2.3)Data source: Bureau of the Public Debt, Office of Public Debt Accounting, Trust Fund Management BranchThe Income from the HMT is not Fairly Allocated to the Commercial Ports WhichGenerate HMT Revenues. As previously noted, the HMT was enacted to fund dredgingand maintenance of commercial ports. Unfortunately, the HMT is used for a variety ofwaterway projects that are completely unrelated to dredging and maintenance ofcommercial ports. Even if the HMT were lowered so that it produced only enough34
evenue to fund current and future harbor maintenance and dredging expenses, theallocation of funds is currently unfair.In some cases HMT revenues have been spent on maintenance of harbors which providelittle or no commercial trade, and hence contribute virtually nothing to the HMTF. Inother cases HMT revenues are collected at ports which do not require or fundmaintenance through HMTF expenditures. The <strong>Great</strong> <strong>Lakes</strong> Boating Federation, inmaking a case for federal support for recreational boating notes that recreational boatersbenefit from large breakwaters protecting cities like Cleveland and Chicago, built andmaintained by the Army Corps of Engineers.[http://www.greatlakesboatingfederation.org/action/infrastructure.html] On the otherhand, commercial interests, as represented by the AAPA note in testimony before aHouse subcommittee “Ports like Seattle and Tacoma, which need little or no maintenancedredging, have long suffered the inequity of competing for cargos that must paysignificant fees for essentially no service” [67].Calculation and direct comparison of collections and expenditures is currentlycompromised by lack of data; as noted in the arguments for reform of the HMT and forincreased intermodal support by the National Ports and Waterways <strong>Institute</strong> (NPWI) atthe University of New Orleans, since all domestic shipment databases are weight-basedalmost no information is available on the value of shipments. The NPWI study makesestimates from ACE lake-wise waterborne commerce data for average value per ton, andshows lake-wise commodity tonnage shipped. See appendix D for these data andestimates [68].The HMT does not Allocate its Tax Burden to Either 1) Ports which Require theLargest Dredging Expenditures, or 2) Vessels which Require the Deepest Drafts.While the U.S. Supreme Court made it clear that the HMT is to be classed as a tax [69],not a user fee, a tax that is enacted to recover the government’s cost for providing aspecific service should be fairly applied to the users of those services, to be perceived bythe public and the stakeholders as an equitable tax. Dredging expenses (but notnecessarily other port maintenance) are largely a function of draft depth of ships travelingthrough the <strong>Great</strong> <strong>Lakes</strong> and St. Lawrence Seaway and the amount of sediment depositedin various locations on the system from rivers and other runoff. The HMT does notattempt to account for these differences in its imposition of an ad valorem tax.The Income from the HMT is Used for Work at Some Ports but not Others. The Portof Seattle incurred $792,500 in HMT funded expenses for the years 1999-2004.International imports to Seattle incurred $27,966,250 in HMT for 2004 alone. Seattle is anaturally deep water port containing at least <strong>15</strong> berths that are at least 50 feet deep. ThePort of Seattle handled 20,564,860 metric tons of cargo in 2005 with this minimal amountof HMT [70]. By comparison, the Port of Wilmington, North Carolina incurred$95,0<strong>15</strong>,705 in HMT funded expenses during the same five year period whileinternational imports shipped through Wilmington incurred only $1,790,000 in HMT for2004. HMT collections were estimated using USACE value of cargo.35
HMT Revenue is a Small Portion of Total Transportation Tax Revenue and a SmallPortion of Transportation Spending. The HMT represents only three percent of theU.S. government’s revenue from transportation sources. While government spending onwater transport is 6% of the total transportation budget, this apparent “imbalance” is morethan justified by the importance of water transport as both a strategic military tool, andthe fuel efficiency of waterborne transport as identified previously. The significance ofthese funding levels is that while the HMT stands as a meaningful barrier to specifictypes of water transport, it actually provides a very small percentage of the federalgovernment’s transportation budget.Attempts to Fix the HMT’s FlawsThe argument in this report is far from the first indictment of the HMT. Carriers, portauthorities, shippers, manufacturers and legal scholars have provided almost constantopposition to the HMT [71]. For most of these stakeholders, the most significantopposition resulted in the U.S. Shoe litigation which ended in the elimination of the HMTon exports. Since the end of the U.S. Shoe litigation, several attempts have been made toreform the HMT.The 1992 Attempt to Reduce the HMT. In August of 1992, H.R. 5896 was introducedto reduce the HMT from 0.125 percent to 0.04 percent, its pre-increase level. The billalso attempted to broaden the types of expenses which could be funded by the HMT andto enhance enforcement by turning 10 percent of all HMT revenue over to the IRS tocover costs of IRS enforcement of the HMT. The bill was not reported out of the HouseWays and Means Committee’s Subcommittee on Water Resources, and enforcementremains an activity of the U.S. Customs Service [72].The Trust Fund Excess/HMT Rate Reduction Bill. A bill was introduced byCongressman McDermott (D-WA) to reduce the HMT rate to .0105 for 1996, 0.085 for1997, and 0.065 percent for 1998. It would then have reduced the post- 1998 HMT rateby 0.01 percent for each calendar year in which the HMTF remained funded in excess of$100,000,000. The bill was introduced on March 6, 1995 with an effective date ofJanuary 1, 1996. It did not pass a vote in the House Ways and Means Committee [73].The Harbor Services Fund. In April 1999, the Clinton Administration proposed a newHarbor Services Fund Tax (HSF) as part of the Harbor Services Fund Act of 1999, H.R.1947. The Harbor Services Fund Tax was proposed to replace the revenue lost as a resultof the Supreme Court’s U.S. Shoe decision. This additional tax would have producedroughly $850 million in additional annual revenue [74]. The HSF met with strongopposition from a wide variety of shipping industry stakeholders. In describing the HSF,Kurt Nagle, President of the American Association of Port Authorities (AAPA) stated,“the Federal Government continues to suggest that it completely abdicate its financialresponsibility for federal navigation channel maintenance” [75]. The Harbor ServicesFund proposal failed in 1999 and was reintroduced by the Bush Administration as part ofits fiscal year 2001 budget request, where it once again failed.36
The Support for Harbor Investment Program Act of 1999. On March 24, 1999Representatives Borski (D-PA) and Oberstar (D-MN) introduced a bill to repeal theHMT, use the funds in the HMTF to fund dredging activities, and once those funds wereexpended, to fund the Army Corps of Engineers’ dredging out of the general fund of theU.S. Treasury [76]. The bill was referred to the House Ways and Means Committee andthe Committee on Transportation and Infrastructure. The Committee on Transportationand Infrastructure referred it to its Subcommittee on Water Resources and Environmenton March 26, 1999. The bill was not reported out of the Subcommittee and died there[77].The Container Port Exemption Bill of 2002. A bill was introduced in the House, inJuly of 2002, to provide an exemption to the HMT for any port that is within 200 miles ofa container port in a foreign country and which does not use harbor maintenance fundsfrom the Treasury. The bill, offered by several members of Washington State’scongressional delegation, essentially would have provided an HMT exemption for thePort of Seattle/Tacoma Washington. The bill was not reported out of the House Waysand Means Committee [78].The $100,000,000 Import Value Port Limit Bill of 2003. A 2003 bill attempted tochange the definition of exempt port under IRC §4462(a)(2). This section provides thatthe HMT does not apply to ports which have not received federal funds for construction,maintenance or operation at any time after 1977. The bill, which was introduced in theSenate by Senator John Kerry (D-Mass.), attempted to remove this exemption for anyport which was used to transport more than $100,000,000 of commercial cargo in anyyear after 2001. The bill was not reported out of the Senate Finance Committee.The Ferry Borne Trailer Cargo Exemption Bill of 2004. In March of 2004 a bill wasintroduced in the House which would have provided an exemption from the HMT for“qualified container cargo.” Qualified container cargo included cargo, “in or on a trucktrailer or semi-trailer parked on a ferry operating between two ports for the sole purposeof transporting such trailers and trucks between such ports due to traffic congestion onthe nearest international bridge serving the area in which such ports are located” [79].This bill, introduced by Congressman Phil English (R-PA) was an attempt to exempt theDetroit-Windsor Truck ferry and other similar ferries from HMT. The bill was notreported out of the House Ways and Means Committee.[80]The Short Sea Shipping Tax Exemption Act of 2005. Congressman Dave Weldon,M.D. (R-FL) introduced a bill on July 18, 2005 which would provide an exemption fromthe HMT for domestic container-based cargo unloaded in U.S. ports transported betweenU.S. ports via coastal routes or river systems [81]. This would have effectivelyeliminated the HMT on products shipped in containers within the U.S. and left the HMTin place for imports and bulk cargo only. The bill has not been reported out of the HouseWays and Means Committee.The <strong>Great</strong> <strong>Lakes</strong> Short Sea Shipping Enhancement Act of 2006. On July 26, 2006 abill was introduced in the House to exempt from the HMT commercial non-bulk cargo37
loaded at a port in the <strong>Great</strong> <strong>Lakes</strong> or St. Lawrence Seaway System and unloaded at anyother port in the <strong>Great</strong> <strong>Lakes</strong> or St. Lawrence Seaway System [82]. The bill was referredto the House Ways and Means Committee, but has yet to be reported out of thatcommittee.Proposed Solutions to the HMT ProblemAfter at least nine failed reform attempts in a ten-year period, it’s time for a major changeto the HMT. We suggest three possible proposals for change: The first two reformproposals would provide a permanent solution to the HMT problem and retain the abilityto fund Army Corps of Engineers’ important dredging and harbor work. The thirdproposal, while not solving the HMT problem, at least provides a tax incentive forcompanies engaged in short sea shipping.Proposal 1: Abolish the HMT and Fund Harbor Maintenance Using GeneralGovernment Revenue. This proposal calls for a renewal of the Support for HarborInvestment Program Act of 1999. It provides a clear set of appropriations for the ArmyCorps of Engineers by requiring funding only in years after the funds in the HMTF arefully expended.Proposal 2: Abolish the HMT and Fund Harbor Maintenance Using an Increase inthe Diesel Fuel Excise Tax. This proposal requires abolishing the HMT and replacing itsrevenue stream with funds generated from an increase in the federal excise tax on dieselfuel sold for over-the-road use. This excise tax is currently $0.245 cents per gallon. Inorder to fund the Army Corps of Engineers’ dredging and maintenance activities, therequired increase in the excise tax would be $0.0112 cents per gallon [83]. While this taxincrease is borne by the over-the-road transportation industry as opposed to the marinetransport industry, it’s fair to propose this burden in order to increase over-all fuelefficiency, which favors water transport. As suggested, a tax structure of this type woulddivert traffic to water transportation and thereby reduce our nation’s dependence onforeign oil. This modal shift would potentially reduce congestion on America’s highwaysas well. (See for instance Fruin’s calculations and conclusions of cost increase incurredby a proposed shift from waterway to land transportation in the Mississippi Metro area,or the recent modal shift from water to truck for New York trash disposal New York istrying reverse) [84]. This approach has been used successfully in Europe, with thesupport of the trucking industry.Table 3.2: U.S. Fuel Consumption and Demand(millions of barrels per day)Demand 2005 2006 2007Motor Gasoline 9.13 9.19 9.28Jet Fuel 1.63 1.66 1.70Distillate Fuel Oil 4.11 4.20 4.31Residual Fuel Oil 0.91 0.76 0.81Other Oils 4.88 4.93 5.08Total Demand 20.66 20.74 21.18Source: Energy Information Administration\Short-Term Energy Outlook - July 2006, Table 5a38
Table 3.3: Percent Change in U.S. Fuel Consumption*Millions of barrels per dayDemand2005-2006change2006-2007change2005-2007changeMotor Gasoline 0.66% 0.98% 1.64%Jet Fuel 1.84% 2.41% 4.29%Distillate Fuel Oil 2.19% 2.62% 4.87%Residual Fuel Oil -16.48% 6.58% -10.99%Other Oils 1.02% 3.04% 4.10%Total Demand 0.39% 2.12% 2.52%*Diesel fuel is projected to have the greatest change from 2005-2007.Source: Energy Information Administration\Short-Term Energy Outlook - July 2006,Table 5a; Bureau of Business and Economic <strong>Research</strong>Table 3.4: 2005 U.S. Diesel Excise Tax and Daily, Yearly DemandFederal tax: 24.4 cents per gallonState tax: 21.6 cents per gallonDaily Demand= 4.11 Million Barrels (Barrel = 42 U.S. Gallons)= 172.62 Million GallonsYearly Demand= 63,006.3 million gallons2005 Excise Tax collection total = $630,063,000Sources: Diesel Demand from: Energy Information Administration\Short-Term EnergyOutlook - July 2006, Table 5a; Excise Tax Totals from: Energy InformationAdministration, Petroleum Marketing Monthly, February 2006, Explanatory Notes, TableEN139
Table 3.5: U.S. Tax Collections and Revenue, Diesel Excise Tax Compared to HMTScenario 1 Increase excisetax to coverexpendituresAmount neededto cover: $705,956,074*Scenario 2Increase excisetax to cover totalrevenueAmount neededto cover: $1,122,629,667*HMT CollectionsRise in Excise Tax (cents) 2005 2006** 2007**Scenario 1 1.12 $705,670,560 $721,123,200 $740,009,760Scenario 2 1.78 $1,121,512,140 $1,146,070,800 $1,176,086,940* Based on 2005 HMT Collections** Projection based on stable excise tax using the projected distillated demand providedby the Energy Information AdministrationSource: UMD Bureau of Business and Economic <strong>Research</strong>;Proposal 3: The Short Sea Shipping Tax Credit. While abolishing the HMT would beideal from a tax policy standpoint, should Congress choose to leave the HMT in place, atax credit should be created to provide a tax incentive for <strong>Great</strong> <strong>Lakes</strong> and other U.S.short sea shipping. This non-refundable credit, the “Short Sea Shipping Tax Credit,”would operate as follows:• The credit would be offered to companies engaged in transporting eitherproducts or people between any two U.S. ports, or originating in a port ineither Canada or Mexico, and ending in a U.S. port.• The credit would be incremental, meaning that companies would claim thecredit on their corporate tax return, but it would be based on the increase inproducts or people shipped in the current tax year over a base period of thepreceding three tax years.• The credit would be the greater of: 10 percent of the increase in value of itemsshipped for the tax year, or an amount based on the increase in tonnage ofitems shipped. This tonnage portion of the credit would provide differentcredit amounts per ton for grain, coal, sand, salt, iron ore, or other bulk cargo.• The credit would be nonrefundable, meaning that it would only offset positivecurrent tax liability of the carrier. If the carrier has a tax loss for the year, thecredit could be carried back two years and forward for five years.40
Harbor Maintenance Tax Time Line1987 TITLE XIV WATER RESOURCESDEVELOPMENT ACT OF 1986HMT and HMTF ad valorem tax established at 0.04%value of cargo.1990 SECTION 11214 OMNIBUSBUDGET RECONCILIATION ACTOF 19901996 WATER RESOSURCESDEVELOPMENT ACT OF 19961997 APPELLATE COURT RULESHMT ON EXPORTSUNCONSTITUTIONAL1998 SUPREME COURT FOUND HMTUNCONSTITUTIONALHMT rate increased to 0.125%Water Resources Development Act of 1996 allows theACE to recover the Federal shareAppellate court confirms the lower court decision that theHMT on exports is unconstitutional.U.S. Supreme Court has declares the harbormaintenance fee (HMF) an unconstitutional tax onexports by a vote of 9 - 0 .1998 HMF REFUND STATUS When exporters can expect their Harbor MaintenanceFee (HMF) refunds remains open.1998 HMF REPLACEMENTPROPOSEDClinton Administration rolls out proposal to replace theHarbor Maintenance Fee (HMF).1999 HMT UPDATE Although ruled unconstitutional on exports, challengesby IBM and etc.)2000 CHALLENGING CUSTOMS Supreme Court Hears Arguments in two import-exportcases.2000 COURT RULES ALL EXPORTHMT SUBJECT TO REFUNDCourt of Appeals for the Federal Circuit ruled that allharbor maintenance tax (HMT) payments made since1986 (when the law was enacted) are subject to refund.2000 HMT INTEREST OVERTURNED The Court of Appeals for the Federal Circuit finds theU.S. immune from interest payment.2000 RECOVER INTEREST APPEAL I.B.M. has filed an appeal to the U.S. Supreme Courtover the question of whether exporters are entitled torecover interest on HMT refunds. The Court of Appealsrules no.2000 HARBOR MAINTENANCE TAXUPDATESwisher International, Inc. v. United States confirms thatthere is no statute of limitations which applies to harbormaintenance tax refunds.2000 HMT REFUNDS Effective March 28, 2001, Customs issued interim rulesfor those seeking refunds of harbor maintenance taxes.2006 HMT INTEREST Re question of interest, importers counseled to filecomplaints at the CIT to claim two years of HMTpayments at time of filing.2006 NO INTEREST ON EXPORT HMT CIT held there was no statute which authorized thepayment of interest and no obligation on the part of thegovernment to pay it.2006 HMT RULED LEGAL ONIMPORTSCIT rejects attempts to extend the illegality of the HMT.Possible appeals pending.Figure 4: HMT Timeline. Source: See expanded detail of this chronology in Appendix C, courtesy ofRodriguez O'Donnell Ross & Fuerst.41
Chapter 4: Potential Economic Impacts of the <strong>Research</strong> ResultsThe three proposals presented in Chapter 3 (Abolish the HMT and Fund HarborMaintenance Using General Government Revenue; or Abolish the HMT and FundHarbor Maintenance Using an Increase in the Diesel Fuel Excise Tax; or institute a ShortSea Shipping Tax Credit) share the possible outcome of increased shipping activity onthe <strong>Great</strong> <strong>Lakes</strong>. A conference call among port and shipping stakeholders confirmed thelikelihood of some increase in shipping activity following the incentive provided byremoving the tax.The input-output modeling tool IMPLAN® can provide a general estimate of the possibleeconomic impact of increased shipping activity associated with the proposed hypotheticaltax relief [85]. For purposes of estimation, we use a hypothetical assumption of $1million in increased shipping output for the economy of the State of Minnesota, reportedin 2005 dollars. The following table shows estimated impacts for the economic measuresand effects that might be associated with a change in the HMT.IMPLAN modeling here includes the impact 2002 NAICS Definitions 483 WaterTransportation (or IMPLAN sector 393 Water Transportation). NAICS sector 483 WaterTransportation industries provide water transportation of passengers and cargo usingwater craft, such as ships, barges, and boats.The subsector is composed of two industry groups: (1) one for deep sea, coastal, and<strong>Great</strong> <strong>Lakes</strong>; and (2) one for inland water transportation. This split typically reflects thedifference in equipment used.Table 4: Estimated Economic Impact per $Million Increase in ShippingTable 4.1: Value Added ImpactIndustry Direct Indirect Induced TotalWater transportation $252,114 $95 $119 $252,328Scenic and sightseeing transportation and support $0 $53,190 $134 $53,324Insurance carriers $0 $27,050 $3,002 $30,052Owner-occupied dwellings $0 $0 $21,209 $21,209Wholesale trade $0 $12,562 $7,307 $19,869Total $252,114 $212,101 $117,303 $581,519Table 4.2: Employment ImpactIndustry Direct Indirect Induced TotalWater transportation 2.0 0.0 0.0 2.0Scenic and sightseeing transportation and support 0.0 0.6 0.0 0.6Food services and drinking places 0.0 0.2 0.3 0.5Insurance carriers 0.0 0.2 0.0 0.2Wholesale trade 0.0 0.1 0.1 0.2Other State and local government enterprises 0.0 0.2 0.0 0.2Accounting and bookkeeping services 0.0 0.2 0.0 0.2Travel arrangement and reservation services 0.0 0.2 0.0 0.2Architectural and engineering services 0.0 0.2 0.0 0.2Total Employment 2.0 3.3 2.4 7.742
Table 4.3: Output ImpactIndustry Direct Indirect Induced TotalWater transportation $1,000,000 $377 $471 $1,000,848Scenic and sightseeing transportation and support $0 $62,791 $<strong>15</strong>8 $62,949Insurance carriers $0 $53,587 $5,946 $59,533Other State and local government enterprises $0 $35,983 $3,572 $39,554Petroleum refineries $0 $27,294 $4,274 $31,568Total $1,000,000 $404,378 $194,930 $1,599,308Table 4.4: Total ImpactDirect Indirect Induced TotalTotal Value Added Impact $252,114 $212,101 $117,303 $581,519Employment Impact 2.0 3.3 2.4 7.7Output Impact $1,000,000 $404,378 $194,930 $1,599,308Source: IMPLAN. UMD BBER. Estimates are reported in 2003 dollars, the most recent year of IMPLANdata available.Scenic and sightseeing water transportation services are not included in 483 WaterTransportation but are included in Subsector 487, Scenic and sightseeing transportation.Although these activities use water craft, they are different from the activities included inwater transportation. Water sightseeing does not usually involve place-to-placetransportation; the passenger's trip starts and ends at the same location. The IMPLANmodel shows the impact on both Water transportation and Scenic and sightseeingtransportation and support as quantified in the tables above.The three measures modeled here include Gross Output (the value of local production ormaritime activity in Minnesota); Value Added (the maritime industries’ contribution tothe State of MN, in wages, rents, interest and profits); and Employment (in terms of jobs,which include part time or short term jobs).Value Added, Employment and Output measures are modeled here with three effects,sometimes referred to as “rounds of spending”: the direct effect (the initial newspending), the indirect effect (additional inter-industry spending), and an induced effect(additional household expenditure from the direct and indirect impact).For every million dollars in increased maritime shipping activity, the economy ofMinnesota could see an additional total Value Added impact of $581,519, an additional$500,000 in Output, and almost eight new jobs added to the economy.43
Chapter 5. ConclusionAnalysis of the federal assessment structure for current <strong>Great</strong> <strong>Lakes</strong> maritime commerceshows an array of 119 various fees, duties, taxes and other assessments. Among these theHarbor Maintenance Tax deserves special and immediate attention for reform as a failedtaxation system that arose out of the “user fee fever” of the 1980s.A substantial portion of the HMT’s tax base was found to be unconstitutional by the U.S.Supreme Court, leaving an unbalanced, unfair and excessive tax in effect. The HarborMaintenance Trust Fund continues to grow well beyond the amounts needed for harbormaintenance. At least nine attempts have been made to reform this failed system in thepast ten years, none of which were successful. It’s time for Congress to abolish thisfailed method of taxation and replace the revenue stream with funds from either theTreasury’s general fund or funds generated by an increase in the diesel fuel excise tax.44
ReferencesChapter 1[1] Stewart, Richard D. Twin Ports Intermodal Terminal Freight Study. University of Wisonsin-Superior. Madison: Midwest Regional University Transportation Center, 2003. 20 Sept. 2006.[2] Fruin, Jerry, and Fortowsky, K. Modal Shifts From the Mississippi River and Duluth/Superior toLand Transportation. University of Minnesota: Center for Transportation Studies. Minneapolis: MinnesotaDepartment of Transportation, 2004. 20 Sept. 2006.[3] The National Dredging Needs Study of Ports and Harbors Planning and Management Consultants,Ltd Illinois. The National Dredging Needs Study of Ports and Harbors. 12 June 2006.[4] Center for Naval Analysis. Carus, W. Seth, and Thomas J. Hirschfeld. Coast Guard FutureDirection Study: Capstone Support Analysis. Center for Naval Analysis. 1997. 11 Sept. 2006. [5] <strong>Great</strong> <strong>Lakes</strong> United. "<strong>Great</strong> <strong>Lakes</strong> Navigation and Sustainable Development." <strong>Great</strong> <strong>Lakes</strong> United.26 June 2003. Army Corps of Engineers. 11 Sept. 2006 .[6] The <strong>Great</strong> <strong>Lakes</strong> Commission's Strategic Plan. A Strategic Plan for the <strong>Great</strong> <strong>Lakes</strong> Commission."<strong>Great</strong> <strong>Lakes</strong> Commission. 2005. 11 Sept. 2006 .[7] Kennedy, Mark. Congressman Kennedy: No Tolls on St. Lawrenece Seaway. 2005. 13 Sept. 2006.[8] United States. <strong>Maritime</strong> Administration. Dept of Transportation. Industry Survey Series: <strong>Great</strong><strong>Lakes</strong> Operators 2005. Nov. 2005. 18 May 2006 .[9] United States General Accounting Office. <strong>Maritime</strong> Industry: Federal Assessments Levied onCommercial Vessels (GAO/RCED-93-65FS, Mar. 5, 1993, and especially the supplement to this report,Commercial <strong>Maritime</strong> Industry: Supplemental Information on Federal Assessments (GAO/RCED-99-260S).[10] United States General Accounting Office. Commercial <strong>Maritime</strong> Industry: Updated Informationon Federal Assessments, 09/16/1999, GAO/RCED-99-260).[11] United States General Accounting Office. Marine Transportation: Federal Financing and aFramework for Infrastructure Investments (GAO-02-1033 September 2002)[12] <strong>Great</strong> <strong>Lakes</strong> Waterborne Commerce. United States. <strong>Institute</strong> for Water Resources. Department ofthe Army Corps of Engineers. Waterborne Commerce of the US. 2004. 23 May 2006.[13] Stewart, Richard D. <strong>Great</strong> <strong>Lakes</strong> Marine Transportation System. <strong>Great</strong> <strong>Lakes</strong> <strong>Maritime</strong> <strong>Research</strong><strong>Institute</strong>. 10 Mar. 2006.[14] The Cleveland Trans-Erie Ferry Feasibility Study. TranSystems, 2004. 13 Sept. 2006.45
[<strong>15</strong>] St. Lawrence Seaway Management, Transport Canada and St. Lawrence Seaway Devel . US Deptof Transportation. St. Lawrence Seaway Traffic Report 2005 Navigation Season. 2005. 17 May 2006.[16] United States. <strong>Maritime</strong> Administration. Dept of Transportation. Environmental Advantages ofInland Barge Transportation. 1994.[17] United States. <strong>Maritime</strong> Administration. Dept of Transportation. Transportation ModeComparison Energy Environment Efficiency. 7 Jan. 2002. 6 June 2006.[18] United States. <strong>Institute</strong> for Water Resources. Army Corps of Engineers. Status of the HarborMaintenance Trust Fund Fiscal Years 2000, 2001, 2002. 12 June 2006.[19] United States. Bureau of Transportation Statistics. Dept of Transportation. GovernmentTransportation Financial Statistics 2003. 2004. 9 June 2006.[20] United States. Congressional Budget Office. Impose a New Harbor-Maintenance Fee. 12 June2006 .[21] The U.S Harbor Maintenance Tax Controversy: Is there a solution? Kumar, Shashi N. " The U.SHarbor Maintenance Tax Controversy: Is There a Solution?" International Journal of <strong>Maritime</strong> Economics4 (2002): 149-163. 12 June 2006.[22] National Ports & Waterways <strong>Institute</strong>. Short Sea Vessel Service and Harbor Maintenance Tax.Oct. 2005. Short Sea Shipping Cooperative Program, SCOOP; University of New Orleans. 9 June 2006.[23] Duluth Superior Dredging Report from United States. Detroit District. Army Corps of Engineers.Annual Report/Contract Dredging Report. 10 Feb. 2006. 26 July 2006.[24] The National Dredging Needs Study of Ports and Harbors Planning and ManagementConsultants, Ltd Illinois. The National Dredging Needs Study of Ports and Harbors. 12 June 2006.[25] The National Dredging Needs Study of Ports and Harbors Planning and ManagementConsultants, Ltd Illinois. The National Dredging Needs Study of Ports and Harbors. 12 June 2006.Chapter 3[26] Treasury Education Office. "History of the U.S. Tax System." United States Department of theTreasury. 2002. 13 Sept. 2006 .[27] American Association of Port Authorities (AAPA). "The History of the Harbor MaintenanceTax." AAPA. 2006. 13 Sept. 2006 .[28] United States V. United States Shoe Corporation. No. 97-372. Supreme Court of the UnitedStates. 31 Mar. 1998. 13 Sept. 2006 .[29] American Association of Port Authorities (AAPA). "The History of the Harbor MaintenanceTax." AAPA. 2006. 13 Sept. 2006 .[30] Kumar, Shashi. "User Charges for Port Cost Recovery: the US Harbour Maintenance TaxControversy." International Journal of <strong>Maritime</strong> Economics 4 (2002): 149-163. 13 Sept. 2006.46
[31] United States V. United States Shoe Corporation. No. 97-372. Supreme Court of the UnitedStates. 31 Mar. 1998. 13 Sept. 2006 .[32] United States V. United States Shoe Corporation. No. 97-372. Supreme Court of the UnitedStates. 31 Mar. 1998. 13 Sept. 2006 .[33] United States V. United States Shoe Corporation. No. 97-372. Supreme Court of the UnitedStates. 31 Mar. 1998. 13 Sept. 2006 .[34] American Association of Port Authorities (AAPA). "The History of the Harbor MaintenanceTax." AAPA. 2006. 13 Sept. 2006 .[35] United States V. United States Shoe Corporation. No. 97-372. Supreme Court of the UnitedStates. 31 Mar. 1998. 13 Sept. 2006 .[36] Kumar, Shashi. "User Charges for Port Cost Recovery: the US Harbour Maintenance TaxControversy." International Journal of <strong>Maritime</strong> Economics 4 (2002): 149-163. 13 Sept. 2006.[37] Kumar, Shashi. "User Charges for Port Cost Recovery: the US Harbour Maintenance TaxControversy." International Journal of <strong>Maritime</strong> Economics 4 (2002): 149-163. 13 Sept. 2006.[38] United States V. United States Shoe Corporation. No. 97-372. Supreme Court of the UnitedStates. 31 Mar. 1998. 13 Sept. 2006 .[39] United States V. United States Shoe Corporation. No. 97-372. Supreme Court of the UnitedStates. 31 Mar. 1998. 13 Sept. 2006 .[40] United States V. United States Shoe Corporation. No. 97-372. Supreme Court of the UnitedStates. 31 Mar. 1998. 13 Sept. 2006 .[41] United States V. United States Shoe Corporation. No. 97-372. Supreme Court of the UnitedStates. 31 Mar. 1998. 13 Sept. 2006 ..[42] United States V. United States Shoe Corporation. No. 97-372. Supreme Court of the UnitedStates. 31 Mar. 1998. 13 Sept. 2006 .[43] Evansville Airport v. Delta Airlines. No. 405 U.S. 707. United States Supreme Court. 19 Apr.1972. 13 Sept. 2006 .[44] United States V. United States Shoe Corporation. No. 97-372. Supreme Court of the UnitedStates. 31 Mar. 1998. 13 Sept. 2006 .[45] Pace v. Burgess. No. 92 U.S. 372. United States Supreme Court. Oct. 1875. 13 Sept. 2006.[46] United States V. United States Shoe Corporation. No. 97-372. Supreme Court of the UnitedStates. 31 Mar. 1998. 13 Sept. 2006 .[47] United States V. United States Shoe Corporation. No. 97-372. Supreme Court of the UnitedStates. 31 Mar. 1998. 13 Sept. 2006 .47
[48] Swisher International v. United States. No. 99-1277. United States Court of Appeals for theFederal Circuit. 28 Feb. 2000. 13 Sept. 2006.[49] United States V. United States Shoe Corporation. No. 97-372. Supreme Court of the UnitedStates. 31 Mar. 1998. 13 Sept. 2006 .[50] Library of Congress v. Shaw. No. 85-54. United States Supreme Court. 01 July 1986. 13 Sept.2006.[51] Online Taxes (olt). "I.R.C. 179 Expense." OLT. 2006. 13 Sept. 2006 .[52] Stewart, Richard D., <strong>Great</strong> <strong>Lakes</strong> Marine Transportation System White Paper Prepared for theMidwest Freight Corridor Study[53] Request for Consultations: Communication from Canada: United States – Harbor MaintenanceTax, March 3, 1998.[54] Request for Consultations: Communication from Japan: United States – Harbor MaintenanceTax, March 3, 1998.[55] Request for Consultations: Communication from Norway: United States – Harbor MaintenanceTax, March 5, 1998.[56] World Trade Organization. "Dispute Settlement: United States-Harbor Maintenance Tax."WTO. 06 Feb. 1998. 20 Sept. 2006 .[57] Request for Consultations by the European Communities: United States – Harbor MaintenanceTax, Feb 16, 1998.[58] Lundell, S., Princess Cruises, Inc. v. United States: Will the Love Boat Finally Sink the HarborMaintenance Tax, 8 Minn. J. Global Trade 325 Summer, 1999.[59] United States V. United States Shoe Corporation. No. 97-372. Supreme Court of the UnitedStates. 31 Mar. 1998. 13 Sept. 2006 .[60] World Trade Organization. "Dispute Settlement: United States-Harbor Maintenance Tax."WTO. 06 Feb. 1998. 20 Sept. 2006 .[61] Stewart, Richard D., <strong>Great</strong> <strong>Lakes</strong> Marine Transportation System White Paper Prepared for theMidwest Freight Corridor Study[62] Price, William, and Vickerman, J. <strong>Great</strong> <strong>Lakes</strong> Cargo and Passenger Ferry Systems, AmericanSociety of Civil Engineers, June 3, 2004[63] Stewart, Lavoie, Shutes, Parameters for a Roll-On Roll-Off Marine Intermodal Service on LakeSuperior, 2003[64] United States V. United States Shoe Corporation. No. 97-372. Supreme Court of the United States.31 Mar. 1998. 13 Sept. 2006 .[65] American Association of Port Authorities (AAPA). "America's Ports Today." AAPA. Feb. 2006.13 Sept. 2006 .48
[66] American Association of Port Authorities (AAPA). "Repeal the Harbor Maintenance Tax Now!"AAPA. 2006. 13 Sept. 2006.[67] Nagle, Kurt J. Address. United States Capital Building, Washington, DC. 26 May 1999. 20 Sept.2006 .[68] Short-Sea Vessel Service and Harbor Maintaince Tax. University of New Orleans. New Orleans:National Ports and Waterway <strong>Institute</strong>, 2005. 20 Sept. 2006.[69] United States V. United States Shoe Corporation. No. 97-372. Supreme Court of the UnitedStates. 31 Mar. 1998. 13 Sept. 2006 .[70] Port of Seattle. "Container Terminals." Port of Seattle Seaport Cargo. 2006. 13 Sept. 2006.[71] Messer, David M., The Harbor Maintenance Tax: All Dredged Up and No Place to Go, 6 Tulsa J.Comp. & Int'l L. 99, Fall 1998.[72] Representative Studds, and Representative Moakley . United States. Cong. House. Reduce theHarbor Maintenance Tax, Amend Its Applicability and Enhance Its Enforcement. 102nd Cong., 2nd sess.HR 5896. 12 Aug. 1992. 11 Sept. 2006 [73] Representative McDermott. United States. Cong. House. Amend the Internal Revenue Code of1986 to Reduce the Harbor Maintenance Tax If the Harbor Maintenance Trust Fund is Overfunded. 104thCong., 1st sess. HR 1138. 06 Mar. 1995. 11 Sept. 2006 [74] American Association of Port Authorities (AAPA) . "Organizations Opposed to Harbor ServicesFund Proposal." AAPA. 07 Feb. 2000. 13 Sept. 2006 .[75] American Association of Port Authorities (AAPA) . "Organizations Opposed to Harbor ServicesFund Proposal." AAPA. 07 Feb. 2000. 13 Sept. 2006 .[76] Representative Borski, and Representative Oberstar . United States. Cong. House. Support forHarbor Investment Program Act. 106th Cong., 1st sess. HR 1260. 24 Mar. 1999. 11 Sept. 2006.[77] Representative Borski, and Representative Oberstar . United States. Cong. House. Support forHarbor Investment Program Act. 106th Cong., 1st sess. HR 1260. 24 Mar. 1999. 11 Sept. 2006.[78] Representative Dunn. United States. Cong. House. United States Port Opportunity andRevitalizing Trade Act of 2002. 107th Cong., 2nd sess. HR 5199. 24 July 2004. 11 Sept. 2006.[79] Representative English. United States. Amend the Internal Revenue Code of 1986 to ExemptFrom the Harbor Maintenance Tax Certain Truck Cargo on a Ferry Operating Between Two Ports for theSole Purpose of Bypassing Traffic Congestion on the Nearest International Bridge Serving the Area inWhich. 108th Cong., 2nd sess. HR 3882. 03 Mar. 2004. 11 Sept. 2006 .49
[80] Representative English. United States. Amend the Internal Revenue Code of 1986 to ExemptFrom the Harbor Maintenance Tax Certain Truck Cargo on a Ferry Operating Between Two Ports for theSole Purpose of Bypassing Traffic Congestion on the Nearest International Bridge Serving the Area inWhich. 108th Cong., 2nd sess. HR 3882. 03 Mar. 2004. 11 Sept. 2006 .[81] Representative Weldon. United States. Cong. House. Short Sea Shipping Tax Exemption Act of2005. 109th Cong., 1st sess. HR 3319. 18 May 2005. 11 Sept. 2006 .[82] Representative Jones. United States. Cong. House. <strong>Great</strong> <strong>Lakes</strong> Short Sea ShippingEnhancement Act of 2006. 109th Cong., 2nd sess. HR 5589. 26 July 2006. 11 Sept. 2006.[83] 2005 diesel excise tax taken from National Energy Information Center, Energy InformationAdministration, Petroleum Marketing Monthly, February 2006, Explanatory Notes, Table EN1.[84] Eric Lipton (2003). City Seeks Ideas as Trash Costs Dwarf Estimate. New York Times; 2 Dec.Chapter 4[85] IMPLAN Data and software: Minnesota IMPLAN Group, Inc., IMPLAN System (data andsoftware), 1725 Tower Drive West, Suite 140, Stillwater, MN 55082 www.implan.com.Bibliography20060728 Duluth News Tribune, "Port Authority Pushes for Tax Change," Passi, Peter. Duluth NewsTribune 28 July 2006. 14 Sept. 2006 .Retail On-Highway Diesel Prices (for last 53 weeks) United States. Energy Information Administration.Retail on-Highway Diesel Prices. 14 Sept. 2006.State Motor-Fuel Tax Rates , United States. Federal Highway Administration. Department ofTransportaion. State Motor Fuel Taxes. 14 Sept. 2006.United States Department of Treasury, Bureau of the Public Debt, Office of Public Debt Accounting, TrustFund Management Branch. Details about principal holdings and investment transaction data can be viewedat http://www.federalinvestments.gov/dfi/ dfifederalinvestreports.htm. See also:ftp://ftp.publicdebt.treas.gov/.50
Appendix A: Tax Inventory DataSource: United States General Accounting Office. <strong>Maritime</strong> Industry: Federal Assessments Levied on Commercial Vessels(GAO/RCED-93-65FS, Mar. 5, 1993; and United States General Accounting Office. Commercial <strong>Maritime</strong> Industry: UpdatedInformation on Federal Assessments, 09/16/1999, GAO/RCED-99-260)Note: Other variables in this inventory, as used elsewhere in this report, include data for GAO source page;Name of Assessment; Update; Description of Assessment; Type of Service; Collected by; Fund that receives collections; Usedby; Commerce Type; Payor; Vessel Type; Flag Type; Specific to <strong>Maritime</strong> Industry?; Formula and Frequency of Assessment;Collection Limitations; Laws and Regulations; Collections for 1989, 1990, 1991, 1996, 1997, 1998, and 1999 (est.) ; andDescription of Exemption. See the <strong>Great</strong> <strong>Lakes</strong> <strong>Maritime</strong> <strong>Research</strong> <strong>Institute</strong> for a digital copy of these data.Overview of <strong>Maritime</strong> Tax Inventory by Federal Assessment Name, Collector, and PayorName of Assessment: Collected by: Payor:Abstract of Title DOT: Coast Guard RequestorAgricultural Quarantine and Inspection User Fee (for commercialvessels over 100 net tons) Customs Service Owner (a)Export Health Certificate Endorsement Fees for Animals USDA: APHIS Exporter or brokerPhytosanitary Certificate Fee for Plants and Plant Products USDA: APHIS ExporterCollection of Fees for Sanitation Inspection of Cruise Ships HHS: USPHS (CDC) Owner or operatorApproval of Exchange of Certificate of Documentation RequiringMortgage Consent DOT: Coast Guard OwnerCertificate of Compliance DOT: Coast Guard OwnerCertificate of Ownership DOT: Coast Guard RequesterDirect User Fees for Inspection and Examination of U.S. or ForeignCommercial Vessels DOT: Coast Guard OwnerEvidence of Deletion from Documentation DOT: Coast Guard RequesterEvidence of Financial Responsibility for Water Pollution Certificate Fee DOT: Coast Guard Owner or operatorExchange of Certificate of Documentation DOT: Coast Guard OwnerFiling and Recording: Bills of sales and Instruments in Nature of Billsof Sale DOT: Coast Guard OwnerA-1
Overview of <strong>Maritime</strong> Tax Inventory by Federal Assessment Name, Collector, and PayorName of Assessment: Collected by: Payor:Filing and Recording: Mortgages and Related Information DOT: Coast Guard Owner or mortgageeFiling and Recording: Notice of Claim of Lien and Related Instruments DOT: Coast Guard Lien claimantInitial Certificate of Documentation DOT: Coast Guard OwnerLate Renewal Fee DOT: Coast Guard OwnerMiscellaneous Applications: Rebuild Determination--Preliminary orFinal DOT: Coast Guard OwnerMiscellaneous: Copy of Each Instrument or Document DOT: Coast Guard RequesterNew Vessel Determination DOT: Coast Guard OwnerReimbursement of Travel and Subsistence Costs for Overseas VesselInspections DOT: Coast Guard Owner or operatorReplacement of Lost or Mutilated Certificate of Documentation DOT: Coast Guard OwnerReturn of Vessel to Documentation DOT: Coast Guard OwnerTrade Endorsement: Coastwise Bowaters Endorsement DOT: Coast Guard OwnerTrade Endorsement: Coastwise Endorsement DOT: Coast Guard OwnerTrade Endorsement: Fishery Endorsement DOT: Coast Guard OwnerWaiver: Bill of Sale Eligile for Filing and Recording DOT: Coast Guard OwnerWaiver: Original Build Evidence DOT: Coast Guard OwnerWrecked Vessel Determination DOT: Coast Guard OwnerAir/Sea Passenger fee Customs Service Individual passengerBarge /Bulk Carrier Fee Customs Service Owner (d)Certification Fee for Payment of Vessel Tonnage Tax and CertifyAdmeasurment by Foreign Vessels Customs Service OperatorClearance of Vessel to Foreign Port Fee Customs Service OperatorCommercial Vessel Fee Customs Service Owner (d)Customs Duties Customs Service ImporterEntry of Vessel from Foreign Port Fee Customs Service OperatorHarbor Maintenance FeeCustoms ServiceImporter, foreigntrade zone user,A-2
Overview of <strong>Maritime</strong> Tax Inventory by Federal Assessment Name, Collector, and PayorName of Assessment: Collected by: Payor:domestic shipper, oroperator ofcommercialpassenger vesselIssuance Fee for a Permit to Proceed (p) Customs Service OperatorMerchandise Processing Fee Customs Service ImporterReceiving Manifest and Granting Permit to Unlade (s) Customs Service OperatorReceiving Post Entry Customs Service OperatorVessel Tonnage Tax Customs Service Operator<strong>Great</strong> <strong>Lakes</strong> Radio Agreement Inspection FeeFCC-LicensedTechnicians Owner or operatorInternational Telecommunications SettlementsFCCU.S.shipowners/telecommunicationoff foreigncoastsOceangoing Vessel Radio Inspection FeeFCC-LicensedTechnicians Owner or operatorRadio Communications Equipment Carriage Exemption Processing Fee FCC Owner or operatorSafety Convention Radio Inspection FeeFCC-LicensedTechnicians Owner or operatorShip Radio Station License Application Fee FCC Owner or operatorShip Radio Station License Regulatory Fee FCC Owner or operatorSmall Passenger Vessel Radio Inspection FeeFCC-LicensedTechnicians Owner or operatorAgeement Filing Under Delegated Authority Application FeeFMCOwner, operator, ormarine terminaloperatorAgreement Amendment Filing Requiring Commission Action FMC Owner, operator, orA-3
Overview of <strong>Maritime</strong> Tax Inventory by Federal Assessment Name, Collector, and PayorName of Assessment: Collected by: Payor:marine terminaloperatorAgreement Filing for Terminal and Carrier Exempt AgreementsApplication FeeOwner, operator, ormarine terminaloperatorFMCCOFR for Indemnification of Passengers for Nonperformance ofTransportation Application Fee FMC Owner or chartererCOFR to Meet Liability Incurred for Death or Injury to Passengers orOther Persons on Voyages Application Fee FMC Owner or chartererConciliation Service Application FeeDeclaratory Order Application FeeFMC: Special Docket Application FeeFMC: Special Permission Application FeeFormal Complaint Filing FeeInformal Procedures Application FeeNew Agreement Filings Requiring Commission ReviewFMCFMCFMCFMCFMCFMCFMCOwner, operator,shipper, or otherinterested partyOwner, operator,shipper, or otherinterested partyOwner, operator, orNVOCC (e)Owner, operator, orNVOCC (e)Owner, operator,shipper, or otherinterested partyOwner, operator,shipper, or otherinterested partyOwner, operator, ormarine terminaloperatorA-4
Overview of <strong>Maritime</strong> Tax Inventory by Federal Assessment Name, Collector, and PayorName of Assessment: Collected by: Payor:Permission to Correct Clerical Errors on Service Contracts ApplicationFMCOwner, operator,shipper, or otherinterested partyPetition for Investigation to Determine Existence of Adverse ConditionsAffecting U.S.-flag CarriersFMCOwner, Operator,NVOCC, importer,exporter, freightforwarder, shipper orother interested partyPetition for Relief for U.S.-flag Vessels Operating in Foreign-to-ForeignTrades FMC Owner or operatorPetition for Rulemaking FeeFMCOwner, operator,shipper, or otherinterested partyPetition for Section 19 ReliefOwner, operator,NVOCC, importer,exporter, or otherinterested partyFMCStowage Examination Fee USDA: GIPSA Importer or exporterInland Waterways Fuel Tax IRS OperatorLeaking Underground Storage Tank (LUST) Tax IRS OperatorShip Passengers International Departure Tax IRS OperatorAuthority to Transfer Ownership of Ships Built With ConstructionSubsidies Application Fee DOT: MARAD OwnerForeign Transfer of Ownership or Registry Application Fee DOT: MARAD OwnerForeign Transfer of Ownership Pursuant to MARAD Contracts DOT: MARAD OwnerGuarantee Fee for MARAD's Title XI Program DOT: MARAD OwnerInvestigation Fee DOT: MARAD OwnerSubstitution of Participants for Title XI Assistance Application Fee DOT: MARAD Owner or mortgageeA-5
Overview of <strong>Maritime</strong> Tax Inventory by Federal Assessment Name, Collector, and PayorName of Assessment: Collected by: Payor:Title XI Application Filing Fee DOT: MARAD OwnerTitle XII War Risk Interim Binder FeesAmerican War RiskAgencyOwnerAquaculture Permit NOAA: NMFS OwnerAtlantic Swordfish Permit Application Fee NOAA: NMFS OwnerBluefin Tuna Permit Application Fee NOAA: NMFS OwnerBottomfish /Seamount Groundfish Permit NOAA: NMFS OwnerCoastal Migratory Pelagic Fish Permit Application Fee NOAA: NMFS Owner or operatorCommercial Spiny Lobster Permit NOAA: NMFS OwnerFisheries Finance Program Application Fee NOAA: NMFS BorrowerFisheries Obligation Guarantee Program Guarantee Fee NOAA: NMFS OwnerForeign Fishing Observer FeeNOAA: NMFSOwner orrepresentative of theforeign fishing nationForeign Fishing Permit Application FeeNOAA: NMFSOwner orrepresentative of theforeign fishing nationForeign Fishing Poundage FeeOwner orrepresentative of theforeign fishing nationNOAA: NMFSGolden Crab Permit NOAA: NMFS OwnerGroundfish Endorsements Permit NOAA: NMFS OwnerHigh Seas Fishing Compliance Act Permit Application NOAA: NMFS OwnerMarine Mammal Authorization Program Registration Fee NOAA: NMFS Owner or operatorPelagics Permit NOAA: NMFS OwnerReef Fish Permit Application Fee NOAA: NMFS OwnerShark Permit NOAA: NMFS OwnerSnapper-Grouper Permit Application Fee NOAA: NMFS OwnerA-6
Overview of <strong>Maritime</strong> Tax Inventory by Federal Assessment Name, Collector, and PayorName of Assessment: Collected by: Payor:South Atlantic Rock Shrimp Permit NOAA: NMFS OwnerSpiny Lobster Permit Application Fee NOAA: NMFS Owner or operatorVessel Certificate of Inclusion Application Fee NOAA: NMFS Owner or operatorWreckfish Permit Application Fee NOAA: NMFS OwnerDocking /Undocking Tug Service Fee PCC Owner or operatorExtraordinary Transit Tug Service Fee PCC Owner or operatorGeneral Tug Service Fee PCC Owner or operatorHandling Lines for Docking After Transit Service Fee PCC Owner or operatorHandling Tug Line Service Fee PCC Owner or operatorHandling Vessel Lines Service Fee PCC Owner or operatorLaunch Service Fee-Dredging Division PCC Owner or operatorLaunch Service Fee-Marine Bureau PCC Owner or operatorOffshore Pilotage Fee PCC Owner or operatorPilotage Fee at the Gamboa Mooring PCC Owner or operatorPilotage Fee During Dock Trial PCC Owner or operatorPort Pilotage Fee PCC Owner or operatorSea Tug Service PCC Owner or operatorSpecial Admeasurement Service Fee PCC Owner or operatorStandard Tug Service PCC Owner or operatorTolls For Transit PCC Owner or operatorTransit Booking Fee PCC Owner or operatorA-7
Appendix B: Commercial <strong>Maritime</strong> Assessments Tax Code InventoryTax Code Inventory of Assessments as Legislated for U.S. Commercial <strong>Maritime</strong>Source: GAO31 U.S.C. § 9701; 46 C.F.R. § 67.509, 58 Fed. Reg. 60256, November <strong>15</strong>, 1993.31 U.S.C. § 9701; 46 C.F.R. § 67.533, 58 Fed. Reg. 60256, November <strong>15</strong>, 1993.31 U.S.C. 9701; 46 C.F.R § 68.05(requirement); 46 C.F.R. § 67.511(c) (fee).31 U.S.C. 9701; 46 C.F.R. § 67.101 (requirement); 46 C.F.R. § 67.550 (fee).31 U.S.C. 9701; 46 C.F.R. § 67.133 (requirement); 46 C.F.R. § 67.523 (fee).31 U.S.C. 9701; 46 C.F.R. § 67.141(requirement); 46 C.F.R. § 67.501(fee); 58 Fed. Reg. 60226, November<strong>15</strong>, 1993.31 U.S.C. 9701; 46 C.F.R. § 67.141(requirement); 46 C.F.R. § 67.507 (fee).31 U.S.C. 9701; 46 C.F.R. § 67.171 (requirement); 46 C.F.R. § 67.550 (fee); 58 Fed. Reg. 60266,November <strong>15</strong>, 1993.31 U.S.C. 9701; 46 C.F.R. § 67.175 (requirement); 46 C.F.R. § 67.521 (fee).31 U.S.C. 9701; 46 C.F.R. § 67.177 (requirement); 46 C.F.R. § 67.525 (fee)31 U.S.C. 9701; 46 C.F.R. § 67.220(requirement); 46 C.F.R. § 67.527 (fee).31 U.S.C. 9701; 46 C.F.R. § 67.303 (requirement); 46 C.F.R. § 67.537 (fee) (Note: Previously, a statuteauthorized this assessment; currently, a regulation authorizes this assessment.)31 U.S.C. 9701; 46 C.F.R. § 67.503; 58 Fed. Reg. 60266, November <strong>15</strong>, 1993.31 U.S.C. 9701; 46 C.F.R. § 67.50731 U.S.C. 9701; 46 C.F.R. § 67.517(fee); 58 Fed. Reg. 60226, November <strong>15</strong>, 1993.31 U.S.C. 9701; 46 C.F.R. § 67.527; 58 Fed. Reg. 60226, November <strong>15</strong>, 1993.31 U.S.C. 9701; 46 C.F.R. § 67.529; 58 Fed. Reg. 60226, November <strong>15</strong>, 1993.31 U.S.C. 9701; 46 C.F.R. § 67.531; 58 Fed. Reg. 60226, November <strong>15</strong>, 1993.31 U.S.C. 9701; 46 C.F.R. § 67.539; 59 Fed.reg. 49847, September 30. 1994.31 U.S.C. 9701; 46 C.F.R. § 68.05(requirement); 46 C.F.R. § 67.511(a) (fee).31 U.S.C. 9701; 46 C.F.R. § 68.05(requirement); 46 C.F.R. § 67.511(b) (fee).B-1
31 U.S.C. 9701; P.L. 100-710, 46 C.F.R. §. 67.301 (requirement); 46 C.F.R. §. 67.535 (fee).33 U.S.C. § 2716; 42 U.S.C. § 9608; 33 C.F.R. §138.130.46 C.F.R. § 2.10.46 C.F.R. § 502.51.46 C.F.R. §502.404(a).46 C.F.R. §502.68(a)(3).46 U.S.C. §121; 19 C.F.R. §4.20.46 U.S.C. §3317(b); 46 C.F.R. § 2.10.46 U.S.C. App. §1281; 46 C.F.R. § 308.10247 U.S.C. § <strong>15</strong>8(g); 47 C.F.R. §1.1103 and §1.111947 U.S.C. § <strong>15</strong>9; 47 C.F.R. § 1.<strong>15</strong>2.Communications Act of 1934 ch. 652, §351, as amended by the Omnibus Budget Reconciliation Act of1993, P.L.103-66, §6003; 47 U.S.C. §<strong>15</strong>8 (g); 47 C.F.R. §1.1104.Communications Act of 1934, as amended by the Omnibus Budget Reconciliation Act of 1989, P.L. 101-239, §3001 (a), 103 Stat. 2124; 47 U.S.C. §381, 382, and 385; 47 C.F.R. §1.1103; and §80.901.Communications Act of 1934, as amended by the Omnibus Budget Reconciliation Act of 1989, P.L. 101-239, §3001 (a); 47 U.S.C. §351 and 352; 47 C.F.R. §1.1103, Safety of Life At Sea Convention, ch.4, regulation 3, 16 U.S.T. 185, T.I.A.S. No. 9700.Communications Act of 1934, as amended by the Omnibus Budget Reconciliation Act of 1989, P.L.101-239, §3001 (a), 103 Stat. 2124; 47 U.S.C. §351, 352 and 381; 47 C.F.R. §1.1103, §80.801: and§80.851.Communications Act of 1934, as amended by the Omnibus Budget Reconciliation Act of 1989, P.L.101-239, §3001 (a), 103 Stat. 2124; 47 U.S.C. §351, 352 and 381; 47 C.F.R. §1.1103, §80.951.Communications Act of 1934, as amended by the Omnibus Budget Reconciliation Act of 1993, P. L. 103-66, §6003; 47 U.S.C. §<strong>15</strong>8; 47 C.F.R. §80.951 (e); Safety of Life at Sea Convention, ch. 4,regulation 5 (b), 16 U.S.T. 185, T.I.A.S. No. 9700.B-2
Consolidated Omnibus Budget Reconciliation Act of 1985, P. L. 99-272, §13031, 100 Stat. 308; 19 U.S.C.§58c(a)(1); 19 C.F.R. §24.22(b).Consolidated Omnibus Budget Reconciliation Act of 1985, P. L. 99-272, §13031, 100 Stat. 308; 19 U.S.C.§58c(a)(5); 19 C.F.R. §24.22(g).Customs Procedural Reform and Simplification Act of 1978, P. L. 95- 410, §214, 92 Stat. 904; 50 Fed.Reg. <strong>15</strong>271, April 17, 1985; 19 C.F.R. §4.98 (a).Food, Agriculture, Conservation, and Trade Act of 1990, P. L. 101-624,§2509, 104 Stat. 4071; 21 U.S.C.§136-136a; 9 C.F.R. §130 as revised in 57 Fed. Reg. 755, January 9, 1992.Food, Agriculture, Conservation, and Trade Act of 1990, P.L. 101-624,§ 2508-2509, 104 Stat. 4071 asamended by Omnibus Budget Reconciliation Act of 1990, P.L. 101-508, §1203(a); 21 U.S.C. §136-136a; 7 C.F.R. § 354.3(g) as revised in 57 Fed. Reg. 755, January 9, 1992.Food, Agriculture, Conservation, and Trade Act of 1990, P.L. 101-624,§2508-2509, 104 Stat. 4071 asamended by Omnibus Budget Reconciliation Act of 1990, P. L. 101-508, §1203(a); 21 U.S.C.§136-136a; 7 C.F.R. §354, as amended by §504 of the Federal Agriculture Improvement andReform Act of 1996, P. L. 104-127, 110 Stat.890.Internal Revenue Code of 1986, §4042; 26 U.S.C. §4042.Magnuson-Stevens Fishery Conservation and Management Act, P.L. 94-265, §104, 90 Stat. 342; 16 U.S.C.§1824(b) (1); 50 C.F.R. §600.518 (b) (1).Magnuson-Stevens Fishery Conservation and Management Act, P.L. 94-265, §204, 90 Stat. 342; 16 U.S.C.§1824(b) (1); 16 U.S.C. §1827(l); 50 C.F.R. §600.518 (d).Magnuson-Stevens Fishery Conservation and Management Act, P.L. 94-265, §204, 90 Stat. 351; 16 U.S.C.§1824(b) (1); 50 C.F.R. §600.518 (a).Magnuson-Stevens Fishery Conservation and Management Act, P.L. 94-265, 90 Stat. 351; 50 C.F.R.§622.4.Merchant Marine Act of 1920, §19, 46 U.S.C. App. § 876; 46 C.F.R. § 585.402.B-3
Merchant Marine Act of 1936 as amended, § 501, (46 App. U.S.C. 1<strong>15</strong>1); 46 C.F.R. § 251.31 (b).Merchant Marine Act of 1936, as amended, § 1104 A(e) (46 App. U.S.C. 1274 (e)); 46 C.F.R. §298.36.Merchant Marine Act of 1936, as amended, § 204 (b) and 1101 et seq.; 46 App. U.S.C. 1114 (b) and 1274(et seq.); 46 C.F.R. §298.16.Merchant Marine Act of 1936, as amended, § 204 (b); § 1103 as added June 23, 1938 and § 1104 (e) and(f), ch. 600, §46, 52 Stat. 969; 46 App. U.S.C. 1114 (b) §1273(a), 1274 (e) and (f); 46 C.F.R.§298.3 (c).Merchant Marine Act of 1936, as amended, §1104 A (f); 46 App. U.S.C. 1274(f); 46 C.F.R. §298.<strong>15</strong>.Merchant Marine Act of 1936, c.858, §1103 as added June 23, 1938, ch. 600, §46, 52 Stat. 969, asamended by American Fisheries Promotion Act, P L. 96-561, §220, 94 Stat. 3291; 46 U.S.C.§1271; 50 C.F.R. §253.16 (b) <strong>15</strong> C.F.R. 902, 61 Fed. Reg. 19171, May 1, 1996.Merchant Marine Act of 1936, c.858, §1103 as added June 23, 1938, ch. 600, §46, 52 Stat. 969, asamended by American Fisheries Promotion Act, P. L. 96-561, §220, 94 Stat. 3291; 46 U.S.C. App.§1271(a); 50 C.F.R. §253.16.Omnibus Budget Reconciliation Act of 1986, P.L. 99-509, §8101; 19 U.S.C. §58c(a) (9) (A); 19 C.F.R.§24.23; 56 Fed. Reg. <strong>15</strong>036, April <strong>15</strong>, 1991.Omnibus Budget Reconciliation Act of 1989, P.L. 101-239, §7504(a), 103 Stat. 2362; 26 U.S.C. §4471-4472; 26 C.F.R. §43.P. L. 89-777, §2 (a), 80 Stat. 1356, 46 U.S.C. §817d; 46 C.F.R. §540.20, 540.23.P. L. 89-777, §3 (a), 80 Stat. 1357, 46 U.S.C. §817e; 46 C.F.R. §540.1, 540.4.Public Health Service Act, c. 373, § 361-369, 58 Stat. 704, 42 U.S.C. § 264-272, 42 C.F.R. 71; P. L. 99-591, § 101(i), Department of Labor, HHS and Education and Related Agencies Appropriations Act1987, 52 Fed. Reg. 27060, July 17, 1987 and 54 Fed. Reg. 48942, November 28, 1989.Tariff Act of 1930, c 497, 46 Stat. 590; 19 U.S.C. §1202; Omnibus Trade and Competitiveness Act of1988, P. L. 100- 418, §1204, 102 Stat. 1148; 19 C.F.R. §148.33-39.B-4
Tax Reform Act of 1986, P. L. 99-514, §1893(a), 100 Stat. 2927; 19 U.S.C. §58c(a)(8).Foreign Shipping Practices Act of 1988, P.L. 100-418, Title X, 102 Stat. <strong>15</strong>70; 46 U.S.C. app. 1710a; 46C.F.R. § 588.4. On May 1, 1999, the authority for the Shipping Act of 1984, is amended by theOcean Shipping Reform Act of 1998, P.L. 105-258, 112 Stat. 1902 and is located at 46 C.F.R. §555.4(a).Shipping Act Amendments of 1979, P. L. 96-25, §5, 93 Stat. 72; 46 U.S.C. App. §821; Shipping Act of1984, P. L. 98-237, §11(a), 98 Stat. 80; 46 U.S.C. App. §1710(a); 46 C.F.R. §502.62 (f); 46 C.F.R.§502.301(a). Effective May 1, 1999, the statutory authority for this assessment, the Shipping Act of1984, was amended by the Ocean Shipping Reform Act of 1998, P. L. 105 - 258, 112 Stat. 1902.Shipping Act of 1916, as amended, § 2, § 3, § 9, § 37, and § 41; 46 App. U.S.C. §802, §803, §808 (c),§835 and the Merchant Marine Act, 1936, as amended, § 204 (b); 46 C.F.R. § 221.7 (b) and §221.<strong>15</strong>.Shipping Act of 1916, as amended, § 2, §3, §9, §37, and §41; 46 App. U.S.C. §802, §803, §808 (c), §835and the Merchant Marine Act, 1936, as amended, § 204 (b); 46 C.F.R. § 221.7 (b) and § 221.<strong>15</strong>.Shipping Act of 1984, P. L. 98-237, §11(a), 98 Stat. 8046 U.S.C. App § 1710 (a) ; 46 C.F.R. §502.182;§502.301(c); and §502.182; §502.304(b). Effective May 1, 1999, the statutory authroity for thisassessment, the Shipping Act of 1984, was amended by the Ocean Shipping Reform Act of 1998,P.L. 105-258, 112 Stat. 1902.Shipping Act of 1984, P. L. 98-237, §8 (d) and 9 (c), 98 Stat. 74; 46 U.S.C. App. §1707(d); 46 C.F.R.§514.21 (f). Effective May 1, 1999, part 514 of 46 C.F.R. is deleted, and this assessment waslocated at 46 C.F.R. § 520.14 ( c) (1).Shipping Act of 1984, P. L. 98-237, §8, 98 Stat. 74; 46 U.S.C. App. §1707; 46 C.F.R. §502.92 (a) (3) (ii).Effective May 1, 1999, the statutory authority for this assessment, the Shipping Act of 1984, wasamended by the Ocean Shipping Reform Act of 1998, P. L. 105 - 258, 112 Stat. 1902.Shipping Act of 1984, P. L. 98-237, § 8 (c ), 46 U.S.C. app. 1707 (c ), as amended by the Ocean ShippingB-5
Reform Act of 1998, P. L. 105-258, 112 Stat. 1902; 46 C.F.R. § 530.11 (c ) (1).Shipping Act of 1984, P. L. 98-237, § 8 (c ), 46 U.S.C. app. 1707 (c ), as amended by the Ocean ShippingReform Act of 1998, P. L. 105-258, 112 Stat. 1902; 46 C.F.R. § 530.11 (c ) (2).Shipping Act of 1984, P. L. 98-237, § 8 (c ), 46 U.S.C. app. 1707 (c ), as amended by the Ocean ShippingReform Act of 1998, P. L. 105-258, 112 Stat. 1902; 46 C.F.R. § 530.11 (c ) (3).Shipping Act of 1984, P. L. 98-237, § 8 (c ), 46 U.S.C. app. 1707 (c ), as amended by the Ocean ShippingReform Act of 1998, P. L. 105-258, 112 Stat. 1902; 46 C.F.R. § 530.11 (c ) (5).Shipping Act of 1984, P. L. 98-237, §4, 5 and 6; 46 U.S.C. app. 1703-1705; 46 C.F.R. § 572.401(f); 63Fed. Reg. 50534, September 22,1998. On May 1, 1999, the authortiy for this assessment, theamendments to the Shipping Act of 1984, was amended by the Ocean Shipping Reform Act of1998, P.L. 105-258, 112 Stat. 1902 and is located at 46 C.F.R. § 535.401 (f).Shipping Act of 1984, P. L. 98-237, §8, 46 U.S.C. app. 1707; 46 C.F.R. § 514.21(k) (2). On May 1, 1999,the authority for this assessment, the Shipping Act of 1984, was amended by the Ocean ShippingReform Act of 1998, P.L. 105-258, 112 Stat. 1902 and is located at 46 C.F.R. § 530.11 (c)(4).Shipping Act of 1984, P.L. 98-237, § 13(b)(5), 46 U.S.C. app. 1712; 46 C.F.R. § 587.3. On May 1, 1999,the authority for this assessment, the Shipping Act of 1984, was amended by the Ocean ShippingReform Act of 1998, P.L. 105-258, 112 Stat. 1902 and is located at 46 C.F.R. § 560.3 (a)(2).Shipping Act of 1984, P.L. 98-237, §4, 5 and 6; 46 U.S.C. app. 1703-1705; 46 C.F.R. § 572.401(f). OnMay 1, 1999, the authority for this assessment, the Shipping Act of 1984, was amended by theOcean Shipping Reform Act of 1998, P.L. 105-258, 112 Stat. 1902 and is located at 46 C.F.R. §535.401 (f).Shipping Act of 1984, P.L. 98-237, §4, 5 and 6; 46 U.S.C. app. 1703-1705; 46 C.F.R. § 572.401(f); 63 Fed.Reg. 50534, September 22,1998. On May 1, 1999, the authority for this assessment, theamendments to the Shipping Act of 1984, was amended by the Ocean Shipping Reform Act of1998, P.L. 105-258, 112 Stat. 1902 and is located at 46 C.F.R. § 535.401 (f).Shipping Act of 1984, P.L. 98-237, §4, 5, and 6; 46 U.S.C. app. 1703- 1705; 46 C.F.R. § 572.401 (f); 63Fed. Reg. 50534, September 22,1998. On May 1, 1999, the authority for this assessment, theamendments to the Shipping Act of 1984, was amended by the Ocean Shipping Reform Act of1998, P.L. 105-258, 112 Stat. 1902 and is located at 46 C.F.R. §535.401(f) .B-6
U.S. Grains Standards Act, c.313, Pt. B, §5, 39 Stat. 483; 7 U.S.C. §77; Agricultural Marketing Act, c.966,§203, 60 Stat. 1087; 7 U.S.C. §1622; 7 C.F.R. §800.71, §800.75 and §800.76.Water Resources Development Act of 1986, P.L. 99-662, §1402(a), 100 Stat. 4266; Omnibus BudgetReconciliation Act of 1990, P. L. 101-508, §11214(a), 104 Stat. 1388-436; 26 U.S.C. §4461-4462;19 C.F.R. §24.24B-7
Appendix C: Detailed HMT TimelineHARBOR MAINTENANCE TAXBy permission, Rodriguez O'Donnell Ross & FuerstSee also: http://rorfgw.com/TOPIC_ARCHIVE/Harbor_Maintenance_Fee/harbor_ maintenance_fee.htmlHMT Ruled Legal on Imports09/02In a closely watched case which attempted to extend the illegality of the HMT, the position of Thomson Multimedia was rejected bythe Court of International Trade. The bases for Thomson's claims were technical in nature relying on interpretations of severalprovisions in the U.S. Constitution. The court rejected all of Thompson' arguments. Could this be an indicator of the outcome if thecurrently mentioned security user fees are enacted and challenged?The HMT on exports was found unconstitutional as a tax of exports. That same principal does not apply to imports and so Thomson'sposition was soundly defeated. It remains to be seen whether the case will be appealed.No Interest on Export HMT06/02One of the few questions remaining regarding the harbor maintenance tax on exports was whether the government had to pay intereston the monies refunded to exporters. Under the doctrine of sovereign immunity, a government is immune from suit unless it agrees toallow itself to be sued. In the case of the HMT, there are statutory provisions which allow the collection of duties and user fees to bechallenged in court. The Court of International Trade in Swisher resoundingly answered the question about payment of interest bysaying - no! A variety of arguments were made, including Constitutional ones, all of which failed to persuade the court. In the end,Judge Restani held there was no statute which authorized the payment of interest in the circumstances presented and so there was noobligation on the part of the government to pay it.C-1
HMT UPDATE6/01Wondering what all the fuss is about the HMT and imports? Check our web site for a recent posting which provides the latestinformation regarding both imports and exports.HARBOR MAINTENANCE TAX UPDATE5/01There is much in the trade press these days regarding an issue many thought resolved - refunds of the harbor maintenance tax (HMT)on exports. We provide in this memorandum an update regarding the refunds for exports plus information in the newly developingarea of the potential for refunds on imports.Exports:Between the U.S. Shoe and Swisher cases, it is now clear that the HMT on exports was unconstitutional and could be challenged in anumber of ways which were successful. Swisher challenged the HMT relying on the standard method of challenge - protests. U.S.Shoe challenged the HMT relying on the inherent jurisdiction of the court. Both were successful and, in many instances, the refundshave already been issued.Subsequent cases addressed interest, saying none would be paid if refunds were obtained relying on U.S. Shoe. Whether interest willbe paid if protests were filed remains unclear.The latest development in the export context is a new Customs regulation which, in effect, cuts off all refund claims not already filed.In reliance on a comment by one of the judge’s, Customs changed its regulations to provide a one year statute of limitation for allexport refund claims. Since no one has paid HMT for several years, such action effectively cuts off all claims not already filed. Thenew regulation is not retroactive so any pending claims are unaffected.Customs is currently focused on the claims arising out of the Swisher decision and is obligated to process those refunds by June 18,2001. Customs has approximately 2,700 administrative refund claims on which it will start the refund processing thereafter. One openquestion is exactly how much supporting documentation exporters will be required to provide so that their claims are deemedC-2
complete and refunds are issued.Imports:One area where there has been recent movement has to do with the possibility of HMT refunds on imports. On April 18, 2001, theCourt of Appeals for the Federal Circuit (CAFC) overturned the decision of the Court of International Trade (CIT) dismissing thelawsuit brought by Thomson Consumer Electronics (Thomson). Thomson filed its claim relying on the inherent jurisdiction of thecourts (called <strong>15</strong>81(i) or residual jurisdiction). Thomson claimed the HMT violated the U.S. Constitution regarding the PortPreference and Uniformity clauses. Thomson also asserted that since the HMT on exports was invalid, the HMT on exports and theHMT on imports could not be severed and so if one was invalid, so was the other. Rather than deciding the case, the CIT dismissedsaying it lacked jurisdiction because the proper basis to challenge the HMT assessment on imports was said to be by way of a protest(<strong>15</strong>81(a) or the traditional method of challenging assessments on imports).The CAFC held that Customs had no authority to decide whether or not the HMT was constitutional and so the filing of a protestwould be a futile act. The court went on to state that Thomson is not required to undertake a futile act and so the CIT decision wasreversed. The CAFC also made a point of stating it has not made any determination as to whether or not the HMT on imports isunconstitutional (which many think unlikely) as the merits of that claim must first be decided by the lower court.While it may well be several years before the HMT litigation regarding imports is finalized, importers may wish to take advantage ofthe Thomson decision by filing complaints at the CIT to preserve the issue. They can claim two (2) years of HMT payments at time offiling. Importers might also keep in mind that a future court could determine that the filing of protests is required and so undertakingboth steps in tandem may be the safest way to proceed.HMT REFUNDS4/01Effective March 28, 2001, Customs issued interim rules for those seeking refunds of harbor maintenance taxes, see T.D. 0125.INTEREST ON HMT - IS IT DEAD?C-3
01/01With the holding in IBM v. US, the courts made clear that HMT refunds could be obtained but no interest would be paid. Then thecourt issued its decision in Swisher v U.S. relying on standard protest jurisdiction - <strong>15</strong>81(a). The IBM case relied on <strong>15</strong>81(i) orresidual jurisdiction. The granting of a protest allows the award of interest pre-judgment. 21 plaintiffs who received their refundsrelying on the IBM case, recently sought to amend those judgments to include an award relying on the Swisher case. The court deniedtheir motions saying the cases have to come to finality. If the plaintiffs wanted to keep open the option of recovering interest, theyshould not have signed the judgments and accepted the benefits. While Swisher allows for an award of interest back to date of filing,HMT payments date all the way back to 1987. Interest back to date of HMT payment is not likely to be allowed absent furtherlitigation.MORE HMT LITIGATION12/00I.B.M. has file an appeal to the U.S. Supreme Court over the question of whether exporters are entitled to recover interest on HMTrefunds. The Court of Appeals for the Federal Circuit said no.HARBOR MAINTENANCE TAX UPDATE12/00In Swisher International, Inc. v. United States, No. 99-1227 (February 28, 2000), the Court of Appeals for the Federal Circuitconfirmed that there is no statute of limitations which applies to harbor maintenance tax refunds. The case was appealed to the U.S.Supreme Court which refused to hear it.In an attempt to deal with the lack of a time limit, the Customs Service has now proposed a one year limitations period which wouldstart to run from the date of the quarterly payment to Customs. The proposed change has no effect on HMT payments made onimports. Exporters are, therefore, advised to file their refund claims as quickly as possible.HMT UPDATE03/00C-4
There was unexpected good news for exporters in late February when the Court of Appeals for the Federal Circuit ruled that all harbormaintenance tax (HMT) payments made since 1986 (when the law was enacted) are subject to refund, even those outside the two (2)year statute of limitations generally governing the jurisdiction of the Court of International Trade (C.I.T.). The court reached itsdecision because there is no time limit governing when an HMT refund request has to be filed. The case has been returned to theC.I.T. to calculate the amounts due the exporter. Once that judgment is entered, it is expected the case will again be appealed.If finally upheld on appeal, an administrative procedure is likely to be established (possibly through Customs) allowing claims foradditional HMT refunds. Whether it will literally extend to all HMT payments not previously refunded remains to be seen.Now we hear that the question of replacing the HMT monies with some other funding source is turning to earmarking certain moniescollected by Customs, a decidedly unpleasant turn of events given the inability to find the $1.4 billion needed to fund Customs' newcomputer system.HMT INTEREST OVERTURNED3/00The Court of Appeals for the Federal Circuit has overturned a CIT decision finding that exporters are entitled to be paid interest forany harbor maintenance taxes refunded, instead finding the U.S. was immune from interest payment because there was no lawauthorizing it.CHALLENGING CUSTOMS1/00By Su Ross, ©1999 Los Angeles Daily JournalSupreme Court Hears Arguments in Two Import-Export Cases The 1999 U.S. Supreme Court session was quite surprising forpractitioners in the import-export arena. At the beginning of the year, the first import-export case was argued before the SupremeCourt since the early 1970s. The case involved the harbor maintenance tax. See United States Shoe Corporation vs. United States, 523U.S. 360, 118 S.Ct. 1290 (1998).C-5
The HMT was assessed as a percentage of value on imports into, and exports out of, the United States and was intended to fundimprovements at America’s ports and waterways. See 26 U.S.C. § 4461. U.S. Shoe challenged the HMT assessment on exports only.Despite the Government’s argument that the HMT was a permissible user fee, relying on the export clause of the U.S. Constitution(U.S. Const., art. I, §9, cl. 5), the Supreme Court found the HMT to be a tax on exports and declared it unconstitutional.Still pending is the question of whether interest has to be paid on the HMT amounts being refunded. Interest was found to be due bythe Court of International Trade (a specialized lower court), but that decision has been appealed to the U.S. Court of Appeals for theFederal Circuit. See International Business Machines Corp. v. United States, Court No. 94-10-00625, 1998 Ct Intl Trade LEXIS 73(1998). The judgment in U.S. Shoe found interest was due, but that portion of the decision was stayed pending the outcome of theIBM case, an outcome that carries substantial consequence for the government in that as of early September 1999, some $732 millionpreviously paid in HMT fees had been refunded.Using different procedural devices, the HMT was challenged on imports in Thomson Consumer Electronics, Inc. v. United States,Court No. 95-32-00277, 1999 Ct. Intl. Trade, LEXIS 81, Slip Op. 99-84 (1999) and Amoco Oil Co. v. United States, Court No. 95-07-00971, 1999 Ct. Intl. Trade LEXIS 89, Slip Op. 99-91 (1999). In both cases, the basic argument was that the HMT on imports is notseverable and so, if invalid on exports, it is equally invalid on imports. Further, assessing the HMT solely on imports violates theUniformity and Port Preference Clauses of the Constitution (as some 20 States do not have ports). These arguments were rejected bythe Court of International Trade which found the HMT to be validly assessed on imports.Later in the same Supreme Court session, the second trade-related case was argued before the Supreme Court, United States vs.Haggar Apparel Company, 143 L.Ed. 2d 480, 119 S.Ct. 1392 (1999). The basic dispute was over whether the operations Haggarperformed on the jeans it processed in Mexico qualified as assembly or manufacturing. The difference was important in determiningthe value on which duty would be calculated. If the process was a manufacturing operation, duty would be assessed on the full valueof the finished jeans. However, if the operation was qualified as an assembly process, duty would be due only on the value added inMexico.The trial and appellate court both dealt with the issues and found in favor of Haggar. The result turned on how the courts interpretedthe “permapressing” performed in Mexico was interpreted.Permapressing became the focal point of the case because of the way in which the tariff provision relied upon by Haggar was worded.Harmonized Tariff Schedule provision 9802.00.80 and 19 U.S.C. § 1202 provide a duty exemption for:C-6
Articles... assembled abroad in whole or in part of fabricated components, the product of the Unites States, which ... (c) have not beenadvanced in value or improved in condition abroad except by being assembled and except by operations incidental to the assemblyprocess such as cleaning, lubricating and painting.Subheading 9802.00.80 HTSUS, 19 U.S.C. § 1202.The relevant regulation described processes that did not qualify for partial duty exemption under HTSUS 9802.00.80:Any significant process, operation, or treatment other than assembly...shall not be regarded as incidental to the assembly and shallpreclude the application of the exemption to such articles...Chemical treatment of components or assembled articles to impart newcharacteristics, such as showerproofing, permapressing, sanforizing, dying or bleaching of textiles.19 C.F.R. § 1016(c) (1998).The U.S. Customs Service contended that permapressing took the jeans out of the assembly provision because permapressing isspecifically named as a disqualifying operation and so that the resulting garments were manufactured in Mexico not assembled.Haggar argued the exact opposite and won before the Court of International Trade, Haggar Apparel Co. vs. United States, 938 F.Supp. 868 (1996), relying on arguments explaining that permapressing as done today is no longer the harsh chemical treatment it wasonce thought to be and so Customs’ regulatory determination was no longer accurate.The question of the deference to be given to Customs’ interpretation of HTSUS 9802 was raised again by Customs before theappellate court, which nonetheless affirmed the decision. United States v. Haggar, 127 F.3d 1460 (1997). Customs then appealed tothe Supreme Court, which granted Certiorari.What makes Haggar notable, beyond its being the second trade case in one term argued before the Supreme Court, was the deferencequestion. The question posed to the Supreme Court was whether Customs had undertaken sufficient rule-making in enacting therelevant regulations so that judicial deference should be given to its interpretation, an issue raised for the first time by this case. Thistype of deference is known as Chevron deference (Chevron U.S.A. Inc. vs. Natural Resources Defense Council, Inc., 467 U.S. 837(1984),C-7
Relying on the holding in Chevron, courts generally give the regulations promulgated by an agency judicial deference, provided thoseregulations are the result of proper rule-making and reasonable interpret and implement an otherwise ambiguous statutory provision.The Supreme Court in Haggar found that if Congress speaks directly regarding a question, the court must give deference to Congress’specific intent pursuant to Chevron. However, if an agency’s statutory interpretation fills a gap or defines a term, that interpretation isto be given judicial deference, provided the Administrative Procedures Act (5 U.S.C. Section 553) has been complied with.In the case of the regulations in question, Customs had indeed published them in proposed form, accepted comment, and then issuedfinal regulations. In those regulations, permapressing was specifically named as a chemical treatment, which qualified the resultinggarments as having been manufactured, rather than assembled. As a result, the Supreme Court remanded the case to the FederalCircuit for further consideration, as the appellate court had only dealt with the question of Chevron deference and rejected it. Onremand, the Federal Circuit was directed to consider whether the regulations themselves actually warrant deference.The question of Chevron deference was raised again by Customs in Mead Corp. vs. United States, 1999 U.S. App. LEXIS 17831 (Fed. Cir. July 28, 1999). Customs issued a ruling to Mead regarding the tariff provision and rate that would apply to its day-planners.Mead took issue with Customs’ decision. By complying with the requisite procedures, Mead was eventually able to bring the matterbefore the Court of International Trade, which granted Customs’ motion for summary judgment affirming the original classificationdecision.The Federal Circuit took note of the Haggar case and held that a ruling by the Customs Service is an interpretation of a tariffprovision. It does not involve input from any party except the importer to whom the ruling is issued. A ruling is issued only whenrequested by an interested party. It involves no public debate prior to issuance (although it is subject to public comment after the fact ifan appropriate petition to overturn the results is filed - a rare but not unheard of event). A ruling is confined to the specific factspresented. It does not clarify the law or the rights of an importer.Conversely a regulation undergoes notice and comment and provides a mechanism for input from the interested public. It may beamended or changed later in response to subsequent public input. Therefore, the appellate court found that rulings are not entitled toChevron deference. Customs has not yet decided whether it will appeal this decision to the Supreme Court.Many practitioners think the holding in Haggar will force them to carefully monitor each regulation as it is proposed by Customs toensure it is a reasonable interpretation of congressional intent so as to preserve the issue for trial. Many others think it does not meanC-8
that each and every regulation is subject to challenge because it wrongly interprets congressional intent. In the end, what both Haggarand Mead do is provide practitioners with yet one more tool to use in challenging Customs’ decisions.HMT UPDATE10/99Even after the finding that the harbor maintenance tax (HMT) an unconstitutional tax on exports, a number of outstanding issuesremained. IBM is prosecuting a case questioning the government's liability to pay interest and how it is to be calculated. StoneContainer deals with the question of the applicable statute of limitations. Is it two years under the law's general provisions or is theHMT void from inception?Thomson and Amoco challenged the HMT on imports. Thomson just argued the law's general two (2) year statutory provision. Amocomade the same argument but raised it via a protest. In both cases, the basic argument was the HMT on imports is not severable and so,if invalid on exports, is equally invalid on imports. Further, assessing the HMT solely on imports violates the Uniformity and PortPreference Clauses of the Constitution.The focus of the non-severability argument is that Congress would not have enacted the HMT on imports alone. An additionalargument is that assessing the HMT on only imports violates international treaty obligations. Also, the argument was made that not allports are water ports thereby excluding cargo loaded in 20 states. The tax is also not assessed on domestic movements. As a result,because it is not geographically uniform, the HMT violates the Uniformity and Port Preference Clauses.As of late August/early September 1999, Customs had refunded about $732 million to about 3,4000 exporters. Both the Thomson andAmoco claims were recently dismissed. Thomson's on the technical ground that no protest was first filed. In the Amoco case, the courtrejected all the arguments mentioned above. At the same time, the European Union is threatening a WTO complaint about thecontinuing imposition of the HMT strictly on imports.Additionally, the Court of International Trade has now decided the BMW case. BMW sought a finding the HMT was not applicable toshipments entered into a foreign trade zone (FTZ). The CIT found the HMT applied because there was no exception in the law. Thecourt also found the HMT is not a duty so the provisions of the FTZ law did not bar its application.C-9
HMF REPLACEMENT PROPOSED8/98The Clinton Administration finally rolled out its proposal to replace the Harbor Maintenance Fee (HMF). (Challenge of the fee againstimports is being considered at the WTO.) The HMF was previously assessed against importers and exporters based on the value oftheir goods. The fee against exporters was overturned by the courts. The Harbor Services User Fee will be assessed against carriers,who are expected to pass the cost on to their customers. It will be calculated based on a ship's net tonnage with an adjustment for cargospace not otherwise included. Bulk ships and tankers will be taxed per port of call, while container and cruise ships will be taxed pervoyage.As announced, it appears container ships will be taxed at twice the rate for tankers, five times the rate for dry bulk ships and seventimes the rate for cruise ships. Justification for the disparity is given as a response certain ships operating across the largest number ofports with time-sensitive movements. Assuming some form of this new tax is adopted, its validity remains in doubt because the largestamount of money would be raised from West Coast ports which have the least need for dredging. As a result, the new fee does notclosely match where the expenditures are being made. Will it withstand a court's scrutiny?HMF REFUND STATUS7/98The question of when exporters can expect their Harbor Maintenance Fee (HMF) refunds remains open. The government contends itshould not be required to calculate and pay any refunds until all the legal issues are decided. The government also arbitrarily selected ahandful of HMF claims in order to determine whether its own records could be used to confirm those claims. It was successful only50% of the time. Therefore, it is expected the government's proposed claim form will soon be approved for distribution to litigants.The major issues under review are interest and whether there is a time bar to claims' filing. The government contends interest is notdue but lost before the trial court. It also claims that a two year statute of limitations applies. Exporters argue because the HMF is anillegal tax, it is void from its date of enactment, so exporters should be able to obtain refunds regardless of when their HMF was paid.The lower court has yet to rule about the statute of limitations. Appeals are expected on both issues.C-10
Another challenge to the HMF as applied to imports is being mounted on the grounds it is illegal as 1) not severable from the importtax, 2) a violation of the equal protection and port preference clause of the U.S. Constitution, and 3) a violation of U.S. WTOobligations. In the meantime, Customs has announced it will not accept HMF protests for domestic movements, commercial vesselpassengers and admission into foreign trade zones.HMF FOUND UNCONSTITUTIONAL4/98In a decision amazing for its speed and its unanimity, the U.S. Supreme Court has declared the harbor maintenance fee (HMF) anunconstitutional tax on exports by a vote of 9 - 0 . As a result, any exporter who filed a claim with the Court of International Trade(CIT) under the two year jurisdictional statute can expect refunds - maybe!The CIT has issued an order stating the government is to develop a claim form. The refunds will be issued with interest. The claimform is to be completed within thirty (30) days and the bulk of the refund claims are to be processed within 18 months. The claimswill be processed even if there are issues on appeal regarding the statute of limitations, interest or any other issue.It is expected the claim form the government develops may also be applied to those who have protests pending. When the claim formis finalized and the requirements to prove a claim are issued, those details will be published in the Customs Bulletin.SUPREME COURT TO HEAR HMF CASE11/97The U.S. Supreme Court has agreed to hear the government's appeal of the harbor maintenance tax case. A decision is expected byearly next summer. In the meantime, exporters should continue to pay the tax, seek refunds from Customs and file court action. Up tonow the courts have uniformly held any exporter has two years from date of payment in which to file an action seeking refund of allsums paid. However, until the decision is final (and it is not yet), all options should be kept open by seeking refunds from Customs,too.HMF REFUNDS8/97C-11
Depending on the source, Customs either has already filed or is about to file a Notice of Appeal with the U.S. Supreme Court seekinga hearing on the case involving the harbor maintenance fee (HMF) on exports. Exporters have won before both lower courts whichhave held the HMF is an illegal tax on exports. A similar case was filed regarding imports: Sarne Corp. vs. U.S.. It was dismissed witha finding that Sarne could point to no specific harm caused to it by the way in which the Harbor Maintenance Trust Fund isadministered. It is not clear whether the import case will be appealed. On the export side, it is not clear the Supreme Court will agreeto hear the case because it recently decided U.S. vs. Int'l Business Machines Corp. and found a non-discriminatory federal tax onexports to be unconstitutional.HMF LOSES AGAIN6/97Late last week the appellate court issued its ruling confirming the lower court decision that the harbor maintenance fee (HMF) is anunconstitutional tax on exports. The court also found there is no discretion for Customs to exercise, so exporters wishing to receiveHMF refunds need not protest first. All exporters need do is file complaints at the Court of International Trade (CIT) within two (2)years of having made their payments.It is expected the government will appeal the decision, although it is not clear whether the Supreme Court will agree to hear the case,having recently ruled regarding unconstitutional taxes on exports in another matter. In the meantime, exporters should continue to fileboth protests with Customs and complaints at the CIT.The HMF challenge to imports failed with the judge finding that relief from the HMF on imports must come from Congress and notthe court.HARBOR MAINTENANCE FEE UPDATEIt was originally thought that oral argument on the harbor maintenance fee (HMF) case (U.S. Shoe) would take place before the end of1996. Then it seemed likely the time frame would be February 1997. Even once argued, it was unclear how long the Court of Appealsfor the Federal Circuit would take to reach the decision whether or not it agreed with the lower court that the HMF on exports isunconstitutional. Individual exporters were advised to continue to file their protests at time of payment while also seeking reliefdirectly from the Court of International Trade for these same payments.C-12
Appendix D: Estimating Harbor Maintenance Tax RevenuesProblems surrounding the data for HMT collections, and strategies for calculating theestimated tax collected are presented in “Short-Sea Vessel Service and HarborMaintenance Tax,” Prepared for The Short Sea Shipping Cooperative Program – SCOOP,by National Ports and Waterways <strong>Institute</strong> University of New Orleans, October 2005. (Bypermission.) See http://www.shortsea.us/scoop_hmt_report.pdf (This report provides acomparison between the amount of HMT collected with private and external benefitsattained by short-sea intermodal operations.)We note below from this report a statement summarizing data problems, as well asrelevant tables for calculating the HMT in a specific import situatation. Pursuing thesedata and making up to date calculations for the lake-wise variables and the <strong>Great</strong> <strong>Lakes</strong>region would constitute an appropriate area for further research:“The enforcement of 0.125% ad-valorem tax, HMT, on domestic cargomovements is complicated by many factors. First, vessel operators carryingdomestic cargo are used to reporting the weight of shipments and not the value,and secondly, as most of the cargo involved are bulk shipments, the calculation ofweights is relatively easy. In contrast, break-bulk cargo and space consuminglight material, etc. are reported in terms of measurement tons and the overalltonnage is often estimated as revenue tonnage. Because of these data constraints,it is not possible to compare actual revenue collections against the value ofdomestic cargo or to determine the degree of compliance in paying the levy.” III-6D-1
D-2
D-3
Lake-wise cargo movements for 2002 and 2003 are analyzedby commodity types and in terms of relative shares in Figure III-6.Although the SCOOP report estimates Coastwise Tonnage Estimates Subject to HMTLevy, 2003 Lake-wise levies are not estimated.D-4
Alternatives to Petroleum Based Fuelfor Marine VesselsFinal ReportPrepared by:Abu R. HasanProfessorDepartment of Chemical EngineeringUniversity of Minnesota DuluthDaniel PopeAssistant ProfessorDepartment of Mechanical/Industrial EngineeringUniversity of Minnesota DuluthJames A. SkurlaActing DirectorBureau of Business and Economic <strong>Research</strong>Labovitz School of Business and EconomicsUniversity of Minnesota DuluthNovember 2006This report represents the results of research conducted by the authors and does not necessarily represent the viewsor policies of the <strong>Great</strong> <strong>Lakes</strong> <strong>Maritime</strong> <strong>Research</strong> <strong>Institute</strong>. This report does not contain a standard or specifiedtechnique. The authors and the <strong>Great</strong> <strong>Lakes</strong> <strong>Maritime</strong> <strong>Research</strong> <strong>Institute</strong> do not endorse products or manufacturers.Trade or manufacturers’ names appear herein solely because they are considered essential to this report.<strong>Great</strong> <strong>Lakes</strong> <strong>Maritime</strong><strong>Research</strong> <strong>Institute</strong>A University of WisconsinSuperior andUniversity of Minnesota Duluth Consortium<strong>Research</strong> funded in part by the <strong>Great</strong> <strong>Lakes</strong> <strong>Maritime</strong> <strong>Research</strong> <strong>Institute</strong>i
Acknowledgements<strong>Research</strong> Team:UMD College of EngineeringAbu R. Hassan, Department of Chemical EngineeringDaniel Pope, Department of Mechanical and Industrial EngineeringBenjamin Breidall, Undergraduate <strong>Research</strong> AssistantUMD Labovitz School of Business and EconomicsBureau of Business and Economic <strong>Research</strong>James A. Skurla, Acting DirectorJean Jacobson, Senior EditorPaul Hochsprung, Undergraduate <strong>Research</strong> AssistantEla Martopullo, Undergraduate <strong>Research</strong> AssistantNitya Malik, Undergraduate <strong>Research</strong> AssistantDavid Slegh, Undergraduate <strong>Research</strong> AssistantNicholas Linde, Undergraduate <strong>Research</strong> AssistantVickie AlmquistMinko, Executive Administrative SpecialistAlso thanks to:Murphy Oil USA Inc., Joe CuseoDuluth Seaway Port Authority:Capt. Ray Skelton, Security, and Environmental and Government Affairs DirectorJames D. Sharrow, Facilities ManagerDuluth Biodiesel CoopDale Hedtke, PE, Hedco, LLC, Process EngineeringRalph Groschen, Senior Marketing Specialist, Minnesota State Department ofAgriculture, Agricultural Utilization <strong>Research</strong> <strong>Institute</strong> (AURI)Tim Downey, Saint Lawrence Seaway Development CorporationRichard W. Harkins, V.P., Lake Carriers Association<strong>Great</strong> <strong>Lakes</strong> <strong>Maritime</strong> <strong>Research</strong> <strong>Institute</strong> Contact:Eil Kwon, Director, Transportation <strong>Research</strong> ProgramsCoDirector, <strong>Great</strong> <strong>Lakes</strong> <strong>Maritime</strong> <strong>Research</strong> <strong>Institute</strong>University of Minnesota Duluthi
Table of ContentsExecutive Summary ..................................................................................................... vChapter 1: Overview1.1 Introduction ...................................................................................................11.2 <strong>Research</strong> Questions..........................................................................................1.3 Report Organization.......................................................................................1Chapter 2: Biodiesel: An Alternative Fuel for <strong>Great</strong> <strong>Lakes</strong> Marine Vessels2.1 Introduction..............................................................................................32.2 Background..............................................................................................32.2.1 Definition of Biodiesel and Blends ...............................................32.2.2 Properties of Biodiesel..................................................................52.2.3 Production of B100.......................................................................52.2.4 Legal Mandates and Incentives .....................................................62.3 Process Improvement ...............................................................................72.3.1 Biodiesel Production Economics ..................................................72.3.2 Enzymatic Catalyst .......................................................................72.3.3 Potential Problems and Solutions..................................................82.3.4 A Novel Biodiesel Production Method..........................................82.4 Engine Test Data......................................................................................92.4.1 Power/Torque/Fuel Economy .......................................................92.4.2 Emissions .....................................................................................92.4.3 Issues with Usage ....................................................................... 102.4.4 <strong>Maritime</strong> Usage .......................................................................... 112.4.5 Cold Weather Storage Test ......................................................... 122.5 Conclusions and Recommendations........................................................ 12Chapter 3: Biodiesel: An Alternative Fuel for <strong>Great</strong> <strong>Lakes</strong> Marine Vessels;Economic Analysis; Supply and Demand..................................................... 143.1 Introduction............................................................................................ 143.2 Demand and Supply for <strong>Great</strong> <strong>Lakes</strong> <strong>Maritime</strong> Biodiesel Fuel................ <strong>15</strong>3.2.1 Demand ...................................................................................... <strong>15</strong>3.2.2 Supply ........................................................................................ 193.2.3 Incentives, Legislative Mandates ................................................ 203.2.4 Risk ............................................................................................ 23Chapter 4: Potential Economic Impacts ......................................................................... 264.1 Biodiesel Plant Impact............................................................................ 264.2 Findings: Construction Impacts and Operations Impacts......................... 304.3 Conclusions............................................................................................ 344.4 Impact Comparisons............................................................................... 35Chapter 5: Recommendations and Conclusions............................................................. 36ii
References ............................................................................................................... 41Appendix A: Demand and Supply Supporting Data .....................................................A1List of TablesTable 2.1: Biodiesel (B100) requirements from ASTM D6751 ...........................4Table 2.2: Energy content and emissions for B100 and B20 .............................. 10Table 3.1: Diesel Consumption: Vessel Bunkering, Sales ofDistillate Fuel Oil by Energy Use in the United States:Table 3.2:20002004 (in thousands of gallons) ................................................. 17Diesel Consumption: Vessel Bunkering, Sales ofDistillate Fuel Oil by Energy Use in the <strong>Great</strong> <strong>Lakes</strong> States:2004 (in thousands of gallons) ......................................................... 18Table 3.3: U.S. Biodiesel Prices October 2000 to February 2006....................... 18Table 3.4: U.S. Diesel Fuel and Biodiesel Forecast .......................................... 19Table 3.5: U.S. Soybean Production and Price Trends 19962006 .................... 19Table 3.6: <strong>Great</strong> <strong>Lakes</strong> States Soybean Production and Price Trends 2005 ....... 20Table 3.7:<strong>Great</strong> <strong>Lakes</strong> States Soybean Production and Price Trends2005 for <strong>Maritime</strong> ........................................................................... 20Table 3.8: U.S. Biodiesel Tax Incentives........................................................... 21Table 3.9: U.S. Incentive Program Payments Fiscal Year ................................. 21Table 3.10: <strong>Great</strong> <strong>Lakes</strong> States Biodiesel Incentives............................................ 22Table 3.11: Minnesota Biodiesel Mandate........................................................... 23Table 3.12: Producers’ Risk Analysis.................................................................. 23Table 3.13: Consumers’ Risk Analysis ............................................................... 24Table 3.14: Net Energy Gain (or loss) by Fuel..................................................... 24Table 4.1: Summary <strong>Great</strong> <strong>Lakes</strong> Biodiesel Plant Construction ImpactsYear 1 and 2 (2005 Dollars) ............................................................. 30Table 4.2: Value Added Impact from Construction, <strong>Great</strong> <strong>Lakes</strong>Region (2005 dollars) ...................................................................... 31Table 4.3: Output, Impact from Construction, <strong>Great</strong> <strong>Lakes</strong> Region(2005 dollars) .................................................................................. 31Table 4.4: Employment, Impact from Construction, <strong>Great</strong> <strong>Lakes</strong> Region, ............Table 4.5:Year 1, Year 2 ................................................................................. 31Employment Impacts from the <strong>Great</strong> <strong>Lakes</strong> Biodiesel PlantConstruction, <strong>Great</strong> <strong>Lakes</strong> Region, Construction Year 1 and Year 2,by Industry Sector ........................................................................... 33Table 4.6: Summary <strong>Great</strong> <strong>Lakes</strong> Biodiesel Plant Operations ImpactsTypical Year (2005 Dollars) ............................................................ 33Table 4.7: Impact from Operations, <strong>Great</strong> <strong>Lakes</strong> (2005 dollars) ........................ 33Table 4.8:Table 4.9:Employment Impacts from the <strong>Great</strong> <strong>Lakes</strong> Biodiesel Plant,<strong>Great</strong> <strong>Lakes</strong> Region Operations, Total Effect Ranked byIndustry Sector ................................................................................ 34<strong>Great</strong> <strong>Lakes</strong> Biodiesel Plant Construction Totals Impact Comparisons,U.S., <strong>Great</strong> <strong>Lakes</strong> Region (2005 dollars); Year 1, Year 2................. 35iii
Table 4.10:<strong>Great</strong> <strong>Lakes</strong> Biodiesel Plant Operation Totals Impact Comparisons,U.S., <strong>Great</strong> <strong>Lakes</strong> Region (2005 dollars); Typical Year ................... 35Appendix Tables: Demand and Supply Supporting DataTable A1:Table A2:Table A3:Table A4:Table A5:Table A6:Table A7:Table A8:Table A9:<strong>Great</strong> <strong>Lakes</strong> States Soybean Production andPrice Trends 19962006..................................................................A1Minnesota Soybean Production and Price Trends 19962006..........A3Number of Biodiesel Alternative Refuel Sites by <strong>Great</strong> <strong>Lakes</strong>State, 2005......................................................................................A3Minnesota Producers of Biodiesel Fuel, 2006 .................................A4<strong>Great</strong> <strong>Lakes</strong> States Private and Commercial Non HighwayUse of Gasoline2004 .....................................................................A4Marine Diesel Sales, Corunna Refinery, Ontario, Canada ...............A5Biodiesel Fuel, Duluth/Superior Shipping Demand, 2005 ...............A5U.S. Waterborne Traffic by State in 2004 ......................................A5U.S. Biodiesel Production and Consumption Trends.......................A5List of FiguresFigure 1: Transesterfication process...................................................................6Figure 2: Diesel Demand ................................................................................. 16Figure 3: Glycerin as Market Risk ................................................................... 24Figure 4: <strong>Great</strong> <strong>Lakes</strong> Region IMPLAN model information............................. 26Figure 5: <strong>Great</strong> <strong>Lakes</strong> Study area including Illinois, Indiana,Michigan, New York, Ohio, Pennsylvania, Wisconsin, andMinnesota......................................................................................... 26iv
Executive SummaryBiodiesel: An Alternative Fuel for <strong>Great</strong> <strong>Lakes</strong> Marine Vessels, Process Enhancement;Engine Test DataWe investigated use of transesterified vegetable oils – biodiesel – as an alternative fuelfor marine vessels. The project goals were to determine technical and economic viabilityof using biodiesel, investigate cheaper ways to produce it, and study engine performanceusing biodiesel. In addition, we studied the possibility of using fuel cells to enhance theenergy efficiency of biodiesel and to reduce the adverse impact of ships to the marineenvironment.Our investigation has led to the following findings:1. Technically, biodiesel production has become routine. A continuous, economicallyefficient, production process is used by all the large volume producers. Smallerproducers use batch reactors that allow flexibility in operation and use of rawmaterials.Unfortunately, like any other agribased energy source, biodiesel requires someform of federal or state subsidy to be competitive with petroleum based fuel.Minnesota State Statute 239.77, which was adopted on March <strong>15</strong> th , 2002, mandates2% biodiesel fuel by volume in all diesel fuel sold or offered in Minnesota. Themandate officially took effect on September 30 th , 2005, when sufficient biodieselproduction within the state of Minnesota was available to support the mandate.2. An enzyme – lipase – can be used as a catalyst in the production process instead ofthe usual catalyst, sodium hydroxide. Although more expensive, lipase holds thepromise of faster reaction rate and more economical biodiesel production. Furtherinvestigation into the enzymatic production of biodiesel is recommended.3. The use of biodiesel blends in diesel engines lowers overall engine emissions whencompared to petroleumbased diesel. In addition, biodiesel is a renewable energysource, has better lubricity than diesel fuel, is nontoxic and biodegrades faster thandiesel fuel, and can be used in current diesel engines with little or no modification.Environmental concerns, legislative measures, and continued research intoimproved methods of producing biodiesel are among the many factors contributingto the increased use of biodiesel. Both legislative and industrial efforts point to theuse of up to 20% biodiesel blends (B20) in the near future.4. The tendency of biodiesel to act as a solvent and its higher cold flow properties canlead to problems during operation. Individual ship systems should be reviewed toidentify potential cold weather and material compatibility problems prior to theadoption of high biodiesel content blends as a fuel. There is a potential for fuelgelling problems in <strong>Great</strong> <strong>Lakes</strong> vessels over the winter lay up period due to longterm(2 month) storage of biodiesel blends at low temperatures. The developmentv
of a longterm lowtemperature storage test to verify that separation of the blendand preferential gelling of the biodiesel component does not occur is recommended.5. Our study also indicates that although shipboard use of fuel cells using biodiesel isenergy efficient and environment friendly, is very capital intensive and highlyunlikely to be economical.Biodiesel: An Alternative Fuel for <strong>Great</strong> <strong>Lakes</strong> Marine Vessels; Economic Analysis;Supply and Demand; Economic Impact ModelVolatile production and pricing associated with dynamic changes make modeling thebiodiesel industry challenging. For instance, for business planning, a breakeven analysisusually calculates a breakeven point based on fixed costs, variable costs per unit of sales,and revenue per unit of sales. Business planning at the level of individual enterprise issuggested as further research, and assumptions of perunit revenue and perunit cost aswell as assumption of other fixed costs would be estimated through a detailed salesforecast as well as profit and loss data from the industry. Given the aforementionedvolatility of this market, as seen in the supply and demand trends in the foregoing datatables, average sales and costs may not be representative. Analysts predict, however, thatcosts will come down and prices will rise, making the breakeven point a moving target.The variation in feedstock producers, type of feedstock, the possibility of increaseddemand from <strong>Great</strong> <strong>Lakes</strong> maritime fleets, “fixed” costs such as legislated incentives andregulations which can be amended or removed, and the technological advances inchemical processing and operations and enduse engineering can introduce new variablesat any stage of the business model.For the industry sector, it can be assumed that eventually the low cost producers will ableto force the independent producers out of the industry and capture market share. Changesin the industry sector will have impacts for the regional economy.An estimate of economic impacts to the <strong>Great</strong> <strong>Lakes</strong> region from the introduction of morebiodiesel production is provided. The use of biodiesel fuel by <strong>Great</strong> <strong>Lakes</strong> commercialfleets is expected to increase in the future. By the end of the decade, the demand forbiodiesel could be over 30 million gallons. Although over 23 million gallons of dieselsales were disclosed by two <strong>Great</strong> <strong>Lakes</strong> suppliers for this report, other <strong>Great</strong> <strong>Lakes</strong>producers would not reveal sales volume. Therefore total <strong>Great</strong> <strong>Lakes</strong> sales or productioncould not be reported. However, it is possible to assume that a new 30 million gallonsbiodiesel facility could be supported as the <strong>Great</strong> <strong>Lakes</strong> fleets convert to biodiesel usage.Data show that there was total domestic demand for 2.1 billion gallons of distillate fueloil for vessel bunkering in 2004. <strong>Great</strong> <strong>Lakes</strong> states maritime commerce consumes about170 million gallons of diesel fuel. Based on soybean production in 2005 it would onlytake about 9% of the states’ soybean production to satisfy demand for converted biodieselmaritime use. How quickly vessels will convert to biodiesel is unknowable, but some ofthis demand could be supplied by increased biodiesel production. To meet this increaseddemand a new <strong>Great</strong> <strong>Lakes</strong> Biodiesel Plant, of typical production capacity of 30 millionvi
gallons per year, should be feasible. Our assumptions as inputs to these models areconstrained to projections for commercial maritime diesel consumption.With the completion of the construction phase it is estimated that the biodisel plantproject will have spent a total of approximately $33.9 million on construction, and thatthe Biodiesel Plant Project will have generated $64.5 million in spending across the <strong>Great</strong><strong>Lakes</strong> Region over two years. The Value Added economic impact of the $14.3 millionin expenditures for construction are expected to produce an impact of a total of $33.9million for region. In Year 1 of construction, the <strong>Great</strong> <strong>Lakes</strong> Biodiesel Plant is expectedto directly employ 172 workers for construction projects, which will result in the creationof 365 jobs in the Region. In Year 2 the plant is expected to directly employ 86 workersfor construction projects, which will result in the creation of 182 jobs in the region.When operations for the biodiesel plant reach typical year capacity, it is estimated togenerate $48.4 million in direct spending across the <strong>Great</strong> Lake states. The indirectspending adds $22.5 million and $8.1 million (in induced spending). The total $79million in expenditures occurs annually for the life of the facility.During a typical year of operations, <strong>Great</strong> <strong>Lakes</strong> Biodiesel Plant will create over 194 fulltime,parttime, and temporary jobs in the region by directly employing nearly 37 people.■vii
Chapter 1: Overview1.1 IntroductionThis project was proposed in two parts: The first part presents engineering aspects ofbiodiesel fuel use for maritime commerce. This alternative fuel can be used as renewableenergy in current diesel engines. The literature suggests that biodiesel fuel has similarenergy content to diesel and little impact on performance; the fuel has better lubricitythan petrodiesel and it compensates for Ultra Low Sulfur Diesel (ULSD); and thatbiodiesel can use the current distribution infrastructure, with some modifications for coldweather. It is also noted that biodiesel biodegrades faster than petrodiesel, and producesreduced emissions. Part two follows this chapter and offers an economic impact analysis.1.2 <strong>Research</strong> QuestionsGiven these justifications for using biodiesel fuel in maritime operations, this projectproposed to study the fuel production process and engine test data, and specifically, theoperational issues associated with using biodiesel fuel and blends for <strong>Great</strong> <strong>Lakes</strong>maritime commerce. <strong>Research</strong>ers pursued the questions: What are the processenhancements issues for biodiesel fuel in the maritime setting? What are the cold weatherrecommendations? What are the engine conversion issues?In a second part of this project, this report presents a review of supply and demandmarket data for the biodiesel industry, a review of legal mandates and incentives, as wellas economic impact modeling for increased production of biodiesel fuel for maritime use.The larger question of costs and benefits for a maritime fuel conversion is outlined andsuggested for further research in the recommendations of Chapter 5 of this report.1.3 Report OrganizationChapter 1: Overview. A general overview of the project and a description of theorganization of the report, including:- Introduction- <strong>Research</strong> questionsChapter 2: Alternatives to Petroleum Based Fuels for Marine Vessels. Chapter 2 isdivided into the following sections:- Introduction- Background, including B100 and blends; production of B100- Process improvement, including potential improvements, including identifiedenzymatic catalyst (lipase), potential problems; and next step/s to be taken.- Review of available engine test data: performance; emissions;power/torque/fuel economy including general issues with usage; potentialissues for maritime applications; next step/s to be taken.1
Chapter 3: Economic Impacts, Supply and Demand. Chapter 3 is divided into thefollowing sections:- Introduction, including the definition of the research issue, background,relevant literature, methodology, and report organization.- Economics of the suggested conversion, including supply and demand(national picture, <strong>Great</strong> <strong>Lakes</strong> specifics); DuluthSuperior Fleet/Murphy Oil,inputs; status quo picture, petrodiesel, biodiesel (b2); pricing, productiondata, storage, transportation; incentive programs; byproducts; risk analysis.Chapter 4: Potential Economic Impacts of a Biodiesel Fuel Plant for <strong>Great</strong> <strong>Lakes</strong><strong>Maritime</strong> Fuel. This chapter contains our focus on impact modeling including theintroduction of a biodiesel production plant to a <strong>Great</strong> <strong>Lakes</strong> state economy, including:- The I/O model assumptions.- Estimations of industry output, employment (all measures, all effects).- Economic projections.Chapter 5: Conclusions and Recommendations- Engineering conclusions and recommendations, including a discussion oflikely use of up to B20; legislative/economic environment promotes usage;potential to improve production process; summary of next step/s.- Economic conclusions, a summary of the economic impact of the researchfindings, recommendations regarding cost benefit analysis and analysis ofcarbon credit trading, among other strategies.The report includes a reference section which includes citations for all sources mentionedin the body of the report. The report includes one appendix of demand and supplysupporting data. Tables and figures are listed separately in the contents pages as List ofTables and List of Figures and follow chapter numbers.2
Chapter 2: Biodiesel: An Alternative Fuel for <strong>Great</strong> <strong>Lakes</strong> Marine Vessels2.1 IntroductionBiodiesel is a renewable fuel that can be used in current diesel engines with little or nomodification, and is therefore an attractive alternative to the significant volume of #2diesel fuel used by vessels that operate on the <strong>Great</strong> <strong>Lakes</strong>. The following discussionpresents some background on biodiesel, its definition, its properties, a description of theproduction process, and the current mandates and incentives for its use. The productionprocess is investigated in detail and recommendations for potentially reducing biodieselcosts through process improvements are presented. Finally, engine performance andoperational issues are explored and a new test for cold weather operation is proposed.2.2 BackgroundThe increased use of biodiesel and blends of biodiesel and petroleumbased diesel fuelhas been motivated by several factors including; higher fuel prices, concern overemissions, and the uncertainty associated with foreign sources of oil. The production ofbiodiesel is unlikely to ever reach a level where it would completely replace petroleumbaseddiesel in the commercial fuel supply. However, the use of higher percentagebiodiesel blends to extend limited oil supplies appears to be a foregone conclusion giventhe current political environment. Whether it is used as the primary fuel, or as part of ablend, biodiesel offers several attractive advantages:· It is a renewable energy source.· It can be used in current diesel engines.· It has similar properties to diesel fuel.· It has better lubricity than diesel fuel.· The combustion of biodiesel produces fewer harmful emissions.· It requires no major changes in the current distribution infrastructure.· It is nontoxic and biodegrades faster than diesel fuel.In addition to the above advantages, there are several legal mandates and incentives atboth the state and federal level that encourage the use of biodiesel.2.2.1 Definition of Biodiesel and BlendsBiodiesel is defined as “a fuel comprised of monoalkyl esters of long chain fatty acidsderived from vegetable oils or animal fats, designated B100” [1]. Biodiesel in its pureform is designated as B100 to indicate that the mixture consists of 100% (by volume)biodiesel. Blends of biodiesel and distillate fuel (e.g. #2 diesel) are designated by theletter “B” followed by the volume percentage of biodiesel contained in the mixture; forexample, B20 refers to a blend of 20% biodiesel and 80% distillate fuel. The “distillatefuel” used in the blend can consist of a single distillate (e.g. #1 diesel, #2 diesel, fuel oil,etc.) or a mixture of more than one distillate, with the use of #1 and #2 diesel being themost common.3
Biodiesel, as discussed in this report, should not be confused with straight vegetable oil(SVO) or the “homebrew” product described by authors such as Tickell [2]. In general,homemade versions of “biodiesel” often utilize different stock and catalysts thancommercially produced biodiesel and have considerable variability in methanol andglycerin content in the final product. This variability is undesirable in the fuel supply asa standard fuel specification is desired for both predicting performance and designingengines to run efficiently on B100 and its blends. The variability in biodiesel supply hasled to problems with the use of biodiesel and contributed to skepticism within certaincommunities (for example the trucking industry) about the incorporation of biodieselblends in the commercial fuel supply.The international standard that delineates the properties and testing procedures for B100is ASTM D6751 [1]. Table provides a summary of the ASTM D6751 standard for gradeS<strong>15</strong> (sulfur content of less than <strong>15</strong> ppm) biodiesel. There is a separate standard for dieselfuel (ASTM D975 [3]) which includes testing procedures for both oxidation (long term)(ASTM D2274 [4] and ASTM D4625 [5]) and thermal (ASTM D6468 [6]) stability.Thermal and oxidation stability tests are accurate when used with diesel fuels and ASTMD6468 [6] testing indicates that B100 has good thermal stability. However, as theliterature review provided by Waynick [7] shows, the oxidation tests are not reliable forpredicting the oxidation stability of B100 and biodiesel blends. Westbrook [8] discussedcombining a modified ASTM D2274 test with kinematic viscosity and acid number tests.The results show promise for characterizing B100 oxidation stability, but the limitedamount of data is insufficient to specify stability limits. The problem of definingoxidation stability for biodiesel blends is further complicated by a lack of any standardfor biodiesel blend properties. A standard for B20 is currently being defined by ASTM[9] in coordination with OEM engine manufacturers.Property Test Method Grade S<strong>15</strong> LimitsFlash point D 93 130°C minWater and sediment D 2709 0.05 % volume maxKinematic viscosity D 4451.96.0 mm 2 /sSulfated ash D 874 0.02 % mass maxSulfur D 5453 0.00<strong>15</strong> % mass (ppm) maxCopper strip corrosion D 130 No. 3 maxCetane number D 613 47 minCloud point D 2500 ReportCarbon residue D 4530 0.05 % mass maxAcid number D 664 0.80 mg KOH/g maxFree glycerin D 6584 0.02 % massTotal glycerin D 6584 0.24 % massPhosphorous content D 4951 0.001 % mass maxDistillation temperature D 1160 360°C maxTable 2.1: Biodiesel (B100) requirements from ASTM D6751 [1].4
2.2.2 Properties of BiodieselThe properties of biodiesel vary slightly based on the vegetable oil used as the feedstock.In general, the properties of biodiesel are similar to #2 diesel fuel which allows it to beused directly in dieselpowered vehicles. The kinematic viscosity and density ofbiodiesel are close to that of #2 diesel, resulting in only minor changes in fuel deliverycharacteristics. The energy content of B100 is only slightly lower than that for #2 dieseland has little impact on engine power, torque, and fuel economy. As previouslydiscussed, the use of biodiesel has several advantages over #2 diesel. Biodiesel isnontoxic and biodegradable, reducing fuel handling requirements. It has better lubricitythan diesel fuel which reduces wear on fuel system parts such as injectors and pumpbearings. Biodiesel could be used as an additive to ultra low sulfur diesel which suffersfrom low lubricity. The combustion of biodiesel produces fewer harmful emissionsoverall. Unburned hydrocarbon (HC), carbon monoxide (CO), and particulate matter(PM) emissions from combustion of biodiesel are significantly lower than those fromburning #2 diesel.Biodiesel also exhibits some less desirable properties that can cause operationalproblems. It acts as a solvent and will remove paint from surfaces and degrade someelastomers and rubber parts (e.g. fuel pump seals). Biodiesel has a tendency to gel athigher temperatures than #2 diesel. The increase in cold flow properties (tendency to gel)associated with biodiesel is quantified using cold filter plugging point, cloud point, andpour point tests. The cloud point, which is the temperature at which solid crystal firstappear, has an average value of 3 deg. F for #2 diesel and 32 to 40 deg F for B100. Thus,B100 is not suited for use in cold climates if fuel system components are exposed to theenvironment. However, tests have shown that the cloud point for a B20 blend with #2diesel is approximately 7 deg F. Solutions for the problems associated with the use ofbiodiesel will be addressed later in this report.2.2.3 Production of B100There are three general methods for producing biodiesel; base catalyzedtransesterification of oil with alcohol, direct acid catalyzed esterification of oil withmethanol, and conversion of oil to fatty acids, and then to alkyl esters with acid catalysis.The first of these methods has several advantages and is the most widely used; it is a lowtemperature and pressure process, it has high conversion efficiency, it has a short reactiontime, and it does not require exotic construction materials.The transesterification process involves the mixing of vegetable oil with an alcohol and acatalyst as shown in Figure 2. The vegetable oil is usually soybean or canola oil and themost commonly used alcohol is methanol. The catalyst for the reaction can be sodiumhydroxide (NaOH), potassium hydroxide (KOH), or sodium methylate (NaOCH 3 ).Initial mixture fractions by volume are approximately 87%, 12%, and 1% for thevegetable oil, methanol, and catalyst respectively. The reaction takes place in either abatch or continuously stirred reactor and has a 98% conversion efficiency resulting in86% methyl ester (biodiesel), 9% glycerin, 4% alcohol (unreacted), and 1% fertilizer by5
volume. The byproduct glycerin has a higher density than biodiesel and may beremoved via settling tank or centrifugal separator. The unreacted methanol may also berecovered for reuse.The increased demand for biodiesel has led to the construction of several plants acrossthe nation. According to the National Biodiesel Board (NBB), there are currently 86biodiesel plants in the U.S. with annual capacities ranging from 50,000 to 30,000,000gallons [10]. The three states with the largest biodiesel production capacity are Iowa,Texas, and Minnesota. Biodiesel is produced at three main plants within Minnesota: theMinnesota Soybean Processors (MNSP) plant in Brewster [11], the SoyMor plant inAlbert Lea [12], and the Farmers Union Marketing and Processing Association (FUMPA)plant in Redwood Falls [13]. Biodiesel producers ship the B100 to refineries, such as theFlint Hills Resources’ Pine Bend refinery in Rosemount, MN [14] or the Murphy Oilrefinery in Superior, WI [<strong>15</strong>], where it is blended with diesel fuel.O||R―C―O―CH 2O||R―C―O―CH 3CH 2 ―OHO||R―C―O―CH+ 3CH 3 OHcatalystO||R―C―O―CH 3+CH―OHO||R―C―O―CH 2O||R―C―O―CH 3CH 2 ―OHVegetable Oil(Triglyceride)+Alcohol(Methanol)3 Esters(Methyl Ester)+GlycerinR = Fatty AcidFigure 2: Transesterification process.2.2.4 Legal Mandates and IncentivesSeveral pieces of biodiesel legislation have been enacted over the past five years at boththe state and federal levels. For example, Minnesota State Statute 239.77, adopted onMarch <strong>15</strong> th , 2002, mandates 2% biodiesel content in all diesel fuel sold in Minnesota.This mandate, which officially took effect on September 30 th , 2005, has supported thedevelopment of three biodiesel plants in the state of Minnesota. There are currently 38states that have legal incentives and/or usage mandates for biodiesel. On the federallevel, B20, which is a mixture of 20% biodiesel and 80% petroleum diesel, was approvedas an alternative fuel for use by federal, state, county and utility company vehicles underthe Energy Policy Act of 1992 (EPACT). More recently, in response to the 2005EPACT, the EPA has specified that a minimum of 2.78% of all fuel used nationwide will6
e renewable fuels (e.g. ethanol and biodiesel) [16]. The EPA also recognizes the use ofbiodiesel in emissions reduction strategies as part of their Clean Diesel [17] and CleanPorts USA [18] Programs.2.3 Process ImprovementIn general, the biodiesel production process can be described as esterification ofvegetable oils by the process of alcoholysis [19,20]. For either batch (low production) orcontinuous (production rate > 1 million gal/year) production, a vegetable oil is reactedwith methanol and a solvent (to promote mixing) in the presence of sodium catalyst (toreduce reaction activation energy). The reaction may be represented by,CH O RO R ' O R ''+ 3 CH OH52CH52( OH )2333¬ ¾®+ CH OOR + CH OOR ' + CH OOR ''where R , R’ and R’’ are primarily 16, 17, and 18 carbon chains. The triglycerides fromvegetable oil in this process are converted to three separate methyl esters.2.3.1 Biodiesel Production EconomicsA preliminary technical and economic feasibility study of biodiesel production usingsoybean oil and the method described above was studied for this project. The recentfindings of Haley et al. [21] are adapted for this purpose. For a 10 million gallon/yearproduction facility, the total capital investment required is about $9.5 million dollars andthe production cost is about $2.50/gal. Considering inflation, the production cost forbiodiesel for 2006 would be about $2.75/gal. Thus, biodiesel is not competitive withpetroleumbased diesel unless indirect (mandated use) or direct incentives are providedby the federal, state, or local government.Our efforts to improve the economics of biodiesel production led us to thoroughlyinvestigate an enzymatic catalyst that has the promise of increasing the esterification rateand decreasing effective production cost.2.3.2 Enzymatic CatalystOur investigation into more efficient production of biodiesel from soybean oil led us tolipase, an enzymatic catalyst, to replace sodium hydroxide (NaOH) in the esterificationreaction of soybean or other vegetable oils. Lipase is much more expensive than NaOH.In spite of its cost, lipase could potentially reduce production cost because it is recyclableand because it eliminates a separation step in the traditional base catalyzed process.P.flouroscens is a widely used variety of lipase. Other varieties include T. langinosa,R.miehei, and Candida Antarctica (Novozym 435). Candida Antarctica has a number ofinteresting properties that make it a candidate for further investigation.Esterification using lipase as a catalyst generally requires it to be immobilized on sometype of carrier particle allowing collection of the catalyst after the reaction is completed.337
A few simple “cleansing” steps are required for the catalyst to be reused. The reaction isessentially similar to the traditional process in that the raw feed (vegetable oil) is reactedwith a primary alcohol (usually methanol) to produce methyl esters and a byproductglycerol.2.3.3 Potential Problems and SolutionsUsing the more expensive enzymatic catalyst in place of NaOH poses a few potentialproblems. These problems are briefly described below.· Methanol (used for esterification) is known to deactivate the lipase,greatly hindering its catalytic capabilities.· Lipases are expensive, and must be reusable to be cost effective.· Glycerol, the byproduct of esterification reaction, seems to reduce theconversion of methyl esters, possibly due to unwanted side reactions.· No reliable continuous process of esterification using lipase has beendeveloped yet. A continuous process for biodiesel production is highlydesirable to keep production costs low.To improve the economics of biodiesel production using a lipase as the catalyst we arelooking into the following process improvements:· A stepwise addition of methanol to reduce the deactivation of the lipaseby the alcohol. This may be done in a three part process; one molarequivalent being added every few hours a total of three times, resulting inthe required 3:1 methanol to oil ratio. While this is effective, catalystdeactivation tends to be inevitable at some point. A good process seems torun about 10 batches before noticeable deactivation occurs.· Different “carriers” of the lipase have been investigated to maximizeconversion. One common carrier is polypropylene 100EP forP.flouroscens.· Glycerol adsorbing compounds have been investigated to consume theglycerol and allow for a higher conversion. This incurs the loss of avaluable byproduct and may require additional steps to deal with theadditives.· Alternate alcohols have been used to improve miscibility and/or lower thedeactivation rate of the lipase caused by methanol.2.3.4 A Novel Biodiesel Production MethodWe believe that a new biodiesel production process, based on the work of Xu et al. [22]that addresses the abovementioned problem areas, could significantly increase the fuel’scompetitiveness. In this process, methyl acetate is used as the reacting alcohol withsoybean oil, and immobilized Candida Antarctica as the lipase catalyst. Methyl acetatehas negligible effect on the catalyst. The main byproduct, triacetylglycerol (instead ofglycerol), is not absorbed on the catalyst surface, alleviating the catalyst deactivationproblem. In addition, the recent work of Cortright [23] shows the promise of low costhydrogen production from triacetylglycerol [24].8
2.4 Engine Test DataSummaries of the available literature for engine tests using biodiesel can be found on theNBB [25] and EPA [26] websites. The majority of engine test data for onroad dieselengines. While these engines are not precisely the same as those used on maritimevessels, most of the results can be generalized to any diesel engine. The availableliterature provides useful guidance for incorporating biodiesel in the fuel supply. Ofparticular interest are the effects of biodiesel on both direct performance measurements,such as power, torque and fuel economy, and the environmental impact via emissions.2.4.1 Power/Torque/Fuel EconomyBiodiesel has slightly lower energy content per unit volume (average of approximately 33MJ/L) than #2 diesel (36 MJ/L) which tends to cause a corresponding reduction inmaximum power, maximum torque, and fuel economy. The reduction in performancedecreases with the percentage of biodiesel in a blend. The engine testing results ofRakopoulos et al. [27] show that, within the range of experimental uncertainty, B10 andB20 blends exhibit similar performance to #2 diesel fuel. However, performance resultsusing biodiesel blends are affected by the specific engine used, the percentage load atwhich the engine is operated, and the vegetable oil used in producing the biodiesel [27].2.4.2 EmissionsTable 2 shows a summary of “average” biodiesel energy content and emissions results[28] obtained from reference [29]. The table shows that the use of biodiesel and biodieselblends results in reductions in most regulated emissions. Total unburned hydrocarbons(THC), carbon monoxide (CO), and particulate matter (PM) emissions decreasesignificantly with biodiesel usage, while oxides of nitrogen (NOx) emissions increasemoderately. It should be stressed that these are “average” emission results, and may notreflect actual conditions obtained using a specific engine and “type” of biodiesel used inthe blend. However, the large reductions in THC, CO, and PM indicate that a reductioncan be expected in these emissions regardless of the engine or “type” of biodiesel used.The slight increase in NOx emissions shown in Table 2 may or may not be present for aspecific engine and/or “type” of biodiesel. For example, the test results of Rakopoulos etal. [27] show a slight reduction in NOx emissions when comparing results using #2 dieselto results using B20 blends produced from five different “types” (cottonseed oil, soybeanoil, sunflower oil, rapeseed oil, and palm oil methyl ester) of biodiesel.Table 2 also shows the “average” emissions results for some nonregulated pollutants.Emissions of sulfates, polycyclic aromatic hydrocarbons (PAH’s), nitrated PAH’s(nPAH), and hydrocarbon species that can react to form smog, are greatly reduced withthe use of biodiesel. Since B100 is derived from vegetable oil, it contains no sulfurcompounds, and thus sulfate emissions are reduced in proportion to the percent volume ofbiodiesel in the blend. The primary concern over sulfur emissions is the potential toproduce acid rain. The reduction of sulfur emissions is currently being addressed via the9
introduction of ultra low sulfur diesel (ULSD) in the fuel supply. Polycyclic aromatichydrocarbons and nPAH’s have been identified as potential cancer causing compounds[28] and are precursors to soot (particulate matter) formation. Smog is a form of airpollution in which certain emissions react to produce several irritating and oxidizingcompounds, the most prominent of which is ozone. Nitrogen oxides, hydrocarbons, andsunlight are required to form smog. The reaction of certain hydrocarbons with nitrogenoxide (NO) contributes to the formation of ozone. The tendency of hydrocarbonemissions to contribute to ozone formation is described as the ozone potential ofspeciated hydrocarbons. Even though the last four pollutants in Table 2 are currentlyunregulated, the reduction in these pollutants is clearly desired.Biodiesel Content B100 B20Energy Content/Gal 8%
OEM manufacturer should be consulted to verify compatibility and ensure enginewarrantees will be honored. Biodiesel blends up to B20 have been used in older engineswithout any observed fuel system component degradation. However, a prudent course ofaction would be to upgrade fuel system components if B20 is to be used. Because it is asolvent, B100 will remove deposits left in the fuel system by petroleum diesel, which canlead to clogged fuel filters. When switching directly from petroleum diesel to B100, fuelfilters should be checked and cleaned frequently until the fuel system deposits areremoved. Blends as high as B20 have not shown the same tendency to remove fuelsystem deposits, however, more frequent checking and cleaning of the fuel filters shouldstill initially be performed.Engine operation in cold weather can be problematic due to the higher cold flowproperties associated with B100. As a precaution, B100 should not be used withoutheated fuel tanks and fuel lines if the temperature is below 40°F. This is a conservativeestimate since the “average” cloud point of B100 is 32°F as compared to 3°F for #2diesel. Blends up to B20 can be used in environments with temperatures approaching theoperational temperature for the distillate used in the blend. For example, the cloud pointof #2 diesel is 3°F, and when B20 is produced with #2 diesel, the cloud point isapproximately 7°F. The solutions for avoiding fuel gelling when using B100 or abiodiesel blend (such as B20) are the same as those for #2 diesel. Namely, blend with #1diesel, use a fuel line heater, keep the engine and fuel lines in an environmentallycontrolled space, and use cold flow enhancing fuel additives.2.4.4 <strong>Maritime</strong> UsageBiodiesel blends up to approximately B20 can be used as direct replacements for dieselpowered equipment on maritime vessels that utilizes #2 diesel with little or nomodification to current systems. The use of a B20 blend will allow for measurablereductions in emissions with no noticeable decrease in fuel economy. Many OEM enginemanufacturers currently certify the use of up to B5 in their engines as long as both thebiodiesel and the distillate portion of the blend meet ASTM specifications. ASTMInternational is currently working with OEM engine manufacturers to create a B20standard for engine certification tests. Main engines that operate on heavy fuel oils orBunker C are not candidates for the use of B20.Examples of ship board systems that currently use #2 diesel include, the main engines onships with EMD diesels, dieselgenerator sets, emergency generators, and deck cranepower packs. The specific engines that power these systems, as well as the makeup ofthe systems themselves, vary from ship to ship. Some components, such as the deckcrane power packs, have fuel systems exposed to ambient weather conditions, while othercomponents, such as the dieselgenerator sets, have fuel system components inenvironmentally controlled spaces. As a result, no single set of rules for converting toB20 usage can be delineated, and the general rules for dealing with the issues discussedin the preceding section should be applied to each system on each ship.11
A potential problem with maritime operation that has not been addressed in the literatureis that of the longterm stability of biodiesel blends in cold weather. As discussed earlierin this report, stability tests address both the thermal [6] and oxidation [4,5] stability.These tests use a slightly elevated temperature to simulate longterm storage (greater than4 to 6 months). This is unlikely to be a problem with vessels on the <strong>Great</strong> <strong>Lakes</strong>, whichrefuel often. The exception to frequent refueling occurs during the winter lay up period(2 months), when the portions of the main fuel tank below the waterline are atapproximately 0°C (32°C) and portions above the waterline may be at temperaturesslightly below freezing. Auxiliary systems may have components exposed to belowfreezing temperatures. The available stability tests do not address this potential coldweather problem. The 2004 Biodiesel Handling and Use Guidelines [30] recommendsthat blends should be stored at 5 to 10°F above the cloud point of the blended fuel, whichsuggests that distillate portion of a B20 blend should consist of “winter diesel” (a mix of#1 and #2 diesel). Given that this is done, it is still unclear if prolonged exposure of aB20 (or lower) blend to low temperatures causes any separation and preferential gellingof the biodiesel component.2.4.5 Cold Weather Storage TestThere is currently no test specification for extended storage of biodiesel blends at lowtemperatures. However, the 2004 Biodiesel Handling and Use Guidelines [30] present atest to check for stratification of biodiesel blends. We plan to modify this test to visuallycheck for biodiesel crystallization and determine if any stratification occurs under lowtemperatures for extended periods. Such a test would provide useful information topotential biodiesel users on the <strong>Great</strong> <strong>Lakes</strong>.2.5 Conclusions and RecommendationsThe preceding discussion suggests that biodiesel is an attractive alternative to petroleumbaseddiesel. The shift to increased biodiesel usage is being driven by, among otherfactors, environmental concerns, legislative measures, and continued research intoimproved methods of producing biodiesel. Based on both legislative trends and theefforts of OEM engine manufacturers, it appears likely that B20 will become the standardblend in the diesel fuel supply sometime in the foreseeable future, much as E10 hasbecome a standard fuel in the Midwestern states gasoline fuel supply.Investigations into possible improvements in the biodiesel production process led to thepotential use of a lipase as a replacement for the currently used catalyst sodiumhydroxide. The commercial development of a lipasebased process could lower fuelcosts and would represent a novel approach to biodiesel production. Hydrogen gas couldbe extracted from the primary byproduct (triacetylglycerol) of the new process toproduce energy via either direct combustion or a fuel cell. Investigation into thedevelopment of a commercially viable lipasebased production process should becontinued.12
A review of the literature addressing engine performance and operational issues showsthat, while biodiesel has several advantages, such as reduced emissions, the use ofbiodiesel and its blends in cold weather conditions presents some problems. Theguidelines for conversion from petroleumbased diesel to the use of biodiesel blends likeB20 suggest that a review of current individual ship systems to identify potential coldweather and material compatibility problems should be performed. This can beaccomplished proactively since mandated biodiesel content will likely increase in a stepwisemanner over time, for example, from B2 to B5 to B10, and finally to B20. Aparticular concern for marine vessels on the <strong>Great</strong> <strong>Lakes</strong> is potential fuel problems due tostorage of biodiesel blends at the low temperatures present during the winter lay upperiod. It is recommended that a longterm lowtemperature test be developed to verifythat separation of the blend and preferential gelling of the biodiesel component does notoccur.13
Chapter 3: Biodiesel: An Alternative Fuel for <strong>Great</strong> <strong>Lakes</strong> Marine Vessels;Economic Analysis, Demand and Supply3.1 IntroductionIn the past application of biodiesel for merchant ship propulsion on a large scale has notbeen seen as an option because of the unavailability of fuel. Background literature hasshown a 2% blend of biodiesel is estimated to increase the cost of diesel by 2 or 3 centsper gallon, which includes the fuel, transportation, storage, and blending costs. Thefollowing tables quantify demand and supply for biodiesel fuel, review incentives andrisk including byproducts as market risk.<strong>Research</strong> issue. The Labovitz School proposes to quantify the economic impact of fuelconversion from current petroleum based fuel to biodiesel fuel as presented in theresearch findings for the <strong>Great</strong> <strong>Lakes</strong> <strong>Maritime</strong> <strong>Research</strong> <strong>Institute</strong> project by the UMDDepartments of Chemical and Industrial Engineering.Financial and economic scenarios for conversion will be modeled.This study was contracted for by the <strong>Great</strong> <strong>Lakes</strong> <strong>Maritime</strong> <strong>Research</strong> <strong>Institute</strong>.The contract for this study has the following project description:The economic analysis will include modeling of supply and demand for biodieselfuel.<strong>Great</strong> <strong>Lakes</strong> shipping requirements will be highlighted; an overview of federaland <strong>Great</strong> Lake states regulations and biofuel subsidies will be completed.Comparisons between the U.S. and <strong>Great</strong> <strong>Lakes</strong> Region for the modeling,regulations, and subsidies will be reported.Background. The advantages of using biodiesel include supporting domesticallyproduced fuel that helps the agriculture sector and drastically decreases in the amount ofpolluting emissions. Biodiesel is the only alternative fuel to have fully completed thehealth effects testing requirements of the Clean Air Act. The use of biodiesel in aconventional diesel engine results in substantial reduction of unburned hydrocarbons,carbon monoxide, and particulate matter compared to emissions from diesel fuel. Inaddition, the exhaust emissions of sulfur oxides and sulfates (major components of acidrain) from biodiesel are essentially eliminated compared to diesel. Soybean oil iscurrently the leading source of virgin vegetable oil used for biodiesel feedstock in theUnited States.[31]Biodiesel tax credits are available so it will make it competitive with petroleum. [32]General business credit requires certification and eligibility for selling or using biodiesel(not in a mixture) as a fuel. The biodiesel fuel credit consists of a straight biodiesel fuel14
credit and a biodiesel mixture credit. Certification must identify the product producedand the percentage of biodiesel and agricbiodiesel in the product. [Currently, the creditis not allowed for biodiesel (or agricbiodiesel) used as a fuel in a trade or business if thatbiodiesel (or agricbiodiesel) was sold in a retail sale for circumstances described by theIRS.]The U.S. Department of Agriculture announced in January 2001 the implementation ofthe first program providing cost incentives for the production of 36 million gallons ofbiodiesel. Bills supporting the use of biodiesel and ethanol were also introduced to theU.S. Congress in 2003, including one that would set a renewable standard for fuel in theU.S. and one that would give biodiesel a partial fuel excise tax exemption. More than adozen states have passed favorable biodiesel legislation. [See: 2005 Federal Energy BillProvisions; and MN State Energy Legislation 2005.] [33]Biodiesel is known to have a solvent effect that may release deposits accumulated on tankwalls and pipes from previous diesel fuel storage. This affect is much more dramatic withB100 than with biodiesel blends like B20.Relevant sources and literature. Secondary data sources include, but are not limited to,the U.S. Department of Energy, Energy Information Administration, for oil pricingtrends; the MN Soybean Processors for producer data; Farmers Union Marketing andProcessing Association (FUMPA) for producer data; U.S. Department of Transportationand the Census; the Bureau of Economic Analysis for commodity and industry tables; theNational Biodiesel Board for trade association and industry data; and the RenewableFuels Association for industry statistics. One of the fastest moving statistical sources forbiodiesel data to date remains the National Biodiesel Board (nbdb.org).Methodology. This economic analysis does not include assumptions from the wideranging national discussion of biodiesel processes and its use as a fuel, nor does itdevelop arguments or contribute to many of the environmental and economic topicscurrently being pursued by interest groups.This economic analysis looks briefly at the national picture, for perspective andcomparisons but focuses on the regional industry impacts for the <strong>Great</strong> <strong>Lakes</strong>. Theanalysis presents for comparison measures of the petrodiesel supply chain, and comparesthe hypothetical B2 supply chain including financial considerations such as pricing,production data. Also presented on a local and regional basis are incentive programs,regulations, and subsidies from the federal government, the State of MN, and other <strong>Great</strong><strong>Lakes</strong> regional agencies.A larger economic perspective includes strategies such as carbon credits trading, as abusiness asset, which are one choice among many for fuel consumers to consider whenplanning for regulation compliance. Carbon credit trading is part of a larger incentiveapproach. The market gives consumers the opportunity to choose the most efficientmeans for reducing their carbon emissions. Benefit cost analysis presents a range of othercompliance strategies, in some cases choices more efficient (less expensive, more<strong>15</strong>
productive) than mandating change to biodiesel fuel. This research includes: review ofthe economics of emissions regulation strategies (of which carbon credit trading is one);study of appropriate caps on emissions levels; quantifying the variety of incentives thatencourage consumer compliance with regulatory caps; and comparing economic benefitand cost to various stakeholders. These strategies are taken up in Chapter 5:Recommendations to this report.3.2 Demand and Supply for <strong>Great</strong> <strong>Lakes</strong> <strong>Maritime</strong> Biodiesel FuelThe fuel tested for this study was specifically derived from soybean feedstock andblended as B2 fuel. Therefore the following discussion will present supply chaininformation based on these two attributes and generally constrained to the study area for<strong>Great</strong> <strong>Lakes</strong> maritime commerce.The supply chain for biodiesel demand and supply production and delivery is madecomplicated by vertical integration of processes at various points in the supply chain. Forinstance, producers and distributors are often the same entity, as are distributors andretailers. This industry started with small independent entrepreneurs, with demand as agrass roots movement at large, however large and global scale production is growing, forinstance the aggressive Brazilian project, so that the small players are destined to besubsumed into conglomerate structures. For our analysis, the changing nature of thesestructures, and the volatile production and pricing associated with these dynamic changesmake modeling the industry in its infancy beyond the scope of this project. An analogycan be drawn with the computer industry, when the industry was first beginning therewere many independent producers trying to meet growing demand. Eventually the lowcost producers were able to force the independent producers out of the industry andcapture more and more market share. Thus, the moving target of capturing data to showtrends and industry structure, as we attempt to do below, is challenging.3.2.1 DemandDemand will be presented first from the larger national perspective, then from the <strong>Great</strong><strong>Lakes</strong> and maritime perspectives. The national overview of transportation energy crudeoil consumption is shown in the graphic below. Data from the Transportation EnergyData Book 2005 shows that U.S. marine petroleum demand was approximately 0.43million barrels per day, or <strong>15</strong>7 million barrels per year in 2002, or 8.6 billion gallons ofcrude oil demand for the total domestic U.S. marine sector.16
Figure 2: U.S. Diesel DemandMoving again from the national demand to the U.S. domestic marine detail, vesselbunkering data from the US DOE, show that demand was 2.1 billion gallons in 2004.Note: Vessel bunkering includes sales for the fueling of commercial or private boats,inclusive to oil company vessels but excluding military vessels.Table 3.1: Diesel Consumption: Vessel Bunkering, Sales of Distillate Fuel Oil by EnergyUse in the United States: 20002004 (in thousands of gallons)Distillate Fuel OilEnergy Use 2000 2001 2002 2003 2004U.S. Total 59,601,230 59,911,345 59,342,633 63,854,776 62,257,934Vessel Bunkering 2,261,422 2,044,049 2,078,921 2,216,921 2,139,643Source: DOE EIA http://www.eia.doe.gov/pub/oil_gas/petroleum/datapublications/fuel_oil_and_kerosene_sales/historical/2004/foks_2004.html17
From the U.S. domestic marine sector to the <strong>Great</strong> <strong>Lakes</strong> detail, we see vessel bunkeringdata by <strong>Great</strong> <strong>Lakes</strong> use as almost 170 million gallons in 2004.Table 3.2: Diesel Consumption: Vessel Bunkering, Sales of Distillate Fuel Oil by EnergyUse in the <strong>Great</strong> <strong>Lakes</strong> States: 2004 (in thousands of gallons)Destination Vessel Bunkering 2004 % of <strong>Great</strong> <strong>Lakes</strong>New York 13,296 8%Pennsylvania 22,964 14%Illinois 107,110 63%Indiana 7,289 4%Michigan 8,792 5%Minnesota 5,367 3%Ohio 3,104 2%Wisconsin 1,949 1%<strong>Great</strong> <strong>Lakes</strong> Total 169,871U.S. Total 2,139,643 100%Source: DOE EIAhttp://www.eia.doe.gov/pub/oil_gas/petroleum/data_publications/fuel_oil_and_kerosene_sales/historical/2004/foks_2004.html*Note: these data are used in the impact modeling for Chapter 4.Biodiesel B20 prices increased from $1.23 in July in 2002 to a peak of $2.84 inSeptember 2005. The price came back somewhat in February 2006.Table 3.3: U.S. Biodiesel Prices October 2000to February 2006DatePetroleum Diesel($/gal)Biodiesel B20($/gal)10Oct00 1.443Jul01 1.5622Oct01 1.33 1.4711Feb02 1.13 1.27<strong>15</strong>Apr02 1.31 1.2522Jul02 1.30 1.2328Oct02 1.46 1.6010Feb03 1.65 1.488Dec03 1.45 1.558Mar04 1.59 1.6514Jun04 1.66 1.73<strong>15</strong>Nov04 2.10 2.0921Mar05 2.20 2.18<strong>15</strong>Sep05 2.77 2.8409Feb06 2.56 2.64Source: Biodiesel prices, DOE.gov18
Demand Forecast. Table 3.4 below shows 2005 to 20<strong>15</strong> projected consumption ofhighway diesel and B100 from soybeans and other feedstock. B100 demand is expectedto increase almost ninefold, rising from 75 million gallons in 2005 to 648 million gallonsby 20<strong>15</strong>. It is unlikely that the <strong>Great</strong> <strong>Lakes</strong> maritime industry will experience theseexplosive growth rates, but this is an indication of the expected acceptance of biodieselfuels.HighwayDieselUse /1(Bil gal)Table 3.4: U.S. Diesel Fuel and Biodiesel ForecastB100Volume(Milgal)BiodieselFromSoybeans(Pct)BiodieselFromSoybeans(Mil gal)BiodieselFrom otherFeedstocks(Mil gal)SoybeanOil Equiv /2(Mil lb)SoybeanEquiv /3(Mil Bu)2005 43.2 75.0 91.5% 68.6 6.4 51 462006 44.4 <strong>15</strong>0.0 90.8% 136.1 13.9 1,021 922007 45.5 172.5 90.0% <strong>15</strong>.3 17.3 1,164 1052008 46.4 2<strong>15</strong>.6 89.3% 192.4 23.2 1,443 1302009 47.4 269.5 88.5% 238.5 31.0 1,789 1612010 48.4 323.4 87.8% 283.8 39.6 2,129 1912011 49.4 388.1 87.0% 337.7 50.5 2,533 2272012 50.2 465.8 86.3% 401.7 64.0 3,013 2702013 51.0 535.6 85.5% 457.9 77.7 3,435 3082014 51.6 589.2 84.8% 499.3 89.8 3,745 33620<strong>15</strong> 52.3 648.1 84.0% 544.4 103.7 4,083 367Source: Forecast prepared by LECG, LLC1. Annual Energy Outlook 2006. High Oil Price Case. Table 2.Converted from btu at 138,690 btu/gal2. Converted using 7.5 lb soybean oil = 1 gal biodiesel3. Assumes 11.1 lbs sbo/bu soybeans3.2.2 SupplyFollowing the data for soybean feedstock supply, we compare the <strong>Great</strong> <strong>Lakes</strong> states’ability to supply feedstock for biodiesel production of fuel for maritime commerce. The19962006 production level trend for soybean production and prices for the U.S. is shownbelow. In 2006 production topped 3 billion bushels.Table 3.5: U.S. Soybean Production and Price Trends 19962006Year Area Production (thousands of bushels) Price($ per bushel)1996 U.S. 2,380,274 $7.351997 U.S. 2,688,750 $6.471998 U.S 2,741,014 $4.931999 U.S 2,653,758 $4.632000 U.S 2,757,810 $4.542001 U.S 2,890,682 $4.382002 U.S 2,756,147 $5.532003 U.S 2,453,665 $7.342004 U.S 3,123,686 $5.742005 U.S 3,086,432 $5.502006 U.S 3,092,970Source: USDA National Agricultural Statistics Service19
The detail in the U.S. trend for the <strong>Great</strong> <strong>Lakes</strong> states for 2005 shows the percent of U.S.The eight <strong>Great</strong> <strong>Lakes</strong> states produced 45% of the total U.S. soybean production.Table 3.6: <strong>Great</strong> <strong>Lakes</strong> States Soybean Production and Price Trends 2005Production(thousands ofbushels)Per Cent of Price ($ perYear AreaUS Total bushel)2005 Illinois 439,425 14% $5.502005 Indiana 263,620 9% $5.502005 Michigan 76,6<strong>15</strong> 2% $5.552005 Minnesota 306,000 10% $5.452005 New York 7,896 0% $5.202005 Ohio 201,600 7% $5.552005 Pennsylvania 17,220 1% $5.552005 Wisconsin 69,520 2% $5.502005 Totals 1,381,896 45% $5.48Source: USDA National Agricultural Statistics Service; NASS Data and Statistics Quick Stats.See: www.nass.usda.gov/Data_and_Statistics/Quick_Stats/<strong>Great</strong> <strong>Lakes</strong> states’ maritime commerce consumes about 170 million gallons of dieselfuel. Based on soybean production in 2005 it would take about 9% of the eight states’soybean production to satisfy total demand for converted biodiesel maritime use.Table 3.7: <strong>Great</strong> <strong>Lakes</strong> States Soybean Production and Price Trends 2005 for<strong>Maritime</strong>Possible total gallons Gallons forecast tofrom 2005 soybean achieve states’production contribution to meet 2005(thousands of <strong>Great</strong> <strong>Lakes</strong> maritimeAreagallons)*demandYearProduction(thousands ofbushels)2005 Illinois 439,425 6<strong>15</strong>,195 54,0582005 Indiana 263,620 369,068 32,4302005 Michigan 76,6<strong>15</strong> 107,261 9,4252005 Minnesota 306,000 428,400 37,6442005 New York 7,896 11,054 9712005 Ohio 201,600 282,240 24,8012005 Pennsylvania 17,220 24,108 2,1182005 Wisconsin 69,520 97,328 8,552170,0002005 Totals 1,381,896 1,934,654*According to the US Department of Agriculture's (USDA) Farm Service Agency, one bushel of soybeans yieldsapproximately 1.4 gallons of biodiesel.Source: USDA National Agricultural Statistics Service; NASS Data and Statistics Quick Stats. See:www.nass.usda.gov/Data_and_Statistics/Quick_Stats/; UMD BBER3.2.3 IncentivesFederal Incentives. “The main drivers for increased biodiesel demand will be projectedhigh energy prices and incentives provided by the EPACT05 and individual States. Asindicated earlier, EPACT05 mandates that a minimum of 7.5 billion gallons of renewable20
fuels (ethanol and biodiesel) be used in the nation’s motor fuel by 2012. The legislationprovides other significant incentives, specifically: Extension of the biodiesel tax creditthrough 2008 at one cent per gallon for agribiodiesel and ½ cent per gallon for biodieselfrom other sources such as recycled fats and oils” [34]Table 3.8: U.S. Biodiesel Tax IncentivesBiodiesel Tax CreditCurrent rules: Excise tax credit of $1/gal agribiodiesel & $0.50/galwastebiodiesel owed on federal road taxes. Changes 1/1/06: 1¢/%biodiesel through December 31, 2008. IRS rules on changes havenot been issued yet.Biodiesel Station TaxCreditUp to 30% of the total costs up to $30,000 of B20 (20% biodiesel) orgreater fueling equipment installed as of January 1, 2006 throughDecember 31, 2007. IRS rules have not been issued yet.Source: www.biodiesel.org/news/taxincentive/Table 3.9: U.S. Incentive Program PaymentsFuel Gallons Reported PaymentsQ1 2006 Payment InformationEthanol Increase 178,906,818 $4,257,670Biodiesel Increase 25,909,877 $4,252,737Biodiesel Base 10,206,299 $0Total Biodiesel 36,116,176 $4,252,737Program Total 2<strong>15</strong>,022,994 $8,510,407Second Quarter, Fiscal Year (FY) 2006 Payment InformationEthanol Increase 202,5<strong>15</strong>,048 $4,676,529Biodiesel Increase 29,078,589 $3,834,885Biodiesel Base 6,905,720 $0Total Biodiesel 35,984,309 $3,834,885Program Total 238,499,357 $8,511,414Q3 2006 Payment InformationEthanol Increase 203,970,911 $5,029,630Biodiesel Increase 50,273,774 $4,385,807Biodiesel Base 14,380,439 $0Total Biodiesel 64,654,213 $4,385,807Program Total 268,625,124 $9,4<strong>15</strong>,437Cumulative 2006 Payment InformationEthanol Increase 580,996,189 $13,860,613Biodiesel Increase 103,321,587 $12,165,625Biodiesel Base 32,192,229 $0Total Biodiesel 135,513,816 $12,165,625Program Total 716,510,005 $9,4<strong>15</strong>,43721
Cumulative 2005 Payment InformationEthanol Increase 543,546,642 $65,947,726Biodiesel Increase 50,922,590 $32,022,011Biodiesel Base <strong>15</strong>,263,<strong>15</strong>2 $1,630,945Total Biodiesel 66,185,742 $33,652,956Program Total 609,732,383 $99,600,682US Incentive Bioenergy Program Payments 200506Source: http://www.fsa.usda.gov/FSA/webapp?area=home&subject=coop&topic=paibe05. See Programs and Initiatives; Bioenergy ProgramTable 3.10: <strong>Great</strong> <strong>Lakes</strong> States Biodiesel IncentivesMN WI IL IN MI OH PA NYBiodiesel Use IncentiveYesAFV Acquisition Requirements Yes Yes Yes Yes Yes YesBlend Mandate 2% 2%Alternative Fuel Tax Yes Yes Yes YesAFV Tax Deduction Yes Yes YesEmissions Reduction Requirement Yes YesLEV Acquisition RequirementYesAlternative Fuel Production Incentive Yes YesBiodiesel Blending CreditYesBiodiesel Retailer Credit Yes Yes YesConsumption MandateYesAFV = Alternative FuelVehicleLEV = Low Emission VehicleSource: U.S. DOE Energy Efficiency and Renewable Energy.See: http://www.eere.energy.gov/afdc/laws/incen_laws.html22
Minnesota incentivesTable 3.11: Minnesota Biodiesel MandateBiodiesel Blend Mandate Issue Date Effect Date ExemptionsTwo Bills: H.F. 362 and S.F.326. All diesel fuel sold oroffered for sale in the state foruse in internal combustionengines must contain at least2% biodiesel fuel by volume.2001 30Jun05Source: U.S. DOE Energy Efficiency and Renewable Energy.See: http://www.eere.energy.gov/afdc/laws/incen_laws.htmlJet fuel andaviationfuelConditions to be met for themandateThe state is able to producemore than eight milliongallons of biodiesel fuelannually, or a federal actioncreates a $0.02 per gallon orgreater reduction in the priceof taxable fuel containing atleast 2% biodiesel fuel sold inthe state.3.4.2 RiskThe following two tables highlight a simple SWOT analysis (strengths, weaknesses,opportunities and threats). The tables show both the producers (or suppliers) and theconsumers (endusers). The SWOT analysis is typically used in the development of afeasibility study or business plan, and for marketing plans.Producers:Table 3.12: Producers’ Risk AnalysisStrengths: Weaknesses: Opportunities: Threats:Byproducts fromprocess of producingBiodiesel GlycerinLess dependenceon foreign oilMany new opportunitieswill arrive for alternativefuel producers in thenext couple of years withraising gas pricesThreat of higher upcompanies coming byand stealing businessHigh energymultiplierTax incentivesSource: UMD BBERChemical andengineering skills arerequiredRapidly emerging fuel23
Consumers:Table 3.13: Consumers’ Risk AnalysisStrengths: Weaknesses: Opportunities: Threats:Better lubricity More expensive then Alternative fuel choices Better lubricitypetrodieselConsumerincentivesSource: UMD BBERPoor performance incold temperatures(gelling)Environmentally friendlyHigher pricesFor the general economy of the U.S. (and the <strong>Great</strong> <strong>Lakes</strong> states) the strengths includereduction of dependence on foreign oil supplies, the benefits from reinvesting money inthe U.S. and regional economy, stronger energy yield, and the advantage of net energygain for biodiesel fuel compared to other fuels.Table 3.14: Net Energy Gain (or loss) by FuelFuel Energy Yield Net Energy (loss) or gainGasoline 0.805 (19.5 percent)Diesel 0.843 (<strong>15</strong>.7 percent)Ethanol 1.34 34 percentBiodiesel 3.2 220 percentSource: Energy Balance/Energy Life Cycle InventoryByproducts as market riskGlycerol is a byproduct from the transesterification process used in the formation ofbiodiesel. The glycerol produced during the transesterification process is about 50% pure.You can raise the purity level to 80%90% by adding hydrochloric acid until the crudeglycerol reaches a pH level that is acidic (around 4.5).Market: Glycerol is a very common industrial product. Primary uses for glycerol include:food products, cosmetics, toiletries, toothpaste, explosives, drugs, animal feed,plasticizers, tobacco, and emulsifiers. There are color and odor standards for glycerol.Market pricing is based on glycerol that is 99.7% pureThe glycerol market will most likely become oversaturated in the next two years unlessnew uses for glycerol are discovered.24
Figure 3: Glycerin as Market RiskSource: “Glycerin Glut Sends Prices Plummeting,” Gordon Graff. Seewww.purchasing.com/article/CA6341035.htmlSummary. Volatile production and pricing associated with dynamic changes makemodeling the biodiesel industry challenging. For instance, for business planning, a breakevenanalysis usually calculates a breakeven point based on fixed costs, variable costsper unit of sales, and revenue per unit of sales. Business planning at the level ofindividual enterprise is suggested as further research, and assumptions of perunitrevenue and perunit cost as well as assumption of other fixed costs would be estimatedthrough a detailed sales forecast as well as profit and loss data from the industry. Giventhe aforementioned volatility of this market, as seen in the supply and demand trends inthe foregoing data tables, average sales and costs may not be representative. Analystspredict, however, that costs will come down and prices will rise, making the breakevenpoint a moving target. The variation in feedstock producers, type of feedstock, thepossibility of increased demand from <strong>Great</strong> <strong>Lakes</strong> maritime fleets, “fixed” costs such aslegislated incentives and regulations which can be amended or removed, and thetechnological advances in chemical processing and operations and enduse engineeringcan introduce new variables at any stage of the business model.For the industry sector, it can be assumed that eventually the low cost producers will ableto force the independent producers out of the industry and capture market share. Changesin the industry sector will have impacts for the regional economy. An estimate ofeconomic impacts to the <strong>Great</strong> <strong>Lakes</strong> region from the introduction of more biodieselproduction follows in Chapter 4.25
Chapter 4:Potential Economic ImpactsEconomic Impact Modeling: <strong>Great</strong> <strong>Lakes</strong> Biodiesel Plant4.1 Biodiesel Plant ImpactThe use of biodiesel fuel by <strong>Great</strong> <strong>Lakes</strong> commercial fleets is expected to increase in thefuture. By the end of the decade, the demand for biodiesel could be over 30 milliongallons. Although over 23 million gallons of diesel sales were disclosed by two <strong>Great</strong><strong>Lakes</strong> suppliers for this report, other <strong>Great</strong> <strong>Lakes</strong> producers would not reveal salesvolume. Therefore total <strong>Great</strong> <strong>Lakes</strong> sales or production could not be reported. Howeverit is possible to assume that a new 30 million gallons biodiesel facility could be supportedas the <strong>Great</strong> <strong>Lakes</strong> fleets convert to biodiesel usage. We note from the previous chapter,data show that there was domestic demand for 2.1 billion gallons of distillate fuel oil forvessel bunkering in 2004. How quickly vessels will convert to biodiesel is unknown, butsome of this demand could be supplied by increased biodiesel production. To meet thisincreased demand, a new <strong>Great</strong> <strong>Lakes</strong> Biodiesel Plant, of typical production capacity of30 million gallons per year, should be feasible. Our assumptions as inputs to these modelsare constrained to projections for commercial maritime diesel consumption.The following <strong>Great</strong> <strong>Lakes</strong> Biodiesel Plant is modeled to be a 30 million gallonproduction facility with a construction cost of $30.98 million. This study is not sitespecificin that the findings are for a facility that can be located anywhere in the eightstate<strong>Great</strong> <strong>Lakes</strong> Region. There would be 37 workers employed at full capacityoperations. These economic model specifications were selected to be conservative andwell under estimated market demand. In reality, sales should be able to supportadditional <strong>Great</strong> <strong>Lakes</strong> plants to feed the expanding maritime demand. The economicimpacts presented in this report are for a single plant.The UMD Labovitz School research bureau (Bureau of Business and Economic<strong>Research</strong>) worked with biodiesel industry contacts in determining key assumptions in thedevelopment of the economic impact model. Regional and state data for the impactmodel for Value Added, Employment, and Output is supplied by IMPLAN. [35] Fromthese data, Social Accounts, Production, Absorption, and Byproducts information aregenerated from the national level data and incorporated into the model.The Study Area. This report measured the economic impact of a <strong>Great</strong> <strong>Lakes</strong> BiodieselPlant on the eightstate <strong>Great</strong> <strong>Lakes</strong> region. The study area includes the states ofMinnesota, Wisconsin, Michigan, Ohio, Illinois, Indiana, Pennsylvania and New York.26
Figure 4: <strong>Great</strong> <strong>Lakes</strong> Region IMPLAN model informationNote: The most recent data available for modeling is year 2003. IMPLAN model deflators were used toreport 2005 impacts.Figure 5: <strong>Great</strong> <strong>Lakes</strong> Study area including Illinois, Indiana, Michigan, New York, Ohio,Pennsylvania, Wisconsin, and Minnesota.Source:www.amaps.com/, by permission.Impact Procedures and Input Assumptions. There are two components to theIMPLAN system, the software and databases. The databases provide all information tocreate regional IMPLAN models. The software performs the calculations and providesan interface for the user to make final demand changes.27
Comprehensive and detailed data coverage of the IMPLAN study areas by county, andthe ability to incorporate usersupplied data at each stage of the model building process,provides a high degree of flexibility both in terms of geographic coverage and modelformulation, in this case definition of the State of Minnesota and the eightstate <strong>Great</strong><strong>Lakes</strong> Region study areas, and the definition of specific models for construction andoperations. Using the IMPLAN software and data, BBER identified <strong>Great</strong> <strong>Lakes</strong>Biodiesel Plant’s expenditures in terms of the sectoring scheme for the model, inproducer prices, in historical dollars based on the year of the model, and applied thosedollars spent within the two study area definitions given for the impact analysis.Data:IMPLAN data files use federal government data sources including:· US Bureau of Economic Analysis Benchmark I/O Accounts of the US· US Bureau of Economic Analysis Output Estimates· US Bureau of Economic Analysis REIS Program· US Bureau of Labor Statistics County Employment and Wages (CEW)Program· US Bureau of Labor Statistics Consumer Expenditure Survey· US Census Bureau County Business Patterns· US Census Bureau Decennial Census and Population Surveys· US Census Bureau Economic Censuses and Surveys· US Department of Agriculture Crop and Livestock StatisticsIMPLAN data files consist of the following components: employment, industryoutput, value added, institutional demands, national structural matrices andinterinstitutional transfers.Impacts for these models use the most recent IMPLAN data available which is for theyear 2003. The impact is reported in 2005 dollars, calculated with the builtindeflators of the modeling software.Economic impacts are made up of direct, indirect, and induced impacts. Thefollowing cautions are suggested assumptions for accepting the impact model:• IMPLAN inputoutput is a production based model• Local or export based purchases that represent transfers from other potentiallocal purchases are not counted.• The numbers (from U.S. Department of Commerce secondary data) treat bothfull and part time individuals as being employed.• Assumptions need to be made concerning the nature of the local economybefore impacts can be interpreted.• The IMPLAN model was constructed for the year 2003 (most recent dataavailable). 2005 dollars are estimated by the model.28
Definitions used in this report:Measures• Gross Output represents the value of local production required to sustainactivities.• Value Added is a measure of the impacting industry’s contribution to thelocal community; it includes wages, rents, interest and profits.• Employment estimates are in terms of jobs, not in terms of fulltimeequivalent employees. Hence, these may be temporary, part time or shortterm jobs.Effects• Direct – Initial new spending in the study area resulting from the project• Indirect – The additional interindustry spending from the direct impact• Induced – The impact of additional household expenditure resulting fromthe direct and indirect impact.Inputs provided for modeling the impact of the <strong>Great</strong> <strong>Lakes</strong> Biodiesel PlantBBER modeled key assumptions to estimated expenditures for the proposed plant.ConstructionMaterials: For the construction impact, BBER estimates the construction periodis 18 months. Construction costs are estimated to be $20,654,014 for Year 1and $10,327,007 in Year 2. For these dollars, percent of the total cost formaterials, and the percent the eightstate region could supply of products andservices for the project.Labor: Costs for the 18 month timeline. IMPLAN model’s estimates of wagerates and output per workers are used for labor costs.OperationsFor the operations impact, BBER provided estimates for such components asstaffing and labor cost per year. BBER also projected the annual total output ofthe plant.Industry sector adjustmentsNAICS industry sector 311225 Fats and Oils Refining and Blending (IMPLANsector 54) was used to model the potential <strong>Great</strong> <strong>Lakes</strong> Biodiesel Plant.Production functions addressed in the gross absorption tables for the industrialsectors of the inputoutput modeling were adjusted to reflect estimates for the<strong>Great</strong> <strong>Lakes</strong> Biodiesel Plant construction and operations demand changes.Benchmark (economic base) and impact (additional plant) models wereconstructed for the regional eightstate economy.29
EmploymentIMPLAN measures of direct, indirect, and induced employment follow fromassumptions in the model concerning the estimation of permanent, temporary, andparttime employment.InflationThe most recent IMPLAN data available for modeling these impacts are forindustry sectors in the year 2003. To more accurately represent costs and impacts2003 impacts were then inflated to show 2005 dollars in the tables of this report,using the industry specific deflators from the IMPLAN model.4.2 Findings: Construction Impacts and Operations ImpactsThe following tables use the estimated values of <strong>Great</strong> <strong>Lakes</strong> Biodiesel Plant’s directexpenditures on the <strong>Great</strong> <strong>Lakes</strong> Region as the original input for the model. Directexpenditures are listed in the column labeled, “Direct Effect.” “Indirect Effect” measuresthe amount of increased spending between commercial, government and serviceindustries, and “Induced Effect” measures the amount of increased spending byresidential households. “Total Effect” is the sum of Direct, Indirect, and Induced Effects.None of the tables that show <strong>Great</strong> <strong>Lakes</strong> Biodiesel Plant’s yearly employment impactsadd the total number of jobscreated across all 18 months of construction. AlthoughIMPLAN required that each calendar year of construction be modeled as a separate event,each job created by construction activity may carry through all calendar years as the samejob, and could thus be counted more than once. (For instance, the engineers, projectmanagers, and installers that <strong>Great</strong> <strong>Lakes</strong> Biodiesel Plant will employ for Year 1 mightstill be employed by <strong>Great</strong> <strong>Lakes</strong> Biodiesel Plant in Year 2.)Construction. Table 4.1 summarizes thetotal effects of <strong>Great</strong> <strong>Lakes</strong> BiodieselPlant’s direct construction expenditures.The column on the right (labeled “OutputTotals”) shows that <strong>Great</strong> <strong>Lakes</strong> BiodieselPlant’s overall construction expenditure of$30.98 million (direct effect) is calculatedTable 4.1: Summary<strong>Great</strong> <strong>Lakes</strong> Biodiesel Plant Construction Impacts Year 1 and 2(2005 Dollars)to create an additional $34.5 million (indirect and induced effects) in further spending—resulting in economic activity totaling $64.5 million. The column on the left (labeled“Value Added Totals”) measures the economic impact of the $14.3 million that the <strong>Great</strong><strong>Lakes</strong> Biodiesel Plant is expected to use to pay for wages, rents, interest, and profits, andis estimated to result in an additional $19.7 million in commercial, government, servicesand consumer spending for a total of $33.9 million. The column in the center (labeled“Employment Totals”) shows the total number of jobs that <strong>Great</strong> <strong>Lakes</strong> Biodiesel Plantwill create in the <strong>Great</strong> <strong>Lakes</strong> Region by directly employing construction workers. TheYearsValue AddedTotals $EmploymentTotals Output Totals $Year 1 $22,606,772 365 $43,003,008Year 2 $11,303,386 182 $21,501,504Total $33,910,<strong>15</strong>8 N/A $64,504,51330
column shows that in Year 1 of construction, the <strong>Great</strong> <strong>Lakes</strong> Biodiesel Plant, which isexpected to directly employ nearly 172 workers for construction projects, will result inthe creation a total of nearly 365 jobs in the Region. In Year 2 the plant is expected todirectly employ almost 86 workers for construction projects, which will result in thecreation of more than 182 jobs in the region.Table 4.2 shows the detailed impact of <strong>Great</strong> <strong>Lakes</strong> Biodiesel Plant’s constructionexpenditures on the eightstate <strong>Great</strong> <strong>Lakes</strong> Region, over the 18 months of constructionrequired to build <strong>Great</strong> <strong>Lakes</strong> Biodiesel Plant. As Table 4.2 illustrates, <strong>Great</strong> <strong>Lakes</strong>Biodiesel Plant expects to directly spend a total of $14.3 million on wages, rents, interest,and profits, which in turn will generate an additional $19.6 million in further spending(for a total of $33.9 million). Dividing total value added impact ($33.9 million) by directexpenditures ($14.3 million) results in a valueadded multiplier of 2.37. This means thatfor each dollar that <strong>Great</strong> <strong>Lakes</strong> Biodiesel Plant expends on wages, rents, interest, andprofits related to construction, the economy will spend another $1.37.Table 4.2: Value Added Impact from Construction, <strong>Great</strong> <strong>Lakes</strong> Region (2005 dollars)Year Direct Effect Indirect Effect Induced Effect Total Effect1 $9,5<strong>15</strong>,959 $5,646,003 $7,444,810 $22,606,7722 4,757,980 2,823,002 3,722,405 11,303,386Total $14,273,939 $8,469,005 $11,167,2<strong>15</strong> $33,910,<strong>15</strong>8Table 4.3 shows the economic impact of <strong>Great</strong> <strong>Lakes</strong> Biodiesel Plant’s total outputexpenditures over two years of construction. Based on directexpenditures of $30.9million, <strong>Great</strong> <strong>Lakes</strong> Biodiesel Plant is expected to create $33.5 million in furtherspending activity in the region. The ratio of Total Effect to Direct Effect ($64.5 millionto $30.9 million) gives us an output multiplier of 2.08 for the region.Table 4.3: Output, Impact from Construction, <strong>Great</strong> <strong>Lakes</strong> Region (2005 dollars)Year Direct Effect Indirect Effect Induced Effect Total Effect1 $20,654,014 $9,989,732 $12,359,263 $43,003,0082 10,327,007 4,994,866 6,179,631 21,501,504Total $30,981,021 $14,984,598 $18,538,894 $64,504,513Table 4.4 shows the <strong>Great</strong> <strong>Lakes</strong> Biodiesel Plant’s impact on employment in the eightstate<strong>Great</strong> <strong>Lakes</strong> Region, over the 18 months of plant construction. This table showsthat every job that <strong>Great</strong> <strong>Lakes</strong> Biodiesel Plant creates during the construction period willresult in the creation of additional jobs. Table 4.4 shows that the plant will createroughly 172 fulltime, parttime, and temporary jobs during Year 1, which in turn willcause the creation of 193 jobs throughout other sectors. In Year 2 the <strong>Great</strong> <strong>Lakes</strong>Biodiesel Plant will create 86 new direct jobs and another 96 jobs will be created in theother sectors of the regional economy.31
Table 4.4: Employment, Impact from Construction, <strong>Great</strong> <strong>Lakes</strong> Region, Year 1, Year 2Year Direct Effect Indirect Effect Induced Effect Total Effect1 172 80 113 3652 86 40 56 182Note: Employment impacts from construction cannot be summed for a total over the two yearconstruction period.(Note: Although each year of construction must be modeled as a separate event, each jobcreated by construction activity can carry through all years, as the same job. For instance,engineers, project managers, and installers for year 1 can be in the same job in year 2.)The following table, Table 4.5shows the employment impacts from construction for the<strong>Great</strong> <strong>Lakes</strong> Region comparing the two years of the construction period. Jobs are rankedby industry sector.Source: IMPLANTable 4.5:, Employment Impacts from the <strong>Great</strong> <strong>Lakes</strong> Biodiesel Plant Construction,<strong>Great</strong> <strong>Lakes</strong> Region, Construction Year 1 and Year 2, by Industry SectorYEAR 1 Jobs YEAR 2 JobsOther new construction 171.6 Other new construction 85.8Architectural and engineering services 19.5 Architectural and engineering services 9.8Food services and drinking places 14.3 Food services and drinking places 7.2Employment services 10.8 Employment services 5.4Wholesale trade 9.4 Wholesale trade 4.7Hospitals 5.7 Hospitals 2.8Offices of physicians dentists and otherhealth 5.5 Offices of physicians dentists and other health 2.7Food and beverage stores 5.4 Food and beverage stores 2.7General merchandise stores 5.0 General merchandise stores 2.5Automotive repair and maintenance exceptAutomotive repair and maintenance except carcar wash 4.4 wash 2.2Real estate 4.2 Real estate 2.1Services to buildings and dwellings 3.7 Services to buildings and dwellings 1.9Nursing and residential care facilities 3.6 Nursing and residential care facilities 1.8Motor vehicle and parts dealers 3.4 Motor vehicle and parts dealers 1.7Social assistance except child day careservices 3.0 Social assistance except child day care services 1.5Miscellaneous store retailers 2.8 Miscellaneous store retailers 1.4Truck transportation 2.8 Truck transportation 1.4Insurance carriers 2.6 Insurance carriers 1.3Private households 2.6 Private households 1.3Nonstore retailers 2.4 Nonstore retailers 1.2Clothing and clothing accessories stores 2.4 Clothing and clothing accessories stores 1.2Religious organizations 2.3 Religious organizations 1.2Building material and garden supply stores 2.2 Building material and garden supply stores 1.132
Operations. Tables below show the economic effects that the <strong>Great</strong> <strong>Lakes</strong> BiodieselPlant is expected to have on the <strong>Great</strong> <strong>Lakes</strong> Region during a typical year of operations.It is important to note that unlike the effects of <strong>Great</strong> <strong>Lakes</strong> Biodiesel Plant’s constructionexpenditures, which are singular, this report assumes that the region will reap the benefitsof the plant’s typicalyear operationsexpenditures annually for the life ofthe plant. The detailed operationsimpact findings below are reported forthe study area, for the typical year, bymeasure, and by effect.YearsTable 4.6: Summary<strong>Great</strong> <strong>Lakes</strong> Biodiesel Plant Operations ImpactsTypical Year (2005 Dollars)Value AddedTotals $EmploymentTotals Output Totals $Typical $20,187,559 231 $79,035,226Table 4.6 Summary shows the total economic effects of <strong>Great</strong> <strong>Lakes</strong> Biodiesel Plant’sdirect expenditures for operations on the <strong>Great</strong> <strong>Lakes</strong> Region. The rightmost column(labeled “Output Totals”) displays the economic effects that the plant’s total expendituresfor operations are expected to have on the region. In a typical year, the plant is expectedto directly spend $48.4 million for operations, thereby generating a total of $79 million ineconomic activity across the region. The leftmost column (labeled “Value AddedTotals”) shows the economic impact of the money that <strong>Great</strong> <strong>Lakes</strong> Biodiesel Plantexpects to specifically use to pay for wages, rents, interest, and profits related tooperations. During a typical year, it is predicted that the plant will directly expend $5.3million to meet these costs, which should result in total spending of $20 million. Thecenter column (labeled “Employment Totals”) measures the number of jobs that <strong>Great</strong><strong>Lakes</strong> Biodiesel Plant is likely to indirectly create by directly creating jobs in operations.Over a typical year, the plant is likely to employ 37 workers in operations, which shouldresult in the creation of nearly 231 jobs in total across the Region.Table 4.7 shows the detailed Value Added, Output, and Employment impacts for atypical year from operations activity related to the project. The Table shows that in atypical year, the plant is expected to directly spend around $5.3 million in value addedexpenditures, which should create a total of over $20 million in spending in the region.Table 4.7: Impact from Operations, <strong>Great</strong> <strong>Lakes</strong> (2005 dollars)Direct Effect Indirect Effect Induced Effect Total EffectValue Added $5,290,991 $9,988,629 $4,907,939 $20,187,559Output $48,409,100 $22,478,363 $8,147,766 $79,035,226Employment 37 120 74 231As illustrated by Table 4.7, the plant is expected to spend almost $48.5 million foroperations in a typical year, which should result in a total of $79 million in spendingregionwide. The economic multiplier is 1.63 ($79 million to $48.5 million).Table 4.7 also shows the multiplier effect for employment, where the 37 directemployment jobs create related jobs in the larger economy totaling 194, and a total addedemployment in the region of 231. The following table, Table 4.8 shows Employmentimpacts from Operations for the <strong>Great</strong> <strong>Lakes</strong> Region broken out by industry sector. Totaljobs are ranked by industry sector employment for the typical year.33
Table 4.8: Employment Impacts from the <strong>Great</strong> <strong>Lakes</strong> Biodiesel Plant,<strong>Great</strong> <strong>Lakes</strong> Region Operations, Total Effect Ranked by Industry SectorIMPLAN SECTOR Direct Effect Indirect Effect Induced Total EffectFats and oils refining and blending 36.9 0.3 0.0 37.2Wholesale trade 0.0 16.8 2.2 19.0Truck transportation 0.0 <strong>15</strong>.8 0.5 16.3Food services and drinking places 0.0 3.4 7.1 10.5Oilseed farming 0.0 6.1 0.0 6.1Employment services 0.0 3.1 0.9 4.0Real estate 0.0 1.9 1.7 3.5Management of companies and enterprises 0.0 2.9 0.3 3.3Automotive repair and maintenance except car wash 0.0 1.8 1.4 3.2Hospitals 0.0 0.0 2.9 2.9Food and beverage stores 0.0 0.7 2.1 2.8Offices of physicians dentists and other health 0.0 0.0 2.8 2.8General merchandise stores 0.0 0.6 2.0 2.6Monetary authorities and depository credit 0.0 1.5 0.6 2.2Plastics plumbing fixtures and all other plastics 0.0 2.1 0.1 2.1Nursing and residential care facilities 0.0 0.0 2.1 2.1Rail transportation 0.0 2.0 0.0 2.1Motor vehicle and parts dealers 0.0 0.5 1.5 2.0Services to buildings and dwellings 0.0 1.3 0.6 1.9Social assistance except child day care services 0.0 0.0 1.7 1.74.3 ConclusionsThis chapter applies an economic multiplier analysis and input/output model that wascreated in Minnesota by the Minnesota IMPLAN Group, Inc., and is used by other stategovernments and the USDA Forest Service, among others.This economic analysis from the UMD Labovitz School’s research bureau reports modelsfor a <strong>Great</strong> <strong>Lakes</strong> Biodiesel production plant’s direct effects, plus the additional spendingeffects that could be expected in the greater economy of the <strong>Great</strong> <strong>Lakes</strong> States.With the completion of the construction phase it is estimated that the biodisel plantproject will have spent a total of approximately $33.9 on construction, and that theBiodiesel Plant Project will have generated $64.5 million in spending across the <strong>Great</strong><strong>Lakes</strong> Region over two years. The Value Added economic impact of the $14.3 millionin expenditures for construction are expected to produce an impact of a total of $33.9million for region. In Year 1 of construction, the <strong>Great</strong> <strong>Lakes</strong> Biodiesel Plant is expectedto directly employ 172 workers for construction projects, which will result in the creationof 365 jobs in the Region. In Year 2 the plant is expected to directly employ 86 workersfor construction projects, which will result in the creation of 182 jobs in the region.34
When operations for the biodiesel plant reach typical year capacity, it is estimated togenerate $48.4 million in direct spending across the <strong>Great</strong> Lake states. The indirectspending adds $22.5 million and $8.1 million (in induced spending). The total $79million in new expenditures occurs annually for the life of the facility. During a typicalyear of operations, <strong>Great</strong> <strong>Lakes</strong> Biodiesel Plant will create over 194 fulltime, parttime,and temporary jobs by directly employing nearly 37 people.Special Considerations. Special considerations for interpreting these impact numbers:Regional indirect and induced effects are driven by assumptions in the model. Oneproblem is that the assumptions can mask the true multiplier. This is especially true of theassumption of constant returns to scale: This assumption most affects induced effects andsays that if I drink coffee, and my income increases, I will drink proportionally more thanbefore. The amount of weight placed on the induced effects (the percentage of the totalinduced effect you would want to use) can be further analyzed with an indepth impactstudy, involving much more specific data collection and more detailed analysis.Construction costs may be larger due to commodity prices, banker’s fees, and interestpayments. Any differences would affect the estimates given here.Readers are also encouraged to remember the BBER was asked to supply an economicimpact analysis only. Any subsequent policy recommendations should be based on the“big picture” of total impact. A cost benefit analysis would be needed to assess theenvironmental, social, and governmental impacts.4.4 Impact ComparisonsThe comparison impacts provided in Table 4.9 show estimates for the impact of the <strong>Great</strong><strong>Lakes</strong> Biodiesel Plant construction and operations on the U.S. as a whole, and the <strong>Great</strong><strong>Lakes</strong> Region as discussed above.Table 4.9: <strong>Great</strong> <strong>Lakes</strong> Biodiesel Plant Construction Totals Impact Comparisons, U.S., <strong>Great</strong><strong>Lakes</strong> Region (2005 dollars); Year 1, Year 2Source: IMPLANYear 1 2 TotalUnitedStates<strong>Great</strong><strong>Lakes</strong>Value Added Totals $33,169,760 $16,809,880 $49,979,640Employment Totals 529 265 NAOutput Totals $65,410,434 $32,705,217 $98,1<strong>15</strong>,651Value Added Totals $22,606,772 $11,303,386 $33,910,<strong>15</strong>8Employment Totals 365 182 NAOutput Totals $43,003,008 $21,501,504 $64,504,513Table 4.10: <strong>Great</strong> <strong>Lakes</strong> Biodiesel Plant Operation Totals Impact Comparisons, U.S.,<strong>Great</strong> <strong>Lakes</strong> Region (2005 dollars); Typical YearSource: IMPLAN Value Added Employment OutputUnited States $61,545,932 845 $181,918,066<strong>Great</strong> <strong>Lakes</strong> $20,187,559 231 $79,035,22635
Chapter 5: Conclusions and RecommendationsChemical and Mechanical Engineering conclusionsWe investigated use of transesterified vegetable oils – biodiesel – as an alternative fuelfor marine vessels. The project goals were to determine technical and economic viabilityof using biodiesel, investigate cheaper ways to produce it, and study engine performanceusing biodiesel. In addition, we studied the possibility of using fuel cells to enhance theenergy efficiency of biodiesel and to reduce the adverse impact of ships to the marineenvironment.Our investigation has led to the following findings:1. Technically, biodiesel production has become routine. A continuous,economically efficient, production process is used by all the large volumeproducers. Smaller producers use batch reactors that allow flexibility in operationand use of raw materials. Unfortunately, like any other agribased energy source,biodiesel requires some form of federal or state subsidy to be competitive withpetroleum based fuel. Minnesota State Statute 239.77, which was adopted onMarch <strong>15</strong> th , 2002, mandates 2% biodiesel fuel by volume in all diesel fuel sold oroffered in Minnesota. The mandate officially took effect on September 30 th ,2005, when sufficient biodiesel production within the state of Minnesota wasavailable to support the mandate.2. An enzyme – lipase – can be used as a catalyst in the production process insteadof the usual catalyst, NaOH. Although more expensive, lipase holds the promiseof faster reaction rate and more economic biodiesel production. An approach tofurther investigate this enzymatic production of biodiesel is outlined in the reportbody.3. Our study also indicates that although shipboard use of fuel cells using biodieselis energy efficient and environment friendly, but would be capital intensive andhighly unlikely to be economical.4. The use of biodiesel blends in diesel engines lowers overall engine emissionswhen compared to petroleumbased diesel. In addition, biodiesel is a renewableenergy source, has better lubricity than diesel fuel, is nontoxic and biodegradesfaster than diesel fuel, and can be used in current diesel engines with little or nomodification. Environmental concerns, legislative measures, and continuedresearch into improved methods of producing biodiesel are among the manyfactors contributing to the increased use of biodiesel. Both legislative andindustrial efforts point to the use of up to 20% biodiesel blends (B20) in the nearfuture.5. The tendency of biodiesel to act as a solvent and its higher cold flow propertiescan lead to problems during operation. Individual ship systems should bereviewed to identify potential cold weather and material compatibility problemsprior to the adoption of high biodiesel content blends as a fuel. There is apotential for fuel gelling problems in <strong>Great</strong> <strong>Lakes</strong> vessels over the winter lay upperiod due to longterm (2 month) storage of biodiesel blends at lowtemperatures. The development of a longterm lowtemperature storage test to36
verify that separation of the blend and preferential gelling of the biodieselcomponent does not occur is recommended.Economic analysis conclusionsVolatile production and pricing associated with dynamic changes make modeling thebiodiesel industry challenging. For instance, for business planning, a breakeven analysisusually calculates a breakeven point based on fixed costs, variable costs per unit of sales,and revenue per unit of sales. Business planning at the level of individual enterprise issuggested as further research, and assumptions of perunit revenue and perunit cost aswell as assumption of other fixed costs would be estimated through a detailed salesforecast as well as profit and loss data from the industry. Given the aforementionedvolatility of this market, as seen in the supply and demand trends in the foregoing datatables, average sales and costs may not be representative. Analysts predict, however, thatcosts will come down and prices will rise, making the breakeven point a moving target.The variation in feedstock producers, type of feedstock, the possibility of increaseddemand from <strong>Great</strong> <strong>Lakes</strong> maritime fleets, “fixed” costs such as legislated incentives andregulations which can be amended or removed, and the technological advances inchemical processing and operations and enduse engineering can introduce new variablesat any stage of the business model.For the industry sector, it can be assumed that eventually the low cost producers will beable to force the independent producers out of the industry and capture market share.Changes in the industry sector will have impacts for the regional economy. An estimateof economic impacts to the <strong>Great</strong> <strong>Lakes</strong> region from the introduction of more biodieselproduction follows in Chapter 4.Economic analysis recommendationsThe environmental and economic challenge driving the presentation of alternative fuelsfor the <strong>Great</strong> <strong>Lakes</strong> maritime fleet includes consideration of strategies not part of thescope of this analysis. Discussion of these strategies often starts with consideration ofcarbon credit trading for maritime biodiesel fuel alternatives and further research isrecommended. Carbon credits, as a business asset, are one choice among many for fuelconsumers to consider when planning for regulation compliance. Carbon credit trading ispart of a larger incentive approach. The market gives consumers the opportunity tochoose the most efficient means for reducing their carbon emissions. Benefit costanalysis presents a range of other compliance strategies, in some cases choices moreefficient (less expensive, more productive) than mandating change to biodiesel fuel.This research includes: review of the economics of emissions regulation strategies (ofwhich carbon credit trading is one); study of appropriate caps on emissions levels;quantifying the variety of incentives that encourage consumer compliance with regulatorycaps; and comparing economic benefit and cost to various stakeholders.37
Studying incentives for fuel emissions regulation compliance can include:1) Biodiesel incentives: demand and supply analysis (as in this report); feasibility orcost comparisons for implementing emerging marine designs; differences in total costsstructure; incentive for adopting new technology, early adopters and newerinfrastructure/vessels gain the most, aged vessels encouraged attrition.2) Application of “textbook” models already in the literature such as: S0 2 program;successfully regulates the sulfur emissions in the power generation market; noteproducers choose to cut compliance cost by changing inputs – switching to low sulfurcoal – rather than install costly technology i.e. “scrubbers”.Types of economic regulation currently part of this kind of benefit cost analysis:Permits (including how permits are business assets, and can be flexible); Standards;Credits; TBE standards (technology based emission).In short, the economics of studying how carbon credits might work in the businesseconomy of <strong>Great</strong> <strong>Lakes</strong> carriers requires an approach broader than the narrow focus onone strategy – for instance, carbon credit trading. Economics of the market makeresearchers cautious about dictating a change to a new technology (for instancemandating the use of biodiesel fuel in marine vessels) as this kind of strategy has beenshown to be more expensive and less productive for capping emissions. It is best to letthe consumer figure out what will get the greatest compliance for the least money. Thebiodiesel alternative is presented as one choice.FischerTropes? “Diesel is going to be very different in the future. It will be highlyrefined or will be a gastoliquid procedure like Fisher Tropes that will take the sulfur outall together,” according to Dr. Roberta Nichols, retired from Ford Motor Company andAlternative Fuel Consultant, Speaking on "Gasoline Today: Which Fuels Will You SellTomorrow?" At The ColoradoWyoming Petroleum Marketers Association Conventionand Trade Show Jackson Hole, Wyoming August 2124, 1999“FischerTropes technology produces synthetic diesel fuel that is almost miraculous. Theproblem with Fischer Tropes diesel is it has a low lubricity factor, causing wear and tearon the equipment. That is solved by blending it with biodiesel. A 5 to 7 percent of blendbiodiesel solves the cetene problem,” [as identified at the 23rd Annual Wyoming ForumWyoming Business Alliance/Wyoming Heritage Foundation “Infrastructure in Wyoming:Bucking the Tide or Directing the Future?”November 1718, 2005 – Casper’s ParkwayPlaza]:“Now, one thing that was skipped here is that there is a possibility to use coal byconverting it to syngas, a mixture of C0 and H2, that is then fed to a FischerTropes Catalyst. This allows the generation of, in the crudest form, of a syntheticcrude oil. Fischer used this technology in World War II to help keep the Nazi warmachine running. (Sadly he was a true believer and destroyed much of hisresearch so the Allies wouldn't get it.) Back when I [was] in graduate school, it38
was considered the hot topic, very much like nanotechnology is today. Theemphasis was to get away from making synthetic crude and design catalysts tomake specific ranges of molecules. The neat thing is Fischer used coal and wehave lots of that in untapped reserves that, at current efficiencies, would lastcenturies. Especially if the car fuels and heating energy came from other sources.”http://www.technogypsy.net/May2005.htmPossible work plan for analysis of emission control for <strong>Great</strong> <strong>Lakes</strong> vessels mightinclude:- Identification/quantification of total emissions of selected pollutants (CO 2 ,CO,PM, NO X , HC, etc.)- Application of BenefitCost Analysis to establish total emission targets for eachpollutant- Costeffectiveness Analysis of various types of economic regulations to attainemission targets- Establishment of TDP markets- Impact on emissions and the shipping industryDetails of this work plan might include:1) Estimation of total current emissions- Emissions per source (vessel)- Number of sources- Future projections2) Establishing total emission targets- Benefits (improved environmental quality)- Costs (abatement, compliance, enforcement)3) Types of economic regulation of emissions:- TBES (TechnologyBased Emission Standards)- CAC standards (CommandAndControl standards)- Emission Charges/Taxes- TDP (Tradable/Transferable Discharge Permits/credits)4) Establishment of tradable discharge permit markets- Total emission target- Distribution of permit/credits (historical, auction, etc.)- Trading mechanisms- Examples of “CapAndTrade” Programs (CAP):o SO 2 emissions (1990 Clean Air Act Amendments)o NO X emissions (Ozone Transport Committee)o VOM (Volatile Organic Material) emissions (Chicago)5) Impacts of emission control39
- Emissions reduction/improvement in environmental quality- Cost to shipping industry- Incentives created (new technologies including the use of biodiesel fuel/engines)40
ReferencesChapter 1No referencesChapter 2[1] ASTM D 6751, Standard Specification for Biodiesel Fuel (B100) Blend Stock for Distillate Fuels,ASTM International.[2] Tickell, Joshua, From the Fryer to the Fuel Tank: The Complete Guide to Using VegetableOil asan Alternative Fuel, Joshua Tickell Media Productions, 2003.[3] ASTM D 975, Standard Specification for Diesel Fuel Oils, ASTM International.[4] ASTM D 2274, Standard Test Method for Distillate Fuel Storage Stability (Accelerated Method),ASTM International.[5] ASTM D 4625, Standard Test Method for Distillate Fuel Storage Stability at 43°C (110°F),ASTM International.[6] ASTM D 6468, Standard Test Method for High Temperature Stability of Distillate Fuels, ASTMInternational.[7] Characterization of Biodiesel Oxidation and Oxidation Products, J. A. Waynick, NationalRenewable Energy Laboratory, NREL/TP54039096, November, 2005,http://www.nrel.gov/vehiclesandfuels/npbf/pdfs/39096.pdf.[8] An Evaluation and Comparison of Test Methods to Measure the Oxidation Stability of NeatBiodiesel, S. R. Westbrook, National Renewable Energy Laboratory subcontract report,NREL/SR54038983, November, 2005, http://www.nrel.gov/docs/fy06osti/38983.pdf.[9] ASTM WK 7852, New Standard Specification for Diesel Fuel Oil, Biodiesel Blend (B20), DraftUnder Development, ASTM International.[10] National Biodiesel Board (Internet), Commercial Biodiesel Production Plants, September 2006(cited September 2006),http://www.biodiesel.org/buyingbiodiesel/producers_marketers/ProducersMapExisting.pdf[11] Minnesota Soybean Processors (Internet), Homepage, September 2006 (cited September 2006),http://www.mnsoy.com/[12] SoyMor Cooperative (Internet), Homepage, September 2006 (cited September 2006),http://www.soymor.com/[13] Farmers Union Marketing and Processing Association (Internet), Homepage, September 2006(cited September 2006), http://www.fumpa.com/[14] Flint Hills Resources (Internet), Minnesota Refining Home, September 2006 (cited September2006), http://www.fhr.com/minnesota/[<strong>15</strong>] Murphy Oil Corporation (Internet), Product Supply, September 2006 (cited September 2006),http://www.murphyoilcorp.com/rm/productsupply/[16] EPA Renewable Fuel Standard Requirements, 40 CFR, Pt. 80, 2006 ed., pp. 120104.41
[17] U.S. Environmental Protection Agency (Internet), National Clean Diesel Campaign, September2006 (cited September 2006), http://www.epa.gov/cleandiesel/[18] U.S. Environmental Protection Agency (Internet), Clean Ports USA, September 2006 (citedSeptember 2006), http://www.epa.gov/cleandiesel/ports/[19] J. S. Agarwal, H. D. Chowdury, S. N. Mukerji, and L. C. Vermoh, “Indian Vegetable Oil as Fuelsfor Diesel Engines”, Bulletin of Indian Industrial <strong>Research</strong>, No. 19, 1952.[20] Sunflower Oil Methyl Ester as a Diesel Fuel, D. J. Hassett and A. R. Hasan, University of NorthDakota Eng. Expt. Station, (Bulletin 8305EES03, Grand Forks, ND, 1983).[21] Biodiesel: The Future of Alternative Fuels, C. Haley, T. Kramer, M. Johnson, and H. Pardawalla,Chemical Engineering Department, University of Minnesota Duluth, ( Senior Design Report, May,2004).[22] Yuanyuan Xu, Wei Du, Dehua Lui, and Jing Zeng. “A novel enzymatic route for biodieselproduction from renewable oils in a solventfree medium”, Biotechnology Letters, vol. 25,(2003),12391242.[23] Hydrogen Generation from BiomassDerived Compounds Utilizing AqueousPhase Reforming, R.Cortright, Virent Energy Systems, Inc., (Virent Energy Systems, Inc., Madison WI., 2004).[24] 2004 Virent Executive Summary, Supplied by Mohammad Farooque, Fuel Cell Energy,November, 2005.[25] National Biodiesel Board (Internet), National Biodiesel Board Homepage, September 2006 (citedSeptember 2006), http://www.biodiesel.org/[26] U.S. Environmental Protection Agency, Office of Transportation and Air Quality (Internet),Bibliography of Biodiesel Studies, September 2001 (cited September 2006),http://www.epa.gov/otaq/models/analysis/biodsl/bibliog.pdf[27] C.D. Rakopoulos, K.A. Antonopoulos, D.C. Rakopoulos, D.T. Hountalas, and E.G. Giakoumis,“Comparative performance and emissions study of a direct injection Diesel engine using blends ofDiesel fuel with vegetable oils or biodiesels of various origins”, Energy Conversion andManagement, vol. 47, (2006), 3272–3287.[28] National Biodiesel Board (Internet), Biodiesel Emissions, September 2006 (cited September 2006),http://www.biodiesel.org/pdf_files/fuelfactsheets/emissions.pdf[29] A Comprehensive Analysis of Biodiesel Impacts on Exhaust Emissions, U.S. EnvironmentalProtection Agency, (EPA Technical Report, EPA420P02001, October 2002,http://www.epa.gov/otaq/models/biodsl.htm).[30] 2004 Biodiesel Handling and Use Guidelines, U.S. Department of Energy, Energy Efficiency andRenewable Energy, (DOE/GO1020041999, October, 2004,http://www1.eere.energy.gov/biomass/pdfs/36182.pdf).Chapter 3[31] The New FarmRegenerative Agriculture Worldwide,http://www.newfarm.org/features/1004/bio3/index.shtml[32] See Internal Revenue Service, U.S. Department of the Treasury,42
http://www.irs.gov/publications/p378/ch07.html.[33] See Internal Revenue Service, U.S. Department of the Treasury,http://www.irs.gov/publications/p378/ch07.html.[34] Contribution of the Biodiesel Industry to the Economy of the United States; LECG, LLC; June 19,2006Chapter 4[35] Minnesota IMPLAN Group, Inc., IMPLAN System (data and software), 1725 Tower Drive West,Suite 140, Stillwater, MN 55082, www.implan.com, 1997.BibliographyChapter 12005 National Biodiesel Consumer Survey Report. National Biodiesel Board. Moore Information,2006. 31 July 2006.Bickel, Kenneth, and Kelly Strebig. Final Report for "SoyBased Diesel Fuel Study" MinnesotaDepartment of Agriculture. 2000. 31 July 2006.The Biodiesel Plant Development Handbook. Kearney: Independent Biodiesel Feasibility Group,LLC, 2002. 27 Mar. 2006 . BoozAllen, and Hamilton. Market Potential of Biodiesel in Regulated Fleets, Marine Vessels andUnderground Mining Equipment. 1998. 25 Jan. 2006.Duncan, John. Costs of Biodiesel Production. Energy Efficiency and Conservation Authority.2003. 25 Jan. 2006 .Fortenbery, Randall T. Biodiesel Feasibility Study: an Evaluation of Biodiesel Feasibility inWisconsin. Dept. of Applied Economics, University of WisconsinMadison. 2005. 24 Jan. 2006.Frey, Christopher H., and Kim Kwangwook. Operational Evaluation of Emissions and Fuel Use ofB20 Versus Diesel Fueled Dump Trucks. Dept. of Envir. Eng., North Carolina State University.2005. 31 July 2006 ."Governor Pawlenty Creates Task Force to Help KickStart State's Biodiesel Industry." MDAQuarterly Spring 2003: 4.Groschen, Ralph. Overview of: the Feasibility of Biodiesel From Waste/Recycled Greases andAnimal Fats. Minnesota Department of Agriculture. 31 July 2006.Hill, Jason, Erik Nelson, David Tilman, Stephen Polasky, and Douglas Tiffany. Environmental,Economic, and Energetic Costs and Benefits of Biodiesel and Ethanol Biofuels. University of43
Minneosta and St. Olaf College. 2006. 20 July 2006
Appendix A: Demand and Supply Supporting DataAppendix tables include:Table A1: <strong>Great</strong> <strong>Lakes</strong> States Soybean Production and Price Trends 19962006Table A2: Minnesota Soybean Production and Price Trends 19962006Table A3: Number of Biodiesel Alternative Refuel Sites by <strong>Great</strong> <strong>Lakes</strong>State, 2005Table A4: Minnesota Producers of Biodiesel Fuel, 2006Table A5: <strong>Great</strong> <strong>Lakes</strong> States Private and Commercial Non HighwayUse of Gasoline2004Table A6: Marine Diesel Sales, Corunna Refinery, Ontario, CanadaTable A7: Biodiesel Fuel, Duluth/Superior Shipping Demand, 2005Table A8: U.S. Waterborne Traffic by State in 2004Table A9: U.S. Biodiesel Production and Consumption TrendsTable A1: <strong>Great</strong> <strong>Lakes</strong> States Soybean Productionand Price Trends 19962006ProductionYear Area(thousands ofbushels)Price($ per bushel)1996 Wisconsin 32,190 $7.241997 Wisconsin 44,000 $6.381998 Wisconsin 51,700 $4.851999 Wisconsin 59,800 $4.702000 Wisconsin 60,000 $4.452001 Wisconsin 58,090 $4.312002 Wisconsin 66,880 $5.352003 Wisconsin 46,760 $7.112004 Wisconsin 53,475 $5.702005 Wisconsin 69,520 $5.502006 Wisconsin 68,0401996 Illinois 398,925 $7.551997 Illinois 427,850 $6.561998 Illinois 464,200 $5.011999 Illinois 443,100 $4.752000 Illinois 459,800 $4.622001 Illinois 477,900 $4.552002 Illinois 453,650 $5.662003 Illinois 379,620 $7.512004 Illinois 495,000 $5.842005 Illinois 444,<strong>15</strong>0 $5.502006 Illinois 482,4001996 Indiana 203,680 $7.341997 Indiana 230,550 $6.591998 Indiana 231,000 $5.051999 Indiana 216,450 $4.712000 Indiana 252,080 $4.61A1
Table A1: <strong>Great</strong> <strong>Lakes</strong> States Soybean Productionand Price Trends 19962006ProductionYear Area(thousands ofbushels)Price($ per bushel)2001 Indiana 273,910 $4.422002 Indiana 239,455 $5.552003 Indiana 204,060 $7.672004 Indiana 284,280 $5.662005 Indiana 263,620 $5.502006 Indiana 284,0001996 Ohio <strong>15</strong>7,<strong>15</strong>0 $7.421997 Ohio 190,960 $6.491998 Ohio 193,160 $4.991999 Ohio 162,000 $4.722000 Ohio 186,480 $4.632001 Ohio 187,780 $4.462002 Ohio <strong>15</strong>1,040 $5.592003 Ohio 164,780 $7.202004 Ohio 207,740 $5.742005 Ohio 201,600 $5.552006 Ohio 201,4801996 New York1997 New York1998 New York 3,977 $5.101999 New York 4,736 $4.202000 New York 4,356 $4.552001 New York 5,214 $4.552002 New York 4,608 $5.852003 New York 4,830 $7.802004 New York 6,708 $5.402005 New York 7,896 $5.202006 New York 7,8961996 Pennsylvania 11,400 6.651997 Pennsylvania 13,690 6.81998 Pennsylvania <strong>15</strong>,800 4.951999 Pennsylvania 10,<strong>15</strong>0 4.62000 Pennsylvania 16,555 4.372001 Pennsylvania 13,825 4.262002 Pennsylvania 10,140 5.92003 Pennsylvania <strong>15</strong>,375 7.332004 Pennsylvania 19,550 5.432005 Pennsylvania 17,220A2
Table A2: Minnesota Soybean Productionand Price Trends 19962006Year AreaProduction(millions of bushels)Price($ per bushel)1996 MN 224.20 $5.451997 MN 255.45 $5.901998 MN 285.60 $7.261999 MN 289.80 $5.422000 MN 293.<strong>15</strong> $4.322001 MN 266.40 $4.382002 MN 306.85 $4.422003 MN 238.40 $4.652004 MN 232.65 $6.202005 MN 306.00 $7.262006 MN 288.00Source: USDA National Agricultural Statistics ServiceTable A3: Number of Biodiesel Alternative Refuel Sitesby <strong>Great</strong> <strong>Lakes</strong> State, 2005StateBiodiesel sitesOhio <strong>15</strong>Michigan 12Indiana 10Illinois 6Pennsylvania 3Minnesota 2Wisconsin 1New York 0Source: U.S. Department of Energy, Alternative Fuels Data Center website, www.eere.energy/cleancities/afdc/infrastructure/station_counts.html,September 2005. See http://cta.ornl.gov/data/chapter6.shtmlA3
Table A4: Minnesota Producers of Biodiesel Fuel, 2006FUMPASoyMorMN SoybeanProcessorsFeedstock:80% soy,Soybean oil Virgin soybean oil20% poultry fatCatalyst: Sodium Methoxide Sodium Methylate Sodium MethylateMethanol/Ethanol: Methanol Methanol MethanolFeedstock Supplier:Degussa,ConfidentialConfidentialAshland,South Dakota Soy,CBIGlycerine price: 0.12 $0.092/lb VariesCustomers: Confidential Confidential ConfidentialB100 $/gallon: Average of $2.95 2.5 2.6B99.9 $/gallon: 2.5Sales: 3MM gallon 30MM gallon 30MM gallonEmployment: 10 direct 28 10 FTESource: UMD BBER, by phone to producersTable A5: <strong>Great</strong> <strong>Lakes</strong> States Private and Commercial NonHighwayUse of Gasoline2004Oct05 (Thousands of gallons) Table MF24State Marine Total All UsesIllinois 135,960Indiana 12,957 91,475Michigan 64,693 171,076Minnesota 33,789 97,607New York 56,399 161,640Ohio 32,985 <strong>15</strong>9,386Pennsylvania 23,610 110,385Wisconsin 28,980 109,577<strong>Great</strong> <strong>Lakes</strong> States TOTAL 253,413 1,037,106U.S. Total 1,005,029 4,626,471Source: United States Department of Transportation Federal Highway AdministrationPrivate and Commercial Nonhighway Use of Gasoline 2004 1/By state including marinehttp://www.fhwa.dot.gov/policy/ohim/hs04/htm/mf24.htmA4
Table A6: Marine Diesel Sales, Corunna Refinery, Ontario, CanadaYear Fuel in cubic meters2005Marine DieselTotal 55,400 m3Source: Shell Canada LimitedTable A7: Biodiesel Fuel, Duluth/Superior Shipping Demand, 2005Blend Gallons Month/yearB2 650,000 gallons per month 10 month seasonB2 6.5 million annual consumptionSource: Murphy OilTable A8: U.S. Waterborne Traffic by State in 2004(Millions of Short Tons)Domestic tons<strong>Great</strong> <strong>Lakes</strong> StatesOhio 100.60Illinois 113.10Pennsylvania 65.80New York 55.60Michigan 64.40Indiana 73.00Minnesota 40.20Wisconsin 31.90The U.S.Waterway System Transportation Facts. Seewww.iwr.usace.army.mil/ndc/factcard/fc05/factcard.pdfTable A9: U.S. Biodiesel Production and Consumption TrendsYearProductionConsumption(millions of(millions of gallons)gallons)B20 Price2000 2.00 2.00 1.442001 5.00 5.00 1.562002 <strong>15</strong>.00 <strong>15</strong>.00 1.302003 20.00 25.00 1.502004 25.00 30.00 0.002005 75.00 2.48A5
Feasibility study: Usefulness of modern acoustic methods to themaritime industry in relation to changes in water depth inthe <strong>Great</strong> <strong>Lakes</strong>.Steven M. Colman and R. Douglas RickettsLarge <strong>Lakes</strong> Observatory (LLO)University of Minnesota Duluth2205 E. 5 th St.Duluth, MN 55812<strong>Great</strong> <strong>Lakes</strong> <strong>Maritime</strong> <strong>Research</strong> <strong>Institute</strong> (GLMRI)Oct. 2, 2006This report represents the results of research conducted by the authors and does notnecessarily represent the views or policies of the <strong>Great</strong> <strong>Lakes</strong> <strong>Maritime</strong> <strong>Research</strong><strong>Institute</strong>. This report does not contain a standard or specified technique.<strong>Research</strong> Funded in part by the <strong>Great</strong> <strong>Lakes</strong> <strong>Maritime</strong> <strong>Research</strong> <strong>Institute</strong>
Table of ContentsSections Page #1. Abstract 12. Introduction 33. Methods 54. Results and Discussion 75. Potential Economic Impacts 176. References 19List of Figures1. Distribution of ship tracklines in the study area for the sidescan sonar data andthe multibeam bathymetry data. (page 7)2. Sidescan sonar mosaic of the entire survey area outside the harbor. (page 8)3. Single track (detailed) sidescan sonar image showing sand waves on the lakefloor. (page 9)4. Single track (detailed) sidescan sonar image showing the Cloquet water intakestructure. (page 10)5. Single track (detailed), false color, sidescan sonar image showing a smallship wreck lying on a field of sand waves. (page 10)6. Single track (detailed) sidescan sonar images showing anchor drag marks offthe Superior entry. (page 11)7. Single track (detailed) sidescan sonar image showing the piers of the Duluthentry. (page 12)8. Single track (detailed) sidescan sonar image showing the footings for the BlatnikBridge. (page 12)9. Detailed multibeam bathymetry map of the entire survey area outside the harbor,color coded by depth. (page 13)10 Detailed multibeam bathymetry map of the drowned channel of the NemadjiRiver. (page 14)11. Detailed multibeam bathymetry map and sidescan sonar mosaic of an area ofglacial deposits (dark in sidescan sonar image) rising above the smooth surface oflake sediments. (page <strong>15</strong>)
1. AbstractThis project is a feasibility study to determine whether stateoftheart acoustic imagingtechniques, used in basic scientific research studies, can be applied in a way that is usefulto the <strong>Maritime</strong> industry. It addresses <strong>Great</strong> <strong>Lakes</strong> <strong>Maritime</strong> <strong>Research</strong> <strong>Institute</strong> (GLMRI)focus area “Marine transportation and port environmental issues,” and the specificresearch topic “<strong>Great</strong> <strong>Lakes</strong> Outflow Investigation” listed in the call for proposals.We collected highresolution sidescan sonar data as well as multibeam (“swath”)bathymetry. The multibeam bathymetric data was used to make detailed maps of waterdepth and threedimensional models of the coverage area. It can also be used to create“flythrough” animations, although this has not yet been done with the data from thisproject. The sidescan sonar data produces an image of the lake floor, similar to an aerialphotograph, with sound instead of light. The sidescan sonar images depend on both thereflectivity and geometry of the lake floor, so that in areas of relatively high relief,acoustic shadows are cast. The sidescan sonar imagery can also be draped on the threedimensionalmodel of the lake floor produced from the multibeam bathymetry.The results of our surveys show a variety of features that may be of interest to themaritime industry. These include the configuration of the harbor entrances and part of theharbor. Outside of the harbor, the former meandering channel of the Nemadji River isclearly seen, as well as structures such as the Cloquet water intake and small shipwrecks.Areas of sediment movement were clearly imaged as fields of sand waves, this despitethe fact that most of the sand derived from longshore drift from the Wisconsin shore istrapped behind the piers of the Superior entrance. We also observed glacial sedimentssticking up through the lake sediments, several meters above the lake floor. This type ofsurvey can also be used in places where water depth is critical, such as the St. Mary’sRiver near Sault St. Marie.2
2. Introduction: Background and ObjectivesThis project addresses the GLMRI focus area entitled “Marine transportation and portenvironmental issues,” and the specific research topic “<strong>Great</strong> <strong>Lakes</strong> OutflowInvestigation” listed in the call for proposals.As background, changes in water depth due to lakelevel rise or channel erosion are amajor issue of concern to the maritime industry in the <strong>Great</strong> <strong>Lakes</strong>. Sediment transportnear port facilities, which is partly related to lakelevel changes, is another significantconcern. Modern lakefloor imaging technologies, such as chirp sidescan sonar andmultibeam bathymetric measurements, may be practical methods for addressing theseconcerns at a level that is useful for shipping and portmaintenance interests.Water depth in the <strong>Great</strong> <strong>Lakes</strong> is a critical issue for the maritime industry because itdirectly affects the size of the cargos that can be shipped, such that there is a welldocumented monetary value placed on each foot of water depth in critical passages.Water depth is determined by two quantities: the elevation of the lake floor and theelevation of the water surface. The elevation of the water surface has been preciselymeasured by agencies such as NOAA and the Army Corps of Engineers for more than acentury. On time scales of years to decades, it is affected mainly by climate changes thatdetermine the amount of precipitation passing through the <strong>Great</strong> <strong>Lakes</strong>. To a lesserextent, it is affected by the longterm tilting of the <strong>Great</strong> <strong>Lakes</strong> basin as a response tounloading of the earth’s crust following the melting of the last great ice sheets [1], whichcontinues slowly today [2]. In special circumstances, it may also be affected by erosionand enlargement of narrow constrictions, such as that recently documented in the St.Claire River [3].Increase in water depth caused by erosion of the lake floor has a counterpart in theopposite direction: deposition of sediment on the lake floor or channel. Deposition, ineffect, raises the elevation of the lake floor and decreases the water depth. The latterprocess is typically a problem at harbor entrances, which must accordingly be dredged.Our objectives for this feasibility study is to determine whether stateoftheart acousticimaging techniques can be applied in a way that is useful to the maritime industry,addressing almost all of the concerns discussed above. We conducted a survey of theapproaches to Duluth and Superior harbor entrances, from a water depth of about 10 to 50meters. We collected multibeam bathymetric and CHIRP sidescansonar data,continuously covering the study area. Together, these data sets allow us to document thefollowing: (1) the detailed configuration of the lake floor: This will serve as a baseline forcomparison to any future natural or manmade changes. It will also show whether we candetermine lakefloor configurations with enough resolution to be applicable to problemssuch as erosion of the channel of the St. Claire River. (2) The configuration of nearshoresediment along the barrierspit coastline of the western end of Lake Superior: Thissediment is assumed to be transported from the eroding bluffs of the Wisconsin coast bylongshore currents to the barrier spits, where it is deposited, tending to clog the harborentrances. However, this assumption is not well documented. Our survey provides3
indications about the source and the transport direction of sediment associated with thebarrier spits. (3) Evidence of former shorelines of the lake now submerged: Identificationof these former shorelines would help quantify the longterm rate of tilting of the basin,which is causing the western end of Lake Superior to be submerged.Erosion and sediment erosion have been studied with acoustic methods both for generalscientific purposes and for specific engineering projects for many years. Two things,however, make this project unique. First, we will be using stateoftheart acoustic(sonar) equipment, as described in the Methods section. Secondly, we will be using thisequipment to directly address the question of whether we can produce data from arelatively large area that is useful to the maritime industry.The recent development of highfrequency multibeam systems has revolutionized thehydrographic surveying of shallow water areas [4], making it possible to conductgeomorphological studies of subaqueous surfaces [5]. The highresolution mapsproduced by these instruments can be used to study present day seafloor processes aswell as those that occurred in the past. For example, on continental shelves, highresolution multibeam surveys have been used to map and characterize sediment erosionand deposition processes map drowned glacial landforms and sediment erosion anddeposition processes. Recently multibeam surveys have been used to study geologicprocesses in freshwater lakes [6 & 7].Sidescan sonar has been used for a long time to image the sea floor. However, recenttechnical advances have greatly improved the quality of the data. In particular, the use ofdigital data and sweptfrequency (CHIRP) sidescan sonar systems has substantiallyimproved resolution and image quality. Recent examples of the use of sidescan sonar inmarine environments include Monterey Bay [8], and in lake environments include BearLake [9].4
3. MethodsThe LLO has a surveygrade multibeam bathymetry system mounted on the hull of theRV Blue Heron. We have also recently acquired a stateoftheart chirp sidescan sonarsystem. Finally, we have extensive computer facilities, with which we processed thesedata and creating maps and images of the lake floor.The Seabat 8101 multibeam 1 used in this survey is a 240 kHz multibeam that uses 1011.5degree beams to measure the bathymetry of the lake floor. The width of the swathilluminated on the lake floor is approximately 7.5 times water depth in water less than 70meters deep. The system has a range resolution of 1.25 cm. Its lateral resolution (in theabsence of vessel motion and positioning error) is dependant upon water depth and thenumber of beams retained in the processed data. The system is capable of producing datathat meets the IHO standards for hydrographic surveying (International HydrographicOrganization, 1998). In order to do this, a TSS POS MV/320 motion sensing andpositioning system 1 was used to measure the survey vessel’s motion (roll, pitch andheading) to an accuracy of less than +/ 0.05 degrees and it's position to less than 1meterhorizontally and 25 cm vertically. Differential corrections for the positioning system weresent via a radio link, from a temporary base station established on the lakeshore. Soundvelocity profiles were collected periodically during the survey. These were used in postacquisitionprocessing to correct ray bending artifacts in the data. Postacquisitionprocessing of the data was preformed using CARIS HIPS/SIPS computer programs 1 .The sidescan sonar data were collected in a manner similar to that for the multibeambathymetry, except that the instrument was towed behind the RV Blue Heron. We used adual frequency CHIRP EdgeTech 512 system 1 . The width of the swath imaged on thelake floor was between 50 and 100 meters on either side of the ship. The data wereprocessed with the same computer systems as the multibeam bathymetric data.1The authors and The <strong>Great</strong> <strong>Lakes</strong> <strong>Maritime</strong> <strong>Research</strong> <strong>Institute</strong> do not endorse productsor manufacturers. Trade names or manufactures names appear herein solely because theyare considered essential to this report.5
4. Results and DiscussionWe successfully collected sidescan sonar data over swaths of the lake floor off MinnesotaPoint. The survey grid for both the sidescansonar and multibeam data are shown inFigure 1. The sidescan sonar mosaic (Fig. 2, small format here; large format image at theend of the printed report) of the entire area off Minnesota Point shows a variety offeatures on the lake floor. Especially prominent are the drowned, meandering channel ofthe Nemadji River and the dark patches that represent glacial sediments that emerge fromthe lake sediments and rise several meters above the otherwise smooth lake floor. Theglacial sediments are presumably kept free of lake sediments by currents and waves inthis nearshore environment, and they are probably in the process of being eroded down tothe level of the rest of the lake floor by the same processes.Figure 1. Distribution of ship tracklines in the study area for the sidescan sonar data andthe multibeam bathymetry data.6
Figure 2. Sidescan sonar mosaic of the entire area outside the harbor with the northwestportion at the top, and the southeast portion at the bottom. Inset shows the portion of thesurvey covered by each image.7
Single track images of the sidescan data also show interesting features in greater detail.(Fig. 3). The area contains fields of sand waves, indicative of sediment transport. Thesand waves occur northwest of the Superior entrance, whose piers capture most of thesand transported by longshore drift along the Wisconsin shoreline. Maps of historicchanges in the shoreline [10] demonstrate the accumulation of sand on the southeast sideof the Superior entry. Although these maps do not show erosion on the northwest side ofthe Superior entry, sand must be moving along Minnesota Point, with a source eitherthere or from onshore movement of relict nearshore sand.Figure 3. Single track (detailed) sidescan sonar image showing sand waves on the lakefloor. Scale and north arrow at right.Other singletrack details of the sidescan sonar mosaic show a variety of manmadefeatures, including the Cloquet water intake (Fig. 4), a small ship wreck (Fig. 5), andanchor drag marks (Fig. 6). These images show that our sidescan sonar system would bepotential useful for inspecting structures or searching for manmade objects in the lake.Detailed images of structures inside the harbor reinforce this conclusion. Detailed imagesincluded here are the entrance piers for the Duluth entry (Fig. 7) and the footings for theBlatnik Bridge (Fig. 8). The sidescan sonar data would also be useful for examining theintegrity of the steel sheet pilings around the harbor.8
Figure 4. Single track (detailed) sidescan sonar image showing the Cloquet water intakestructure. The white areas to the left of the intake and the pipe are acoustic shadows.Scale and north arrow at right.Figure 5. Single track (detailed), false color, sidescan sonar image showing a small shipwreck lying on a field of sand waves. Toptobottom dimension is about 100 meters.9
Figure 6. Single track (detailed) sidescan sonar images showing anchor drag marks offthe Superior entry. Scales and north arrows at right.10
Figure 7. Single track (detailed) sidescan sonar image showing the piers of the Duluthentry. Scale and north arrow at bottom.Figure 8. Single track (detailed) sidescan sonar image showing the footings for theBlatnik Bridge (lower right). Scale and north arrow at bottom.11
The multibeam data provide a detailed bathymetric map of the entire survey area (Fig. 9).In closeups of the bathymetry, smaller features, such as the drowned channel of theNemadji River (Fig. 10) and glacial deposits that rise above the smooth surface of thelake sediments (Fig. 11) can be seen.Figure 9. Detailed multibeam bathymetry map of the entire survey area outside theharbor, color coded by depth. Scale, north arrow, and color coding at upper right.12
Figure 10. Detailed multibeam bathymetry map of the drowned channel of the NemadjiRiver, color coded by depth. Scale, north arrow, and color coding at upper right.13
Figure 11. Detailed multibeam bathymetry map and sidescan sonar mosaic of an area ofglacial deposits (dark in sidescan sonar image) rising above the smooth surface of lakesediments.Although not shown here, these multibeam bathymetric maps can be viewed as threedimensionalmodels, from any designated perspective, and the threedimensionalperspectives can be combined to create a virtual “fly through” of the survey area.Detailed bathymetric data is of great interest to the maritime community. Usingmultibeam swath systems is much more efficient and produces much more complete datathan traditional singletrack soundings. Also, the sidescan sonar mosaics can be “draped”over the multibeam perspectives to allow the two types of data to be viewedsimultaneously. Such views are particularly useful for scientific interpretations.In summary, we have shown that collecting highquality data from the floor of LakeSuperior is feasible, and that such data may be of interest to the maritime community.Both the sidescan sonar data and the multibeam bathymetry are stateoftheart and areapplicable in a wide variety of settings. In the near future, we will be having stakeholdermeetings with the Army Corps of Engineers, the Duluth and Superior Port Authorities,the Coast Guard, and other members of the local maritime community.14
5. Potential Economic Impacts of the <strong>Research</strong> ResultsBecause this was a feasibility study and because we achieved our goals in terms of datacollection, the overall project was successful. The potential economic impacts of theproject were mentioned in the introduction; specifically potential documentation of waterdepth changes, and sediment erosion and deposition processes. Water depth in the <strong>Great</strong><strong>Lakes</strong> is a critical issue for the maritime industry because it directly affects the size of thecargos that can be shipped, such that there is a well documented monetary value placedon each foot of water depth in critical passages. On time scales of years to decades, waterdepth is affected mainly by climate changes that determine the amount of precipitationpassing through the <strong>Great</strong> <strong>Lakes</strong>. To a lesser extent, it is affected by the longterm tiltingof the <strong>Great</strong> <strong>Lakes</strong> basin as a response to unloading of the earth’s crust following themelting of the last great ice sheets. In special circumstances, it may also be affected byerosion and enlargement of narrow constrictions, such as that recently documented in theSt. Claire River. Water depth near harbors and their entrances is also caused by erosion ofthe lake floor and by deposition of sediment on the lake floor or channel. Deposition, ineffect, raises the elevation of the lake floor and decreases the water depth. The latterprocess is typically a problem at harbor entrances, which must accordingly be dredged.Changes in water depth from all of the causes listed above have direct and obviouseconomic impacts on harbors and the maritime industry that depends on them.Because this project was designed as a feasibility study, we intend to meet withprospective stakeholders now that the project is essentially completed. Potential localstakeholders include the Coast Guard, the Army Corps of Engineers, and the Duluth andSuperior Port Authorities.<strong>15</strong>
6. References1. Farrand, W.R., and Drexler, C.W., 1985, Late Wisconsinan and Holocene history ofthe Lake Superior basin, in Karrow, P.F., and Calkin, P.E., eds., QuaternaryEvolution of the <strong>Great</strong> <strong>Lakes</strong>, Geological Association of Canada Special Paper30, p. 1732.2. Coordinating Committee on <strong>Great</strong> <strong>Lakes</strong> Basic Hydraulic and Hydrologic Data, 1977,Apparent vertical movement over the <strong>Great</strong> <strong>Lakes</strong>, Detroit District, United StatesArmy Corps of Engineers, 70 p.3. W.F. Baird and Associates, 2005, Regime Change (ManMade Intervention) andOngoing Erosion in the St. Clair River and Impacts on <strong>Lakes</strong> MichiganHuronLake Levels, unpublished consultants’ report.4. Prior, D.B. and Hooper, J.R., 1999, Sea floor engineering geomorphology: recentachievements and future directions: Geomorphology, v. 31, p. 4114395. Magno, E.C.C., Torres, L.C., Jeck, I.K., Alberoni, A.A.L., and Simoes, I.C.V.P., 2000,Bathymetric swath employed in the delineation of geomorphologic features:International Geological Congress, Abstracts, v. 31, p. 31.6. Gardner, J.V., Mayer, L.A., and Hughes Clarke, J.E., 2000, Morphology and processesin Lake Tahoe (CaliforniaNevada): Geological Society of America Bulletin, v.112, p. 736746.7. Wattrus, N.J., Rausch, D.E., 2001, A preliminary survey of relict shorefaceattachedsand ridges in western Lake Superior: Marine Geology, v. 179, Issue 34, pp. 163177.8. Chavez, P.S. Jr. , Isbrecht, J., Galanis, P., Gabel, G.L., Sides, Soltesz, D.L., Ross, S.L.and Velasco, M.G., 2002, Processing, mosaicking and management of theMonterey Bay digital sidescansonar images, Marine Geology, v. 181, p. 3053<strong>15</strong>.9. Colman, S.M., 2006, Acoustic stratigraphy of Bear Lake, UtahIdaho Late quaternarysedimentation patterns in a simple halfgraben, Sedimentary Geology v. 185, p.113125.10. Johnston, C., Trauger, A., Meysembourg, P., Bonde, J., Hawrot, R., Walton, G.B.,1999, Natural Resources of Minnesota Point: Maps and Data in Support of theMinnesota Point Environmental Plan: University of Minnesota, NRRI TechnicalReport NRRI/TR99/11.16
Final Report: <strong>Great</strong> <strong>Lakes</strong> <strong>Maritime</strong> Transportation K-12 Education Programfor Teachers, Students, & Communities (Year 1: January <strong>15</strong>-September 30, 2006)Project Coordinator/Principal Investigator:Joan Schumaker Chadde, Education Program CoordinatorWestern U.P. Center for Science, Mathematics & Environmental Education105 Dillman Hall - Michigan Technological University1400 Townsend Dr., Houghton, MI 49931-1295Tel: 906-487-3341 Email: jchadde@mtu.eduTable of ContentsProject Summary ……………………………………………………………………………………………………... 1Implementation of Project Goals & Objectives ……………………………………………….. ……………………... 1Evaluation Measures and Results ……………………………………………………………….. ……………………. 2Appendix A - Summary of Publicity & Recruitment for 2006 Summer Teacher <strong>Institute</strong>s …………………………... 5Appendix B - <strong>Institute</strong> Agendas for July 24-28 and July 30-August 4, 2007 …………………………………….…... 6Appendix C - What students need to know about <strong>Great</strong> <strong>Lakes</strong> <strong>Maritime</strong> Transportation …………………………….. 8Appendix D - <strong>Great</strong> <strong>Lakes</strong> <strong>Maritime</strong> Transportation Lessons for Gr. 3-12 (developed by 2006 institute participants). 9Appendix E - <strong>Great</strong> <strong>Lakes</strong> <strong>Maritime</strong> Transportation Teaching Trunk Resources …………………………................. 10Appendix F - <strong>Great</strong> <strong>Lakes</strong> <strong>Maritime</strong> Transportation Trivia Questions – Did You Know? (Draft 10/23/06) ............ <strong>15</strong>Appendix G - <strong>Great</strong> <strong>Lakes</strong> <strong>Maritime</strong> Shipping Vocabulary ........................................................................................ 21Project SummaryThis project addressed the GLMRI Focus Area of K-12 public education and outreach programs. The projectconducted two one-week teacher institutes in summer 2006, developed an interactive online web module for students,a K-12 <strong>Maritime</strong> Transportation Education website and a K-12 teaching trunk. A total of 21 K-12 teachers attendedthe two teacher institutes. They were extremely enthused about their experience and are now excited to teach about<strong>Great</strong> <strong>Lakes</strong> shipping in their classrooms. Thousands of students and others in the <strong>Great</strong> <strong>Lakes</strong> basin and nationwidewill be reached in the coming months and years via the new lessons developed by the teacher participants, or byinteracting online with actual photos and real-world challenges of <strong>Great</strong> <strong>Lakes</strong> maritime transportation through aninteractive web module, website, and teaching trunk. The project was coordinated by Joan Schumaker Chadde,education program coordinator for the Western Upper Peninsula Center for Science, Mathematics and EnvironmentalEducation at Michigan Technological University.Implementation of Project Goals & Objectives1) Conducted two week-long <strong>Great</strong> <strong>Lakes</strong> <strong>Maritime</strong> Transportation Summer Teacher <strong>Institute</strong>s.Week I took place in western Lake Superior from July 24-28, where nine participants visited sites in Duluth, Superior,and Minnesota’s north shore. Week II took place in Michigan’s eastern Upper Peninsula from July 30-August 4 where14 participants visited sites in Marquette, Munising, Whitefish Point, Sault Ste. Marie, Fayette, and Escanaba. Bothinstitutes addressed maritime history, <strong>Great</strong> <strong>Lakes</strong> shipping routes, ports, and cargoes; and required teachers to developtwo maritime transportation lessons that could be implemented in their math, social studies, language arts, and/orscience classes. A summary of the 2006 teacher institute recruitment publicity, the two one-week teacher instituteagendas, a list of what teachers believe K-12 students need to know about <strong>Great</strong> <strong>Lakes</strong> shipping after attending the twoinstitutes, and a list of lessons developed by participating teachers is contained in Appendices A-D.It was decided to conduct two institutes, rather than the one six-day institute originally proposed in the initial proposal,in order to comfortably visit the many interesting shipping-related sites in both Duluth-Superior and in the easternUpper Peninsula of Michigan. <strong>Institute</strong> participants were able to visit a variety of typically inaccessible sites andinteract directly with ship captains, industry personnel, port authorities, city planners, and government agencies(Duluth Seaway Port Authority, U.S. Army Corps, U.S. Coast Guard, Duluth <strong>Maritime</strong> Museum, Northern <strong>Great</strong>1
<strong>Lakes</strong> Visitor Center, Marquette city planning and economic development office, Whitefish Point Lighthouse andMuseum, and the Soo Locks).Teacher participants were able to earn two graduate credits from Michigan Technological University for their workbefore, during, and after each <strong>Institute</strong>. They developed nearly 40 lesson plans that will be posted on the K-12<strong>Maritime</strong> Transportation Education website. The best lessons will become part of the <strong>Great</strong> <strong>Lakes</strong> <strong>Maritime</strong>Transportation Educators Guide proposed for development in Year 2. One institute participant developed draft text fora potential children’s book, “F is for Freighter: An ABC book of <strong>Great</strong> <strong>Lakes</strong> Shipping.” Opportunities for publishingthe book will be explored.<strong>Institute</strong> participants paid a total of $250 for the 5-day institute which included all lodging and transportation expenses,2 MTU graduate credits, most meals, and entrance fees. In addition, participants received informational packets,NOAA <strong>Great</strong> <strong>Lakes</strong> map, and a CD of the presentations made by most presenters, and photos.Recruitment for the 2007 teacher institute has already begun and will incorporate suggestions received from 2006participants who recommended making presentations at science and social studies conferences in Michigan,Wisconsin, and Minnesota, as well as, articles in professional organizations’ newsletters, and their word of mouthcontacts to colleagues.2) Developed web module on <strong>Great</strong> <strong>Lakes</strong> <strong>Maritime</strong> Transportation. http://techalive.mtu.edu/glmri/index.htmThe development of this interactive web module was coordinated by Dr. Marty Auer, Professor of Civil &Environmental Engineering at Michigan Technological University, who cost-shared his time. The content of themodule was developed by MTU graduate student, Heidi Steudel, and animations were provided by Sue Hill. Some ofthe topics to be included are: comparing <strong>Great</strong> <strong>Lakes</strong> shipping to alternate transportation systems, shipping routes,cargoes, lock systems, and more, etc. The web module will be beta-tested by students before being finalized. Themodule is hosted on the Michigan Tech Alive website (http://techalive.mtu.edu/glmri/index.htm ) but will be linkedfrom the GLMRI website.3) Developed new K-12 <strong>Maritime</strong> Transportation Education websitehttp://wupcenter.mtu.edu/education/great_lakes_maritime/index.htmThis new website will serve as a resource for educators. The website is hosted on the Western U.P. Center for Science,Mathematics and Environmental Education’s website at Michigan Technological University and will be linked toGLMRI’s website. The website will serve as a clearinghouse for teaching resources. Lessons developed by teacherparticipants in the summer institutes, links, photos, powerpoint presentations, a Did You Know Quiz on <strong>Great</strong> <strong>Lakes</strong>Shipping (see Appendix F), glossary of shipping terms (see Appendix G), and descriptions of suggested shippingrelatedfield trip destinations are just some of the items to be included on the website that will be helpful to both formaland non-formal educators. <strong>Maritime</strong> experts and organizations are also invited to make contributions to the website.4) Developed a <strong>Great</strong> <strong>Lakes</strong> <strong>Maritime</strong> Transportation teaching trunkThe trunk is designed for upper elementary and middle school classrooms and provides a wide variety of resources forteaching about <strong>Great</strong> <strong>Lakes</strong> shipping, including sample cargo, such as iron ore (taconite) pellets, coal, salt, limestone,sand; models of “lakers;” a 12’x14’ cloth floor map of the <strong>Great</strong> <strong>Lakes</strong> watershed showing major shipping ports, tenchildren’s books, ten videos, and a half-dozen curricula on <strong>Great</strong> <strong>Lakes</strong> shipping. The trunk may be checked out fortwo week periods and will be shipped via UPS. Interested educators may contact Loret Roberts at the Western U.P.Center for Science, Mathematics and Environmental Education (Tel: 906-482-0331 or loret@copperisd.org ) to reservethe trunk. Borrowers are responsible for returning the trunk. After piloting the trunk for one year, we will makemodifications to enhance its usefulness to teachers, and funding can be sought to replicate the trunk for use throughoutMI, WI, and MN. In Michigan, the trunks can be disseminated by the network of 33 math/science centers throughoutthe state. A list of trunk resources is included in Appendix E of this report.2
Evaluation Measures and ResultsTo evaluate overall project success, several evaluation measures were gathered. Teacher participants completed acourse evaluation following each summer institute that will be used to improve future institutes. Significant findingsfrom the teacher institute evaluation form are listed below.(1) The pre-course reading, <strong>Great</strong> <strong>Lakes</strong> Marine Transportation System white paper prepared for theMidwest Freight Corridor Study by Dr. Richard Stewart, co-director of the <strong>Great</strong> <strong>Lakes</strong> <strong>Maritime</strong> <strong>Research</strong><strong>Institute</strong>, was considered extremely helpful by all participants.(2) Teachers identified the best dates for scheduling summer teacher institutes:Last 2 weeks of June - 2July - 9First 2 weeks of August - 5Last 2 weeks of August - 0(3) Teachers identified useful incentives to encourage attendance at the institute? (17 responses)Dates were convenient - 9Inexpensive cost - 14Opportunity to earn credits - 12Topic of interest - 14 (Other: MTU classes are fun.)(4) Teachers made suggestions for teacher recruitment for next summer’s institute:Conference presentation - 3Word of mouth recruitment - 8Write an article for an education journal - 2Write an article for your school newsletter - 2Post info on your school’s website - 3Write an article for an organizational newsletter - 1Other evaluation comments:• Keeping the quality high and cost low.• You supplied everything we could ask for: grad credit, room and board, and free admission to verycool sites.• Encourage teachers to bring colleagues from the same school district to the institute so they can worktogether after the institute.• Presentations at annual state social studies conferences.• Make these institute classes part of a “planned program” for State of Michigan teacher certification.The credits aren’t that useful if you don’t already have your permanent teacher certification.(5) What teachers’ enjoyed most about the institutes:Overwhelmingly, teachers enjoyed the opportunity to see and do things that would typically not be accessible tothem traveling on their own, i.e. industrial port facilities, Cleveland Cliffs iron ore mine, Army Corps ofEngineers, Soo locks underground tour, and access to the experts and specialists. Specific responses from eachweek are shown below:Week I:• There are too many to name! The more hands-on, the more I enjoyed it.• I am impressed with the wide variety of site explorations that included all the facets of the shipping industryfrom the arrival of goods by rail and the safety processes of the port to the shipping of those goods to other GLports and global destinations. I was able to do this with my friend and meet a new network of professionalfriends.3
• I loved being treated like an honored and important guest. We were privileged to see so many interesting sitesin a way we would never have on our own. Teachers rarely are treated so well. Everyone was so interested inour ideas and input. It was a really good and positive experience.• Being able to go to the port terminals and other sites like the lighthouse, instead of being lectured to in aclassroom!• Becoming aware of the transportation issue. Our sessions at the Duluth Port Authority were very interestingand helpful, and the Port Authority representative did a great job narrating the harbor tour.Week 2:• Whitefish Point (3)• Touring the Cleveland Cliffs Mine and learning how iron-ore gets processed and shipped. (3)• I also was fascinated by the Soo Locks tour (by the U.S. Army Corps) behind the scenes (8)• As a history teacher, I enjoyed the Whitefish Point museum and Fayette. (2)• The Army Corps of Engineers was awesome.• Visiting many places where you normally couldn’t go. i.e. Soo Locks tour, Coast Guard Facility tour,(Cleveland Cliffs) iron ore mine, personal presentations at Marquette, Escanaba• Soo Locks Boat Tour (2)• Walking under the Poe Lock!• I liked all of it!• Coast Guard facility Vessel Traffic Service (2)(6) Ways to improve the content or schedule of the teacher institutes for next year.Week 1:• Provide time to reflect with other teachers in the institute. Lots of info has been given to us throughout theweek and we need time to process it all!• Include a daily roundtable discussion at the conclusion of each day with all members participating.• A meeting site is a necessary component in building a community of the learners and professional collegiality.The meeting site would provide a gathering place to review, discuss, answer questions, or give direction to theentire group daily.• Be sure to have a course overview at the beginning of the institute.• Have internet access and a resource room available at UMD.Week 2:• Week 2 tied in nicely with the first week. I would not recommend taking one week without the other.However, doing both weeks really wore me out physically.• Maybe state that the class is “Shipping and Industry” or “Transportation and Industry,” as we did both.• Start at 9 and end at 5 each day with discussions at 7:30-8:30 at breakfast and 6:30-7:30 at dinners.Discussions should count as class time. Keep focus on shipping. Eliminate Sault Edison/Pictured Rocks.• Leave out the paper mill tour and try to get a tour of a limestone quarry at Gulliver or Cedarville in U.P.• Build in small group discussion time, do not always require whole group time, build on journal reflection time,and build in lesson planning time. End by 9:00 pm daily!• Start class on Sunday evening for course overview.The following additional evaluation information will be gathered over the 2006-07 school year and will beincluded in Year Two’s report:♦ Teacher feedback following implementation of newly developed lessons in their classroom and themastery of learning objectives by their students.♦ Teachers’ and students’ assessment of the new interactive web module on <strong>Great</strong> <strong>Lakes</strong> shipping.♦ Teachers feedback on the usefulness of the <strong>Great</strong> <strong>Lakes</strong> <strong>Maritime</strong> Transportation teaching trunk, and recordson the frequency of its use and teachers’ comments and suggestions.4
Appendix ASummary of Publicity & Recruitment for 2006 Summer Teacher <strong>Institute</strong>sMICHIGAN♦ Michigan Science Teachers’ Association (MSTA) list-serve sue@ucia2.com♦ Michigan Building A Presence for Teachers list-serve larwad@charter.net♦ Email to 1,000+ past MTU teacher workshop/institute participants (2001-2006)♦ Resource agencies & organizations: conservation districts, county extension offices♦ Michigan DEQ statewide Environmental Education website http://www.michigan.gov/deq/♦ U.P. Environmental Educators website♦ Michigan Earth Science Teachers’ Association (MESTA) website http://www.mestarocks.org/♦ Michigan Math & Science Centers list-serve♦ Michigan Project Wild list-serve elshoff@msue.msu.edu♦ Michigan Project WET list-serve vailj@gvsu.edu♦ Michigan Project Learning Tree list-serve kfischer@binderparkzoo.org♦ Michigan Association of Environmental & Outdoor Educators (MAEOE) list-serve and online calendar♦ Michigan Teacher Network list-serve for MI educational institutions and organizations♦ NMU Seaborg Center list-serve of teachersWISCONSIN♦ Wisconsin Assn of Environmental Educators (WAEE) waee@uwsp.edu and annual conference Oct. 25-27.♦ Wisconsin Education Association Council (WEAC) http://www.weac.org/♦ Wisconsin Center for Environmental Education - UW-Stevens Point www.uwsp.edu/cnr/leaf/sf♦ Midwest <strong>Lakes</strong> Policy Center www.midwestlakes.orgMINNESOTA♦ Minnesota SEEK website seek@moea.state.mn.us or mnseek.net♦ University of Minnesota Duluth♦ MN Association for Environmental Education maeeinfo@naaee.org♦ <strong>Great</strong> <strong>Lakes</strong> Aquarium (Dave Schaeffer) education@glaquarium.org♦ Minnesota Science Teachers Association (MnSTA)REGIONAL♦ <strong>Great</strong> <strong>Lakes</strong> States Seagrant coordinators: Jim Luebner, WI Seagrant; Cynthia Hagley & Marie Zhuikov, MNSeagrant, and Steve Stewart, MI Seagrant.NATIONAL• North American Assn for Environmental Education national conference in St. Paul, MN, Oct. 11-14, 20065
Appendix B<strong>Great</strong> <strong>Lakes</strong> <strong>Maritime</strong> Transportation Teacher <strong>Institute</strong>Week 1: July 24-28, 2006 (west end of Lake Superior)Monday, July 24 – Houghton, MI to Duluth, MN8 am (EST) – Meet at Michigan Tech University in Houghton (Wadsworth Hall)8:30 am – Load van and depart.10 am (CST) - Northern <strong>Great</strong> <strong>Lakes</strong> Visitor Center in Ashland, WINoon - Course overview, course requirements, and schedule2 pm - Tour Coast Guard facility in Duluth5:30 pm – Dinner7-9 pm - Lake Superior <strong>Maritime</strong> Visitor Center & MuseumTuesday, July 25 – Duluth, MN8:30 am - Overview of Shipping on the <strong>Great</strong> <strong>Lakes</strong> by Duluth Port Authority11:30-2 pm – Duluth-Superior Harbor Tour & lunch aboard Vista Queen from Barker’s Island in Superior, WI3-4:30 pm – Tour of S.S. William A. Irvin freighter and museum5:30-6:30 pm Dinner7-9 pm – visit <strong>Great</strong> <strong>Lakes</strong> AquariumWed., July 26 – Duluth & Two Harbors, MN9:00 am – Canadian National ore docks in Two Harbors10:30 am - Edna G. tugboat tourNoon – Lunch2-5 pm - Split Rock lighthouse tour6:30 pm DinnerThursday, July 27 – Superior, WI9-11:30 am - Midwest Energy Coal transition pointNoon - Lunch2-4 p.m. - Tour Burlington Northern Santa Fe No. 5 Taconite Facility (BNSF Ore Docks) in Superior, WI4:30 – 6:00 pm – Balancing Social, Economic and Environmental Aspects of Shipping on the <strong>Great</strong> <strong>Lakes</strong> byDr. Stewart, co-director, GLMRI7-9 pm – BanquetFriday, July 28 – Duluth, MN to Houghton, MI9-11:30 am (CST) – Tour of Lake Superior Warehousing Co. and Murphy Oil in DuluthNoon – Lunch & group discussion:o What are the “big ideas” regarding <strong>Great</strong> <strong>Lakes</strong> shipping that your students need to know?o How can you best interest and effectively teach these “big ideas” to your students?12:30 pm (CST) - depart for Houghton, class ends5 pm – arrive Houghton6
Appendix B<strong>Great</strong> <strong>Lakes</strong> <strong>Maritime</strong> Transportation Teacher <strong>Institute</strong>Week 2: Monday-Friday, July 31-Aug. 4, 2006 (eastern U.P. Michigan)Monday, July 31 (Houghton to Munising, MI)8:00 am – Meet at Wadsworth Residence Hall at Michigan Tech in Houghton8:30 am – Depart MTU10:30 am – Tour Cleveland Cliffs’ Tilden Iron Mine & Taconite facility with Dale Hemmila, District Mgr.1:30 pm – Lunch in Harbor Park (Marquette)2 pm – Overview of City of Marquette’s Harbor & Economic Development Plan with:Fred Stonehouse, historian, author & Chair of Marquette’s Harbor Advisory CommitteeSandy Gayk, Director of Community Development for the City of Marquette6:<strong>15</strong> pm – Pictured Rocks National Park Boat Tour & group discussion9:00 pm – Course overview, schedule, and course requirements10:00 pm - Overnight at Sunset Motel on Munising BayTuesday, August 1 (Munising to Sault Ste Marie, MI)7:30 am – Breakfast9 am – Depart Munising11 am - Whitefish Pt Shipwreck MuseumNoon - Lunch1 pm – Drive to Sault Ste. Marie2:45-5 pm - Soo Locks Boat tour6:00 pm – Dinner & group discussion7:30 pm - Soo Locks Visitor Center (on your own)9 pm – Overnight at (Ramada) Ojibway Hotel in Sault Ste. Marie, MIWednesday, August 2 (Sault Ste Marie, MI)8:00 am – U.S. Army Corps of Engineers tour of Soo Locks (water levels, dredging, lock operation, homelandsecurity) with Al Klein, Area Engineer10:00 - U.S. Coast Guard Vessel Traffic ServiceNoon – Lunch1 pm – Tour Edison Sault Electric Co. low-head hydroelectric plant & power canal2 pm – Tour of Valley Camp freighter museum3 pm – Tour on your own: Tower of History Lookout and River of History Museum7 pm – Dinner on your own9 pm – Overnight at (Ramada) Ojibway Hotel in Sault Ste. Marie, MIThursday, August 3 (Sault Ste Marie, MI to Escanaba)8:30-10:00 am - Tour of St. Mary’s Paper Mill in Sault Ste. Marie, ONNoon – Lunch & drive 2.5 hrs to Fayette State Park3 pm – Tour of historic Fayette State Park (former iron smelting site)6 pm – Drive to Escanaba7 pm – Dinner & group discussion9 pm - Overnight at House of Ludington Hotel in EscanabaFriday, August 4 (Escanaba to Houghton, MI)8:00 am Economics of <strong>Great</strong> <strong>Lakes</strong> Shipping by Capt. Mark Phillips, <strong>Great</strong> <strong>Lakes</strong> <strong>Maritime</strong> Academy10:30 am - City of Escanaba Port Expansion plan & harbor tour by Doug Terry, Escanaba City ManagerNoon – Lunch & group discussion:o What are the “big ideas” regarding <strong>Great</strong> <strong>Lakes</strong> shipping that your students need to know?o How can you best interest and effectively teach these “big ideas” to your students?2:00 pm – Course ends. Depart for Marquette & Houghton.7
Appendix C<strong>Great</strong> <strong>Lakes</strong> <strong>Maritime</strong> Transportation Teacher <strong>Institute</strong>What students need to know about <strong>Great</strong> <strong>Lakes</strong> <strong>Maritime</strong> Transportation:A Summary of Participants’ Responses following the 2006 Summer Teacher <strong>Institute</strong>Economics• What ships on the <strong>Great</strong> <strong>Lakes</strong> carry and why.• How the cost, efficiency, and environmental impacts of <strong>Great</strong> <strong>Lakes</strong> shipping compares to other forms oftransportation, such as rail and truck. (6)• How natural resources are moved and used around the <strong>Great</strong> <strong>Lakes</strong>.• How natural resources use and the regional and U.S. economy are dependent upon <strong>Great</strong> <strong>Lakes</strong> shipping. (3)• The critical importance of the Poe lock (at the Soo locks) linking Lake Superior shipping to the lower <strong>Great</strong><strong>Lakes</strong>.• Connection between <strong>Great</strong> <strong>Lakes</strong> shipping and meeting global needs for goods.• Gentrification of harbors and shipping can co-exist, i.e. Duluth• How technological changes have affected harbor communities.• That iron ore is shipped from northern MN and northern Michigan to Detroit, Gary, Cleveland, and otherports to make steel which we all use in our everyday lives.• The variety of transportation systems used in the mining process.• How technological advances in ship design, loading/unloading, navigation, and safety have helped <strong>Great</strong><strong>Lakes</strong> shipping.• The many and varied career opportunities related to <strong>Great</strong> <strong>Lakes</strong> shipping that are available, pay well, andrequire a variety of skills and post-secondary education/training.<strong>Great</strong> <strong>Lakes</strong> Environmental Protection• The role of ballast water management in helping to reduce invasive species entry and spread in the <strong>Great</strong><strong>Lakes</strong>.• How invasive species were introduced and spread throughout the <strong>Great</strong> <strong>Lakes</strong>, and control methods forreducing their impacts and their continued spread.• That <strong>Great</strong> <strong>Lakes</strong> shipping is environmentally safe (good for the environment) and that U.S. Coast Guard andArmy Corps of Engineers and shipping industry do a very good job of protecting our <strong>Great</strong> <strong>Lakes</strong>. (2)Physical Science• How locks work between two water bodies of different elevation, and why locks are important. (2)• How physical principles of balance and momentum affect shipping.History• History of <strong>Great</strong> <strong>Lakes</strong> shipping from the fur trade, to the industrial revolution, to present-day shipping.• How shipping has affected life in Michigan and other <strong>Great</strong> <strong>Lakes</strong> states.• <strong>Great</strong> <strong>Lakes</strong> shipwreck stories, i.e. the Edmund Fitzgerald, so they understand the perils of the <strong>Great</strong> <strong>Lakes</strong>.<strong>Great</strong> <strong>Lakes</strong> Geography• Major shipping routes and ports on the <strong>Great</strong> <strong>Lakes</strong> from the St. Lawrence Seaway to Duluth.Mathematics• How mathematics is used in navigation.8
Appendix D<strong>Great</strong> <strong>Lakes</strong> <strong>Maritime</strong> Transportation Lessons for Gr. 3-12(Mathematics, Language Arts/Reading, Social Studies, Science)Developed by Participants in the 2006 <strong>Great</strong> <strong>Lakes</strong> <strong>Maritime</strong> Transportation Summer Teacher <strong>Institute</strong>sponsored by the <strong>Great</strong> <strong>Lakes</strong> <strong>Maritime</strong> <strong>Research</strong> <strong>Institute</strong> (www.glmri.org )1. <strong>Great</strong> <strong>Lakes</strong> Shipping Calamities & The Story of the Edmund Fitzgerald (4 lessons)By Judi Vittito and Dan Kust, Northfield Middle School (MN)2. How Will You Get Your Iron Ore to Market?3. Boat Building 101: How Can a Ship Carry All That Cargo and Still Float?4. Lighthouses: Guardians of Ships5. Hazards of ShippingBy Craig Croone, Northfield Middle School (MN)6. Shipping and the Lake Erie Water Snake7. Lake Erie Water Snake and the Round GobyBy Lisa Bircher, East Palestine High School (OH)8. How Is Iron Ore Mined?9. How to Remodel a HarborBy Kelly Bolen, Grosse Pointe Schools (MI)10. Pellets, Ships & Cars11. What Happened to Fayette?By Susan Howey, Trombly Elementary, Grosse Pointe Schools (MI)12. <strong>Great</strong> <strong>Lakes</strong> Geology and the Necessity of LocksBy Margaux Parino, Assabet Valley Collaborative Alternative High School (MA)13. Ship to Shore Communication14. Writing a Friendly Letter to the Ship’s CrewBy Robert Palmer, Grosse Pointe Schools (MI)<strong>15</strong>. Portage Canal Navigation16. To Ship or Not to Ship: A Comparison of Transportation Costs in the <strong>Great</strong> <strong>Lakes</strong> RegionBy Deb Zei, Chassell High School (MI)17. Charting A Course18. <strong>Great</strong> <strong>Lakes</strong> Topography from the Bottom Up19. <strong>Great</strong> <strong>Lakes</strong> Shipping Card Game20. The Life of A Laker Board GameBy Sarah Pregitzer, Grant Public Schools (MI)21. Exploring Shipping Through the Ballad of the Edmund Fitzgerald22. Comparing Costs: <strong>Maritime</strong> Shipping vs. Truck Transportation23. Investigating Shipwreck Data24. Exploring <strong>Great</strong> <strong>Lakes</strong> Folklore & FablesBy Debra L. Zolynsky, Kennedy Middle School (MI)9
Appendix E<strong>Great</strong> <strong>Lakes</strong> <strong>Maritime</strong> Transportation Teaching Trunk Resources (10/22/06)Available to <strong>Great</strong> <strong>Lakes</strong> educators fromWestern U.P. Center for Science, Mathematics and Environmental Education at Michigan Technological University105 Dillman Hall Tel: (906) 487-3341 Email: jchadde@mtu.eduCHILDREN’S LITERATUREBarker, Charles Ferguson. (2005). The Day the <strong>Great</strong> <strong>Lakes</strong> Drained Away. Grades 2-5What would happen if the <strong>Great</strong> <strong>Lakes</strong> drained away? This unique children's book shows the interesting landscape thatwould be revealed if all the water in the <strong>Great</strong> <strong>Lakes</strong> was to suddenly disappear. This book educates children andadults about the geologic features under the <strong>Great</strong> <strong>Lakes</strong>, and reminds us never to take the <strong>Great</strong> <strong>Lakes</strong> for granted.Bergel, Colin. (2000). Mail by the Pail. Grades K-4This book illustrates the mail delivery system for <strong>Great</strong> <strong>Lakes</strong> freighters. The J. W. Westcott Company operates themailboat for the U.S. Postal Service marine post office in Detroit-the only mailboat that delivers mail to freighterswhile they are moving.Durbin, William. (2003). Journal of Otto Peltonen: A Finnish Immigrant in Hibbing, MN, 1905. Ages 12+The story of a young Finnish boy and his family’s experience working in the iron ore mines and growing up in acompany town on the Minnesota Iron Range.Gibbons, Gail. (1992). The <strong>Great</strong> St. Lawrence Seaway.Ages 4-8 yrs.Explains the history of this great trade route. Early French explorers and fur traders were halted by the treacherousrapids 500 miles upstream and eventually developed a system for carrying their trade canoes and cargoes around thedangerous stretches to the river beyond, leading into what became known as the <strong>Great</strong> <strong>Lakes</strong>. Ultimately, locks werebuilt to do the lifting. The complexities of the lock system are clearly explained in a series of animated diagrams withjust enough information for young readersHenry, Ragene. (2005). Barefoot Boys of Fayette. Grades 3-5Students learn about the past in the small furnace town of Fayette in Michigan's Upper Peninsula in 1881 with a youngboy and his friends.Hertel, Captain Robert. (1999) The Edmund Fitzgerald: Lost With All Hands. Grades 3-6 (8 copies)A factual account describing the fate of the Edmund Fitzgerald, including <strong>Great</strong> <strong>Lakes</strong> geography, shipping, andtheories as to why the ship sank. Also contains a simple maritime glossary.Holling, Holling Clancy. (1941). Paddle to the Sea. Grades 3-5An Indian boy carves a wooden canoe and sets it into Lake Nipigon to watch it float away. The canoe spends fouryears on the water, being picked up by loggers, fishermen, and families before finally making it to the ocean. Thecanoe’s adventures give children a sense of the wonders and diversity in the <strong>Great</strong> <strong>Lakes</strong>.Walker, Niki. (2003). Life in an Anishinabe Camp. Grades 3-5Crabtree Publishing Company. www.crabtreebooks.com Follow the Anishnabe as they make a living in the LakeSuperior land of Hiawatha…travel, children’s lives, setting up camp, hunting and fishing, clothing, games, beliefs,working, and self-government.Wargin, Kathy Jo. (2003) The Edmund Fitzgerald: The Song of the Bell. Grades K-4The giant ship leaves Superior, Wisconsin loaded with iron ore to make steel that will be used to build cars, butdisaster is building as the storm clouds, known as the ‘gales of November’ gather… This is the story of what happenedto the 29 sailors.10
REFERENCESDuluth Port Authority. 2005. Pride of the Inland Seas .Describes the history of the port of Duluth. An additional 20 chapters that were not included in the book are availableon Duluth Port Authority’s website .<strong>Great</strong> <strong>Lakes</strong> Shipwreck Historical Society. 1998. Whitefish Point Light Station 1849.Whitefish Point, Michigan has been known to native tribes, explorers, missionaries and mariners for centuries. Drawnby the bountiful fishing offered by Lake Superior, the Chippewa Indians used Whitefish Point as a meeting place.Early exploration of Lake Superior led to the discovery of valuable copper and iron ore deposits in the region. Theireconomic potential brought commercial vessel traffic that continues today. Whitefish Point marks a turning point forall shipping traffic entering or leaving Lake Superior. The Edmund Fitzgerald went down 17 miles NW of WhitefishPoint on November 10, 1975.Jauck, Autumn and Laura Pederson. 2005. Pictured Rocks National <strong>Lakes</strong>hore: Exploring by Trail and Shoreline.A full-color photo book capturing the many moods of Lake Superior.Lake Carriers Association. U.S.-Flag Shipping on the <strong>Great</strong> <strong>Lakes</strong> . (brochure).Describes major cargoes and provides a useful map of shipping and receiving ports.Marine Publishing Co. Know Your Ships: Guide to Boat-Watching 2002. www.knowyourships.comSaint Lawrence Development Corporation. The <strong>Great</strong> <strong>Lakes</strong> St. Lawrence Seaway System: Linking NorthAmerica’s Heartland to the World. Describes pilotage, agents/stevedores, U.S. and Canadian port contacts, Seawayfacts, cargoes and more.Sivertson, Howard. 2001. Schooners, Skiffs, and Steamships: Stories along Lake Superior’s Water Trails.This book describes the many interesting watercraft used to carry people across Lake Superior. From the bark canoesand wooden schooners that transported the fur trade and the Mackinaw boats, skiffs and bateaux that worked hershores to the first side-wheel and propeller driven steamships that hauled passengers and freight, Lake Superior’s earlysettlers relied on water transportation as a lifeline to civilization.Soo Lock Boat Tours. 2005. Locks & Ships. Vol. 4.Describes points of interest, histories of Sault Ste. Marie (Michigan & Ontario), lock and canal history in Sault Ste.Marie and St. Lawrence Seaway, historic lighthouses, charts and nautical terms, and more.U.S. Environmental Protection Agency and Environment Canada. 1995. <strong>Great</strong> <strong>Lakes</strong> Environmental AtlasMaps, history, environmental concerns, management, diagrams, fact sheets on the five <strong>Great</strong> <strong>Lakes</strong>.VIDEOSAquatic Exotics (22:00 min.) Grades 4-8Minnesota Department of Natural Resources – Exotic Species Management Program (1996)Tel: 612-296-2835Describes common exotic plant and animal species threatening the <strong>Great</strong> <strong>Lakes</strong> and suggests way to control theirspread. For grades 4-8.Barging into the 21 st Century (1996) (8:48 min)American Waterways Association801 North Quincy Street, Suite 200, Arlington, VA 22203Tel: 703-841-9300 http://www.americanwaterways.com/Follows the tugboats, towboats, and barges which serve the waterborne commerce of the United States, enhancing theindustry's ability to provide safe, efficient, and environmentally responsible transportation.11
Intermodal Freight Transport http://www.marad.dot.gov/index.html.<strong>Maritime</strong> Administration U.S. Department of Transportation400 7th Street, SW Washington, D.C. 20590Tel: 847-995-0122To improve and strengthen the U.S. marine transportation system, including infrastructure, industry and labor, to meetthe economic and security needs of the Nation. MARAD programs promote the development and maintenance of anadequate, well-balanced United States merchant marine sufficient to carry the Nation’s domestic waterbornecommerce and a substantial portion of its waterborne foreign commerce, and capable of service as a naval and militaryauxiliary in time of war or national emergency. MARAD also seeks to ensure that the United States maintainsadequate shipbuilding and repair services, efficient ports, effective intermodal water and land transportation systems,and reserve shipping capacity for use in time of national emergency.Living on the Edge: <strong>Great</strong> <strong>Lakes</strong>-St. Lawrence River Shoreline (25 minutes)Army Corps of Engineers – Detroit District and the International Joint CommissionPerspective of a Vital Waterway: The <strong>Great</strong> <strong>Lakes</strong> ~ St. Lawrence Seaway System (21:38 minutes)St. Lawrence Seaway Development CorporationTel: 1-800-785-2779 www.greatlakes-seaway.comBeginning with the construction of the St. Lawrence Seaway in 1954 and the official opening in 1959, this bi-nationalproject shared by Canada and the United States, was one of the top ten public works projects of the 20 th century. Thisvideo captures the rich history, grandeur and diversification of this important waterway which includes channels,locks, rivers, and all five <strong>Great</strong> <strong>Lakes</strong>. Ocean-going freighters, bulk carriers, petroleum tankers, cruise ships, andpleasure craft all share in the convenience, efficiency and environmental benefits of one of the world’s premiere inlandwaterways.Rise and Fall of the <strong>Great</strong> <strong>Lakes</strong>. 1991. National Film Board of Canada (17 minutes)Tel: 1-800-542-2164 Website: http://www.nfb.ca/.A lesson in the geologic history of the <strong>Great</strong> <strong>Lakes</strong>. While the <strong>Great</strong> <strong>Lakes</strong> have had their ups and downs, nothing hasbeen harder to take than present-day human impact. In the film, a lone canoeist lives through the changes overtimethrough Ice Age and floodonly to find himself trapped in a sea of 21 st century scum.Split Rock Light: Tribute to the Age of Steel (DVD) (22 minutes)A story of the beacon that guided the ships along the rocky coast of Lake Superior’s North Shore.Tragedies in the Mist. 2004. Thunder Bay National Marine Sanctuary & Underwater Preserve, Alpena, MIThousands of vessels plied the <strong>Great</strong> <strong>Lakes</strong> for exploration, transportation, and trade. Many never reached theirdestinations. An area of Lake Huron known for extreme weather, treacherous waters, and dense fog has claimed over200 ships. Today these sites are protected by the Thunder Bay National Marine Sanctuary and Underwater Preserve,allowing us to explore lost chapters of America’s past.A Vital Waterway – The <strong>Great</strong> <strong>Lakes</strong> St. Lawrence Seaway System (10:28 minutes)St. Lawrence Seaway Development CorporationTel: 1-800-785-2779 www.greatlakes-seaway.comThis video captures the grandeur and economic importance of The <strong>Great</strong> <strong>Lakes</strong> St. Lawrence Seaway System--- itsbustling ports, comprehensive marine transportation infrastructure, diverse intermodal transportation connections, andscenic vistas which all contribute to the making of North America’s premier inland waterway.Where Steel Begins (<strong>15</strong>:00 minutes) by the American Iron Ore Association (1991)Available from Lake Carriers’ Association, Suite 9<strong>15</strong>, 614 W. Superior Ave., Cleveland, OH 44113-1383Tel: 216-861-0592 Website: www.lcaships.comFollow a hunk of iron ore, as it is mined and transformed into a taconite or a pelletized ball that is 60% iron, whichthen goes on to become the steel used in automobiles, rail lines, buildings, and many more of our everyday products.This video is a bit dated; may be easier to follow for younger audiences. Minnesota-based.12
Steel Starts Here (12:00 minutes) by the Cleveland Cliffs, Inc. Michigan Operations (2005)P.O. Box 2000, Ishpeming, MI 49849Tel: 906-475-3400 Website: www.cleveland-cliffs.comFollow a hunk of iron ore, as it is mined and transformed into a taconite or a pelletized ball that is 60% iron, whichthen goes on to become the steel used in automobiles, rail lines, buildings, and many more of our everyday products.This video is better for older students. Michigan-based.HANDS-ON TEACHING SUPPLIESLake Superior Floor Map – this 12’ x <strong>15</strong>’ cloth map which lays on the floor can be used to teach students of all ages(with shoes off!) about watersheds, Lake Superior geography, food chains, and much more. Includes laminated labelsfor states, countries, cities, and the Geography Concentration game found in Lake Effects, as well as the supplies forCooperative Cleanup, an activity also described in Lake Effects.<strong>Great</strong> <strong>Lakes</strong> Floor Map - this <strong>15</strong>’ x 20’ cloth map which lays on the floor can be used to teach students of all ages(with shoes off!) about the <strong>Great</strong> <strong>Lakes</strong> watershed, shipping, geography, and much more. Includes laminated labels forstates, countries, and the cities listed as shipping and receiving ports by the Lake Carriers’ Association.Samples of western, low-sulfur coal from the Powder River Basin of Wyoming and MontanaSamples of taconite iron pellets from Hibbing, MN3 wooden ship models of “lakers” and a tugboat52 playing cards of <strong>Great</strong> <strong>Lakes</strong> ships40 Creature Cards from <strong>Great</strong> <strong>Lakes</strong> in My World2” x 4” stamp of the Duluth Lift Bridge and a freighter entering the Port of DuluthInflatable globe500 piece <strong>Great</strong> <strong>Lakes</strong> Puzzle 18” x 24”More Legends of the <strong>Great</strong> <strong>Lakes</strong> CD (2001) by Carl Behrend. www.greatlakeslegends.comWhatever Floats Your Boat – Designing Your Own Edmund Fitzgerald by Kathleen Sparling, Michigan Earth ScienceTeachers Association (MESTA). Contains a lesson, iron ore sample, and 5 cannisters of taconite pellets. In the lesson,student design an ore boat, build it, and test it using iron pellets (taconite), the cargo carried by the Edmund Fitzgerald.Student use charts of shipping routes and port cities to calculate distances and shipping time. Addresses math, socialstudies, and physical science curriculum benchmarks.Weather or Not To Go by Kathleen Sparling, Michigan Earth Science Teachers Association (MESTA). In the lesson,students examine weather patterns, maps, and forecasts to determine whether it is safe to travel on the <strong>Great</strong> <strong>Lakes</strong>.CURRICULUM MATERIALSExploring the <strong>Great</strong> <strong>Lakes</strong>: A Logbook of Adventures by Patricia Westfield and Nan Soper (2003)A perfect guide for teaching about the <strong>Great</strong> <strong>Lakes</strong>. Includes information, activities, and reproducible worksheets onthe <strong>Great</strong> <strong>Lakes</strong>, including geography, history, shipping and commerce, folklore, environmental issues, and a fold-outmap of the lakes, along with mapping activities. A CD-ROM includes video selections of Niagara Falls, locks and13
canals, ships, lighthouses, and much more. Exploring the <strong>Great</strong> <strong>Lakes</strong> leads young learners through the five themes ofgeography in a lively and relevant way, helping them link their new knowledge to their personal lives, as well ashelping them understand the lakes' importance to the region and to the nation. Recommended for ages 8 and up. Spiralbound. 64 pages.Global Change in the <strong>Great</strong> <strong>Lakes</strong> Scenarios (addresses 10 topics; Scenario #3 is on <strong>Great</strong> <strong>Lakes</strong> Shipping). (1991) byRosanne Fortner. Ohio Sea Grant Education Program at Ohio State University. This series of short publications wasdesigned to help people understand how global change may affect the <strong>Great</strong> <strong>Lakes</strong> region. Scenarios address: climatechange models, effect on water resources, shipping, biological diversity, agriculture, air toxins, eutrophication, fish,recreation, and forests. The scenarios are written in terms the general public can understand, and their content has beenreviewed by a panel of experts.<strong>Great</strong> <strong>Lakes</strong> in My WorldAlliance for the <strong>Great</strong> <strong>Lakes</strong> (Contact: Stephanie Smith , Alliance for the <strong>Great</strong> <strong>Lakes</strong>http://www.greatlakes.org/ Tel: 312-939-0838). A collection of lessons related to the ecology and stewardship of the<strong>Great</strong> <strong>Lakes</strong>, includes 40 creature cards of <strong>Great</strong> <strong>Lakes</strong> plants and animals, natural and exotic.<strong>Great</strong> <strong>Lakes</strong> Shipping: Earth Systems Eduction Activites for <strong>Great</strong> <strong>Lakes</strong> Schools. (1997) Edited by Rosanne Fortner.Ohio Seagrant (http://www-ohiosg.osc.edu ). Provides eleven lessons related to shipping, world connections, cultures,<strong>Great</strong> <strong>Lakes</strong> triangle and canals in Ohio.Lake Effects: The Lake Superior Curriculum Guide for Grades K-8 (1998)The Lake Superior Center/<strong>Great</strong> <strong>Lakes</strong> Aquarium,353 Harbor Drive Duluth, MN 55802A collection of lessons related to the history, geography, management and stewardship of the <strong>Great</strong> <strong>Lakes</strong> and LakeSuperior. To order, call: 218 740.3474 or view: http://www.glaquarium.org/.Lake Rhymes – Folk Songs of the <strong>Great</strong> <strong>Lakes</strong> Region CD & Book by Lee and Joann Murdock. (2004)This 18-song CD with 71 minutes of Lee Murdock performance includes a 146-page book containing musical scoresfor all 18 songs, plus over 70 historic photos, maps and illustrations. In addition, the book explains the stories behindeach song, plus ideas for using the songs to teach history, English, music and geography. Ideal for those who interestedin the <strong>Great</strong> <strong>Lakes</strong> maritime history or traditional folk music.Life of the <strong>Lakes</strong>: The world’s greatest fishery by Shari Dann, Michigan Sea Grant Extension and Michigan StateUniv. Describes the life history of lake trout, their food web, past, present and future management.Paddle to the Sea Curriculum Activities by Marcia Seager and Rosane Fortner of Ohio State University and teacher,Timothy Taylor of Muskingum County Schools. Contains 40 classroom activities that can be taught while reading thebook. Activities are on <strong>Great</strong> <strong>Lakes</strong> geography, shipping (travel math, buoys, how locks work), lake ecosystems, andstewardship which can be taught in science, social studies, language arts, and math classes. Grades 2-6.14
Appendix F<strong>Great</strong> <strong>Lakes</strong> Shipping: Did You Know QuizHow many of the following questions can you answer correctly? Are you a:Deck Hand = 25% correct (5 correct answers) You’re heading for a shipwreck!!First Mate = 50% correctEngineer = 75% correctCaptain = 100% correct(10 correct answers) Get the books out and study up!(<strong>15</strong> correct answers) Good job!(20 correct answers) WOW!!1. A 1000-foot “laker” can hold enough iron pellets to make how many automobiles in the U.S.?a. 500b. 5,000c. <strong>15</strong>,000d. 1 million2. What percentage of the United State’s iron ore used in steel production passes through the Poe lockat Sault Ste. Marie, Michigan?i. 10%ii. 25%iii. 90%iv. None3. Which of the following make up “The Big Three” cargoes carried by U.S.–Flag lakers in order oftonnage on the <strong>Great</strong> <strong>Lakes</strong>?i. Coalii. Stoneiii. Pelletized iron ore (taconite pellets)iv. Saltv. Grainvi. Liquid bulk (oil and gasoline)4. The “head of the lakes” refers to which city?a. Chicagob. Sault Ste. Mariec. Montreal/Quebecd. Duluth5. In which year was the first lock constructed on the St. Mary’s River to allow boat passage around theSt. Mary’s rapids?1798 1850 1895 1959<strong>15</strong>
6. What is “Operation Taconite” run by the Coast Guard at Sault Ste. Marie, Michigan?7. What was the name of the first sailing vessel on the <strong>Great</strong> <strong>Lakes</strong>?The Griffin The Invincible Lady Elgin Mayflower8. Which President ordered the current Whitefish Point Lighthouse to be built?9. Which of the Soo Locks is the longest and most used today?10. Why did Mr. Carlson, the lighthouse keeper at Whitefish Point in 1918, have the assistant lighthousekeeper and his wife turned over to authorities?11. When does a 1,000-foot laker hog, sag or list?12. What does it mean when a large ocean-going vessel (saltie) must “swish and spit” just like you do whenthe dentist cleans your teeth?a. That all the crew have to go brush their teeth right away.b. It’s time for the crew to wash the ship by “swishing” water over the deck and polishing it to a “spit”shine.c. The water in the ballast tanks needs to be exchanged, either saltwater for fresh, or freshwater forsaltwater.13. How many crew members does it take to load a 1000-foot laker with a full load?1 10 20 5014. Where is the bell from the Edmund Fitzgerald?a. At the bottom of Lake Superiorb. At the bottom of Lake Michiganc. In the Mariners’ Church in Detroitd. On display at the <strong>Great</strong> <strong>Lakes</strong> Shipwreck Museum at Whitefish Point in Michigan’s UpperPeninsula.16
<strong>15</strong>. What are the top 3 products shipped through the Soo Locks each year?a. Iron ore (taconite)b. limestonec. wheatd. coale. salt16. How many 1000-foot lakers does it take to transport the cargo carried by six 100-car trains or 2,308trucks?a. Oneb. Twoc. Threed. Four17. What is the total drop in elevation from Lake Superior to the Atlantic Ocean?18. What is the drop in elevation between each of the <strong>Great</strong> <strong>Lakes</strong>?Lake Superior to Lake HuronLake Huron to Lake ErieLake Erie to Lake OntarioLake Ontario to Montreal (St. Lawrence Seaway)________________________19. During which month has there been the greatest number of shipwrecks?20. What is the total number of lives lost on the <strong>Great</strong> <strong>Lakes</strong> in shipping-related casualties in recordedhistory?500 2,000 10,000 30,000 50,000(Questions 1-10 and 16-20 by Joan Chadde; questions 11-13 by Katherine Roll; questions 14-16 by Lisa Bircher)17
<strong>Great</strong> <strong>Lakes</strong> Shipping: Did You Know Quiz - ANSWERSHow many of the following questions can you answer correctly? Find out if you are a:Deck Hand = 25% correct (5 correct answers) You’re heading for a shipwreck!!First Mate = 50% correctEngineer = 75% correctCaptain = 100% correct(10 correct answers) Get the books out and study up!(<strong>15</strong> correct answers) Good job!(20 correct answers) WOW!!1. A 1000-foot “laker” can hold enough iron taconite pellets to make how many automobiles in the U.S.?a. <strong>15</strong>,0002. What percentage of the United State’s iron ore used in steel production passes through the Poe lock at SaultSte. Marie, Michigan?a. 90%3. Which of the following make up “The Big Three” cargoes carried by U.S.–Flag lakers in order of tonnage onthe <strong>Great</strong> <strong>Lakes</strong>?i. Coal = #3ii. Stone = #2iii. Pelletized iron ore (taconite pellets) = #14. The “head of the lakes” refers to which city?Duluth5. In which year was the first lock constructed on the St. Mary’s River to allow boat passage around the St.Mary’s rapids? 1798 (can now be seen outside the St. Mary’s Paper Company in Sault Ste Marie, ON)6. What is “Operation Taconite” run by the Coast Guard at Sault Ste. Marie, Michigan?i. The largest ice-breaking operation in the United States.7. What was the name of the first sailing vessel on the <strong>Great</strong> <strong>Lakes</strong>? The Griffin (1679)8. Which President ordered the current Whitefish Point Lighthouse to be built? President Lincoln9. Which of the Soo Lock is the longest and most used today? Poe lock10. Why did Mr. Carlson, the lighthouse keeper at Whitefish Point in 1918, have the assistant lighthouse keeperand his wife (both German) turned over to authorities? He overheard their plan to disable the WhitefishPoint light in order to stop iron ore shipments through the Soo Locks that were aiding the UnitedStates' efforts in WW I !!11. When does a 1,000-foot “laker” hog, sag or list?Answer: When it is improperly loaded. A 1,000 foot laker is much like a tippy canoe. It is essential that it be properlyloaded with cargo to distribute the weight. It can “list” dangerously to one side and tip over, in much the same way acanoe would. Improper loading can also cause a vessel to “hog” creating a convex curve in the hull, or “sag” creating aconcave curve in the hull.18
Properly Loaded Ship Listing ShipHOGGINGSAGGINGLoad Load Load12. What does it mean when a large ocean-going vessel (saltie) must “swish and spit” just like you do when the dentistcleans your teeth?c. The water in the ballast tanks needs to be exchanged, either saltwater for fresh, or freshwater forsaltwater. By exchanging fresh ballast water for saltwater in the ocean, an ocean-going vessel can almostcompletely avoid bringing non-native, invasive species from ocean ports to the <strong>Great</strong> <strong>Lakes</strong>.13. How many crew members does it take to load a 1000-foot laker with a full load?Answer: Just one! Due to advances in technology a large ship can be loaded by one crew memberusing remote control (self-loader and self-unloader).14. Where is the bell from the Edmund Fitzgerald?d. On display at the <strong>Great</strong> <strong>Lakes</strong> Shipwreck Museum at Whitefish Point in Michigan’s Upper Peninsula.<strong>15</strong>. What are the top 3 products shipped through the Soo Locks each year?a. Iron ore (taconite) = 74%c. wheat = 11%d. coal = 6%16. How many 1000-foot lakers does it take to carry the cargo carried by six 100-car trains (10,000-ton capacity each)or 2,308 (26-ton capacity) trucks?a. One (a 1000-foot laker carries 60,000 tons)17. What is the total drop in elevation from Lake Superior to the Atlantic Ocean?Lake Superior is 640 feet above the Atlantic Ocean.18. What is the drop in elevation between each of the <strong>Great</strong> <strong>Lakes</strong>?Lake Superior to Lake Huron 21 feetLake Huron to Lake Erie 12 feetLake Erie to Lake Ontario 326 feetLake Ontario to Montreal 224 feet(Totals 583 feet)19. During which month has there been the greatest number of shipwrecks?From 1800-1975, 140 shipwrecks have occurred on the <strong>Great</strong> <strong>Lakes</strong> during the month of November;40 were on Lake Superior and 38 were on Lake Huron.20. What is the total number of lives lost on the <strong>Great</strong> <strong>Lakes</strong> in shipping-related casualties in recorded history? 30,000(Questions 1-10 and 16-20 by Joan Chadde; questions 11-13 by Katherine Roll; questions 14-16 by Lisa Bircher)19
Appendix G<strong>Great</strong> <strong>Lakes</strong> <strong>Maritime</strong> Shipping VocabularyAftAid to navigationBallastBeaconBearingBerthBowBroachBuoyCargoChannelChartCommodityCourseBehind or backDevice that is external to the vessel whose purpose is to assist a navigator to determineposition.Weight added to lower a ship in the water making it less top heavy when travelingwithout cargo. Fresh or salt water are most commonly used.Light to aid navigation.The direction to an object as measured from the boat.A place where a ship anchors or ties up to a dock.The front of the ship.When a vessel rolls onto its sideA floating object moored to the bottom to mark a channel to aid to navigation.Goods carried by a ship. General cargo is boxed, bagged, crated or on a pallet. Bulkcargo is loose---usually granular, such as grain, iron ore, taconite pellets, or coal.The deeper part of a river or harbor for ships to pass through; a route between twobodies of water.Nautical version of a highway road map.Anything that is bought and sold.Direction in which a boat is intended to be steered.Danger signal on a shipFive short toots.Day beaconDeckDockElevatorExportUnlighted fixed aid to navigation.Flat surface on the upper part of the ship where the crew and passengers can walk.Passenger ships have several decks, whereas a cargo ship (freighter) may have onlyone deck.A long platform built next to the water as a landing place for ships.A building for storing grain.To send goods from one country for sale in another.20
FoghornGreenhouse gasGroundedHarborHatchHeadHeadingHoggingHullImportA horn blown during foggy weather to warn ships of danger.Gases in the atmosphere, including increased carbon dioxide, methane, ozone, andfluorocarbons that contribute to global warming and may result in greater evaporationfrom the <strong>Great</strong> <strong>Lakes</strong>.When a ship runs aground in shallow waters or on rocky outcrops.A place where ships may anchor.Doorway on a vessel. Hatchcovers are on the deck of a freighter where the vessel isloaded with cargo.Bathroom on a vessel.The direction the boat is pointing.Improper loading can cause a vessel to “hog” creating a convex curve in the hull.Lowermost portion of a ship floating partially submerged.To bring goods into one country from another.Inter-modal transport Moving cargo using more than one mode, such as truck, railway, ship, or plane.Invasive speciesLeg of a journeyLighthousesLineListingLocksLongshoreman<strong>Maritime</strong><strong>Maritime</strong> shippingNatural resourcesNon-native species that are transported to a new area that typically have no naturalpredators (ex: zebra mussels).Portion of a trip.Mark entrances to harbors, and warn ship captains where there are dangerous shallowwaters or other obstructions.All ropes on a vessel are called lines.Tipping to the sideA section of a waterway, in which gates are used to raise or lower the water level toallow ships to move between water bodies of different elevations.A person who works on the waterfront loading and unloading ships.Anything having to do with water bodies or the sea; nautical.Transportation of cargo via waterways.Useful materials found in nature21
RadarPilothousePortQuarryRangeSaggingShipping routeShippingStarboardSternTaconiteTonTrackTugboatsU.S. Coast GuardVesselRadar helps ships find their way in the dark or in the fog.Enclosed structure on the dick of a ship from which it can be navigated.1. A city or town with a harbor for loading/unloading ships.2. Left-hand side of a vessel, facing forward.Limestone and other stone used in construction and steel-making is mined fromquarries and loaded into <strong>Great</strong> <strong>Lakes</strong> ships.Two visible objects in a line, or the distance to an objectImproper loading can cause a vessel to “sag” creating a concave curve in the hull.Route which a freighter travels from one port to another.Transportation of cargo via water, road, rail or airplane using a freighter, train, truck,or plane.The right-hand side of a vessel, facing forward.Back of the shipIron ore that is refined and formed into small marble-sized pelletsA unit of weight equivalent to 2,000 pounds.The path the boat has actually followed.Help move ships around in harbors or rivers.Protects the <strong>Great</strong> <strong>Lakes</strong> in a variety of ways including environmental management(pollution spills, invasive species, etc.), security, navigation of foreign vessels, andsearch & rescue. Grand Haven, Michigan is Coast Guard City, U.S.A.A broad term for any watercraft.22