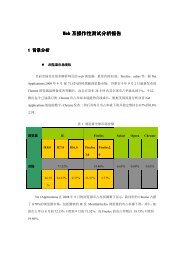
RHEL Kernel Performance Optimization, Characterization ... - Red Hat
RHEL Kernel Performance Optimization, Characterization ... - Red Hat
RHEL Kernel Performance Optimization, Characterization ... - Red Hat
- No tags were found...

You also want an ePaper? Increase the reach of your titles
YUMPU automatically turns print PDFs into web optimized ePapers that Google loves.
IncomesExpendituresDonkey owned 0.7 0.8 0.9 0.6 1.3 1.0 1.5 1.5Goat owned 0.0 0.0 0.3 0.7 0.0 0.0 1.7 4.1Sheep owned 0.2 0.4 1.6 2.3 3.4 4.0 2.5 4.7Edir * 105.6 144.6 99.0 92.9 36.0 28.5 66.0 31.7Ekub * 260.0 418.6 600.0 1111.0 1093.8 1063.1 0.0 0.0School expenses * 100.8 138.2 100.0 148.5 948.8 652.9 2130.0 2370.9* Numbers reflect currency in Ethiopian Birr (ETB). Exchange rates at the time of fieldworkaveraged 12.5 ETB per 1 USDBetter off households consume 130% of minimum household caloric requirements and grow90% of their calories (Table 4). While mean landholdings are only marginally larger thanmedium-ranked households, these households typically own higher quality land and can investcapital in wheat production, which yields higher profit margins than maize or potatoes. Betteroff household also typically have steel roofs that enhance storage capacity. Households canpurchase supplementary maize when prices are lowest and store it for consumption or resaleduring the lean seasons. Fuelwood sales among better off households contribute the least toincomes of any wealth group in absolute and relative terms (Figure 7). Expenditures oneducation are significant for better-off households, with most households sending students tohigh school and sometimes college.Figure 7: Household Incomes and Expenditures by Wealth GroupVery Poor Poor Medium Better offTotal Birr: 3591 Total Birr: 6110 Total Birr: 6558 Total Birr: 7416Total Birr: 3225 Total Birr: 4965 Total Birr: 8084 Total Birr: 842813