Create successful ePaper yourself
Turn your PDF publications into a flip-book with our unique Google optimized e-Paper software.
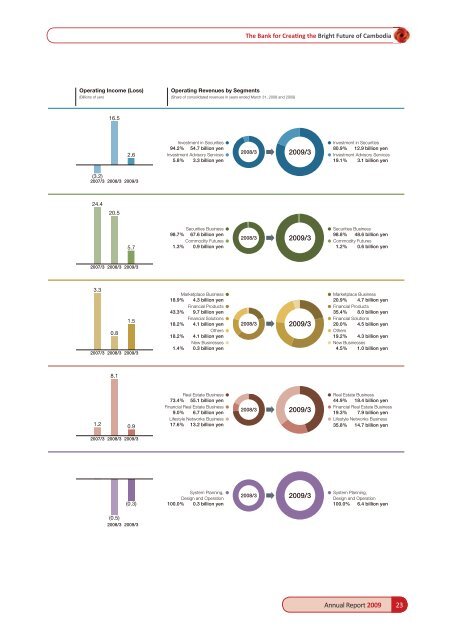
Operating Income (Loss)(Billions of yen)Operating Revenues by Segments(Share of consolidated revenues in years ended March 31, 2008 and 2009)16.52.6Investment in Securities 94.2% 54.7 billion yenInvestment Advisory Services 5.8% 3.3 billion yen2008/3 2009/3 Investment in Securities80.9% 12.9 billion yen Investment Advisory Services19.1% 3.1 billion yen(3.2)2007/3 2008/3 2009/324.420.55.7Securities Business 98.7% 67.6 billion yenCommodity Futures 1.3% 0.9 billion yen2008/3 2009/3 Securities Business98.8% 48.6 billion yen Commodity Futures1.2% 0.6 billion yen2007/3 2008/3 2009/33.31.50.82007/3 2008/3 2009/3Marketplace Business 18.9% 4.3 billion yenFinancial Products 43.3% 9.7 billion yenFinancial Solutions 18.2% 4.1 billion yenOthers 18.2% 4.1 billion yenNew Businesses 1.4% 0.3 billion yen2008/3 2009/3 Marketplace Business20.9% 4.7 billion yen Financial Products35.4% 8.0 billion yen Financial Solutions20.0% 4.5 billion yen Others19.2% 4.3 billion yen New Businesses4.5% 1.0 billion yen8.11.20.9Real Estate Business 73.4% 55.1 billion yenFinancial Real Estate Business 9.0% 6.7 billion yenLifestyle Networks Business 17.6% 13.2 billion yen2008/3 2009/3 Real Estate Business44.9% 18.4 billion yen Financial Real Estate Business19.3% 7.9 billion yen Lifestyle Networks Business35.8% 14.7 billion yen2007/3 2008/3 2009/3(0.3)System Planning, Design and Operation100.0% 0.3 billion yen2008/3 2009/3 System Planning,Design and Operation100.0% 6.4 billion yen(0.5)2008/3 2009/3Annual Report 2009 23


