

Summary - People.stat.sfu.ca - Simon Fraser University
Summary - People.stat.sfu.ca - Simon Fraser University
Summary - People.stat.sfu.ca - Simon Fraser University

You also want an ePaper? Increase the reach of your titles
YUMPU automatically turns print PDFs into web optimized ePapers that Google loves.
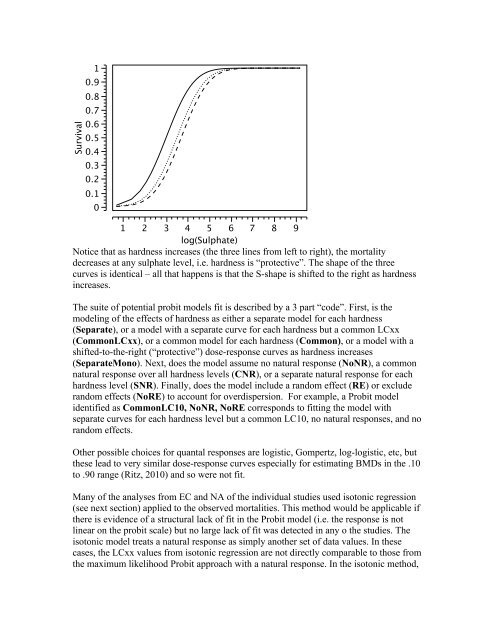
Survival10.90.80.70.60.50.40.30.20.101 2 3 4 5 6 7 8 9log(Sulphate)Notice that as hardness increases (the three lines from left to right), the mortalitydecreases at any sulphate level, i.e. hardness is “protective”. The shape of the threecurves is identi<strong>ca</strong>l – all that happens is that the S-shape is shifted to the right as hardnessincreases.The suite of potential probit models fit is described by a 3 part “code”. First, is themodeling of the effects of hardness as either a separate model for each hardness(Separate), or a model with a separate curve for each hardness but a common LCxx(CommonLCxx), or a common model for each hardness (Common), or a model with ashifted-to-the-right (“protective”) dose-response curves as hardness increases(SeparateMono). Next, does the model assume no natural response (NoNR), a commonnatural response over all hardness levels (CNR), or a separate natural response for eachhardness level (SNR). Finally, does the model include a random effect (RE) or excluderandom effects (NoRE) to account for overdispersion. For example, a Probit modelidentified as CommonLC10, NoNR, NoRE corresponds to fitting the model withseparate curves for each hardness level but a common LC10, no natural responses, and norandom effects.Other possible choices for quantal responses are logistic, Gompertz, log-logistic, etc, butthese lead to very similar dose-response curves especially for estimating BMDs in the .10to .90 range (Ritz, 2010) and so were not fit.Many of the analyses from EC and NA of the individual studies used isotonic regression(see next section) applied to the observed mortalities. This method would be appli<strong>ca</strong>ble ifthere is evidence of a structural lack of fit in the Probit model (i.e. the response is notlinear on the probit s<strong>ca</strong>le) but no large lack of fit was detected in any o the studies. Theisotonic model treats a natural response as simply another set of data values. In these<strong>ca</strong>ses, the LCxx values from isotonic regression are not directly comparable to those fromthe maximum likelihood Probit approach with a natural response. In the isotonic method,


