Estimations of generic drug entry in Brazil using count ... - EPGE/FGV
Estimations of generic drug entry in Brazil using count ... - EPGE/FGV
Estimations of generic drug entry in Brazil using count ... - EPGE/FGV

Create successful ePaper yourself
Turn your PDF publications into a flip-book with our unique Google optimized e-Paper software.
<strong>Estimations</strong> <strong>of</strong> <strong>generic</strong> <strong>drug</strong> <strong>entry</strong> <strong>in</strong> <strong>Brazil</strong> us<strong>in</strong>g<strong>count</strong> vs. ordered modelsEduardo P.S. Fiuza IPEABarbara CaballeroIPEAMay 21, 2009AbstractTwo major changes <strong>in</strong> <strong>Brazil</strong>ian legislation dur<strong>in</strong>g the 1990s reshaped the localpharmaceutical <strong>in</strong>dustry: the rati…cation <strong>of</strong> the TRIPs agreement <strong>in</strong>clud<strong>in</strong>g aprovision for pipel<strong>in</strong>e <strong>in</strong>ventions <strong>in</strong> 1996, and a Generic Drug Act <strong>in</strong> 1999, which<strong>in</strong>troduced bioequivalence tests and facilitated <strong>generic</strong> <strong>drug</strong>s’ substitution for thepioneer <strong>drug</strong>s at dispens<strong>in</strong>g. Price controls were gradually resumed <strong>in</strong> the turn<strong>of</strong> the century. Genu<strong>in</strong>e <strong>generic</strong> <strong>drug</strong> <strong>entry</strong> may therefore be dated back to 2000,when the …rst applications were approved. The present article estimates <strong>entry</strong> <strong>of</strong><strong>generic</strong> versions <strong>of</strong> o¤-patent <strong>drug</strong>s <strong>in</strong>to the various therapeutic classes us<strong>in</strong>g both<strong>count</strong> data and ordered mult<strong>in</strong>omial models. Results po<strong>in</strong>t out that a simple Poissonmodel …ts the data poorly, call<strong>in</strong>g for further modell<strong>in</strong>g <strong>of</strong> overdispersion or <strong>of</strong>excess zeros by apply<strong>in</strong>g Negative B<strong>in</strong>omial and zero-<strong>in</strong>‡ated <strong>count</strong> models. Orderedmodels, however, seem to provide the best …t <strong>of</strong> all. Most <strong>of</strong> the expla<strong>in</strong><strong>in</strong>gvariables utilized are signi…cant, <strong>in</strong> particular lagged values <strong>of</strong> the revenues <strong>of</strong> the<strong>drug</strong> (proxy for potential market), number <strong>of</strong> own brands <strong>of</strong> the orig<strong>in</strong>ator’s group,market concentration, and age <strong>of</strong> the pioneer <strong>drug</strong>. Av Pres. Antonio Carlos, 51 - 17o andar; Rio de Janeiro-RJ 20.020-010 - <strong>Brazil</strong>. E-mail (correspond<strong>in</strong>gauthor): eduardo.…uza AT ipea.gov.br. We thank Carla Marigo and Leticia Klotz for valuable help,and Anvisa’s sta¤, <strong>Brazil</strong>ian M<strong>in</strong>istries <strong>of</strong> F<strong>in</strong>ance and Justice, Leandro Safatle and his team, Grupemef,and ABCFarma for data and advice. F<strong>in</strong>ancial and material supports were provided by CNPq (GrantsPQ 311766/2006-4 and IC 503122/2007-6), CIEE, Ipea’s Program for Development Studies (PNPD) andM<strong>in</strong>istry <strong>of</strong> Justice (Convenio MJ 01/2006), all <strong>of</strong> them gratefully acknowledged.1
1 IntroductionThe present work is the …rst estimation <strong>of</strong> <strong>generic</strong> <strong>drug</strong> <strong>entry</strong> models <strong>in</strong> <strong>Brazil</strong>. The<strong>Brazil</strong>ian market is <strong>of</strong> <strong>in</strong>terest because <strong>of</strong> its size (tenth largest <strong>in</strong> the world) and because<strong>of</strong> two major changes <strong>in</strong> <strong>Brazil</strong>ian legislation dur<strong>in</strong>g the 1990s that reshaped thelocal pharmaceutical <strong>in</strong>dustry. The …rst one was the rati…cation <strong>of</strong> the TRIPs agreementpassed by the Congress <strong>in</strong> 1996, which <strong>in</strong>cluded a provision for pipel<strong>in</strong>e <strong>in</strong>ventions. Thesecond one was the Generic Drug Act <strong>in</strong> 1999, which <strong>in</strong>troduced bioequivalence tests andfacilitated <strong>generic</strong> <strong>drug</strong>s’substitution for the pioneer <strong>drug</strong>s at dispens<strong>in</strong>g. Price controlswere gradually resumed <strong>in</strong> the turn <strong>of</strong> the century follow<strong>in</strong>g exchange rate steep depreciation.Genu<strong>in</strong>e <strong>generic</strong> <strong>drug</strong> <strong>entry</strong> may therefore be dated back to 2000, when the …rstapplications were approved.The present article estimates <strong>entry</strong> <strong>of</strong> <strong>generic</strong> versions <strong>of</strong> o¤-patent <strong>drug</strong>s <strong>in</strong>to the varioustherapeutic classes us<strong>in</strong>g both <strong>count</strong> data and ordered mult<strong>in</strong>omial models. Resultspo<strong>in</strong>t out that a simple Poisson model …ts the data poorly, call<strong>in</strong>g for further modell<strong>in</strong>g <strong>of</strong>overdispersion or <strong>of</strong> excess zeros by apply<strong>in</strong>g Negative B<strong>in</strong>omial and zero-<strong>in</strong>‡ated <strong>count</strong>models. Most <strong>of</strong> the expla<strong>in</strong><strong>in</strong>g variables utilized are signi…cant, <strong>in</strong> particular the laggedvalues <strong>of</strong> the revenues <strong>of</strong> the <strong>drug</strong> (proxy for potential market), <strong>of</strong> the number <strong>of</strong> own<strong>generic</strong>s and other brands <strong>of</strong> the orig<strong>in</strong>ator’s group, and <strong>of</strong> the market concentration, andthe age <strong>of</strong> the pioneer <strong>drug</strong>. In the ordered models signi…cance and signs are similar to the<strong>count</strong> models. Marg<strong>in</strong>al e¤ects <strong>of</strong> the expla<strong>in</strong><strong>in</strong>g variables are dampened as the number<strong>of</strong> entries <strong>in</strong>creases.The present article features four more sections. Next one br<strong>in</strong>gs a short description <strong>of</strong>the <strong>Brazil</strong>ian pharmaceutical market and <strong>of</strong> its regulation. The follow<strong>in</strong>g section surveysprevious attempts to estimate empirically <strong>drug</strong> <strong>entry</strong>, with emphasis on <strong>generic</strong>s, and<strong>in</strong>troduces the model. The fourth section presents the results, performs diagnostic testsand discusses the results. The last section concludes.2 The <strong>Brazil</strong>ian market<strong>Brazil</strong> is at present the tenth largest market for pharmaceuticals <strong>in</strong> the world. Eventhough sales <strong>in</strong> units (1.8 billion <strong>in</strong> 2008) do not display a clear time trend –they are 2.52
percent below 1997 level, but twenty percent above 2003 level (Febrafarma/Grupemef)–revenues <strong>in</strong> dollars (de‡ated by US and <strong>Brazil</strong>ian price <strong>in</strong>dexes) <strong>in</strong>creased 2.35 percenta year dur<strong>in</strong>g the same elapsed time. Revenues <strong>in</strong> local currency (de‡ated by <strong>Brazil</strong>iangeneral price <strong>in</strong>dex) have also been steadily <strong>in</strong>creas<strong>in</strong>g: average 9.9 percent p.a. dur<strong>in</strong>g1997-2008 (Febrafarma/Grupemef), but the ratio sales/Total <strong>Brazil</strong>ian GDP <strong>in</strong> nom<strong>in</strong>alvalues has been oscilat<strong>in</strong>g <strong>in</strong> the percentual range [0.9,1.11], an average 1.05 percent dur<strong>in</strong>gthe same period.As <strong>in</strong> developed <strong>count</strong>ries, sales <strong>in</strong> value <strong>in</strong>crease more than units because <strong>of</strong> di¤erences<strong>in</strong> the mix <strong>of</strong> <strong>drug</strong>s consumed. As more expensive <strong>drug</strong>s are launched, prices go up. Onthe other hand, two forces have kept prices down. For one, a severe price control wasgradually resumed <strong>in</strong> the …rst years <strong>of</strong> the century, more <strong>in</strong>genious and comprehensivethan its <strong>count</strong>erpart adopted dur<strong>in</strong>g the 1970s and 1980s. Second, a new strategy <strong>of</strong>promot<strong>in</strong>g nonproprietary names has successfully been pursued s<strong>in</strong>ce 2000. In fact, <strong>generic</strong><strong>drug</strong>s achieved <strong>in</strong> 2008 a 13.8 percent market share <strong>in</strong> value, 16.9 percent <strong>in</strong> volume (IMSHealth apud Pro-Genérico). It is not a bad record if one takes <strong>in</strong>to ac<strong>count</strong> <strong>generic</strong> <strong>drug</strong>s’<strong>in</strong>fancy <strong>in</strong> the <strong>count</strong>ry. Table 1 provides for comparison with other selected <strong>count</strong>ries withtradition <strong>in</strong> <strong>generic</strong> <strong>drug</strong>s.INSERT TABLE 1 ABOUT HERETo better understand how the <strong>Brazil</strong>ian market functions, a brief historical summaryis useful. Price controls and absence <strong>of</strong> patent enforcement were the ma<strong>in</strong> strategies <strong>of</strong> themilitary government s<strong>in</strong>ce the beg<strong>in</strong>n<strong>in</strong>g <strong>of</strong> the 1970s. On the one hand, an import substitutionattempt required that foreign patents were not recognized by <strong>Brazil</strong>ian law. Infact, chemical-pharmaceutical product patents were not enforced s<strong>in</strong>ce 1945, and processpatents were also revoked <strong>in</strong> 1969. On the other hand, macroeconomic policy <strong>in</strong> <strong>Brazil</strong> fostered<strong>in</strong>‡ation and led authorities to adopt price controls <strong>count</strong>ervail<strong>in</strong>g measures. Pricecontrols, however, were <strong>in</strong> part circumvented by the pharmaceutical …rms by <strong>in</strong>troduc<strong>in</strong>gnew packages, whose prices were not subject to scrut<strong>in</strong>y.The 1990s were a time <strong>of</strong> major transformations <strong>in</strong> the <strong>Brazil</strong>ian market. Price controlsas a whole were replaced by a modern Antitrust legislation. A new Antitrust Actwas passed <strong>in</strong> 1993, and subsequently reformed <strong>in</strong> 1994 (Lei 8884). Pharmaceutical <strong>drug</strong>price controls were phased out <strong>in</strong> 1992, and a series <strong>of</strong> price hikes followed. Antitrust3
<strong>in</strong>vestigations for "abusive price <strong>in</strong>creases" were at that time …led at the Antitrust Tribunal(CADE) – a terrible public misunderstand<strong>in</strong>g <strong>of</strong> the spirit <strong>of</strong> the new Antitrustlegislation. As regards import substitution, the process was also reversed. Import tari¤shad already been lowered, and non-tari¤ barriers dismantled, beg<strong>in</strong>n<strong>in</strong>g <strong>in</strong> 1989. Localcontent <strong>in</strong> <strong>drug</strong>s marketed <strong>in</strong> <strong>Brazil</strong> consequently tumbled.In 1996 a radical turn <strong>in</strong> <strong>in</strong>tellectual property protection came out: the World TradeOrganization (WTO) Trade Related Intellectual Property System (TRIPS) agreementfrom the Uruguay Round was …nally rati…ed by the Congress (Lei 9279). This rati…cationbrought back patent enforcement as from 1997. The maximum patent lifetime allowedwas 20 years, but no extension was provisioned (<strong>in</strong> particular, none <strong>of</strong> the extensionsprovisioned by the US Patent Restoration Act <strong>of</strong> 1984). On the other hand, a controversialprovision for pipel<strong>in</strong>e <strong>in</strong>ventions was <strong>in</strong>troduced <strong>in</strong> the legislation: patents depositedunder former rules (Lei 5772, from 1971) and not marketed yet were eligible to requireconvalidation by the <strong>Brazil</strong>ian Patents’O¢ ce; the patent lifetime was subject to the sameexpiration date <strong>of</strong> the …rst patent lifetime abroad, and not exceed<strong>in</strong>g 20 years (upperlimit <strong>of</strong> the <strong>Brazil</strong>ian patent law). Other products already marketed or whose patentshad already expired did not bene…t from this."The <strong>Brazil</strong>ian legislation went much further that what was required by TRIPS and<strong>in</strong>cluded a pipel<strong>in</strong>e provision, where patents claims could be …led <strong>in</strong> the <strong>count</strong>ry between1996 and 1997, allow<strong>in</strong>g the protection <strong>of</strong> pharmaceutical patents that were already …led <strong>in</strong>at least one other <strong>count</strong>ry, without any national exam<strong>in</strong>ation and even if the patent wasprior to TRIPS signature, as long as the product was not yet commercialized anywhere ornobody had done e¤orts <strong>in</strong> the <strong>count</strong>ry for exploration at the time <strong>of</strong> the request." (Chaves& Reis, 2007)Another feature <strong>of</strong> the <strong>Brazil</strong>ian law worth mention<strong>in</strong>g is that pharmaceutical patentsare granted only after registration at Anvisa –the <strong>Brazil</strong>ian equivalent to US FDA –iscleared (Law 10,196 from 2001; <strong>in</strong> force s<strong>in</strong>ce 1999). As such, new <strong>drug</strong>s’ patents arenever scrut<strong>in</strong>ized by Anvisa dur<strong>in</strong>g registration for safety and e¤ectiveness.The other major transformation <strong>in</strong> the 1990s was the enactment <strong>of</strong> the …rst GenericDrug Act <strong>in</strong> 1999. The farthest the previous legislation had reached was requir<strong>in</strong>g anoutstand<strong>in</strong>g disclosure <strong>of</strong> the Active Pharmaceutical Ingredient (API) description belowthe brand name <strong>in</strong> the package, so as to allow for comparison <strong>of</strong> brands. But prescrib<strong>in</strong>g4
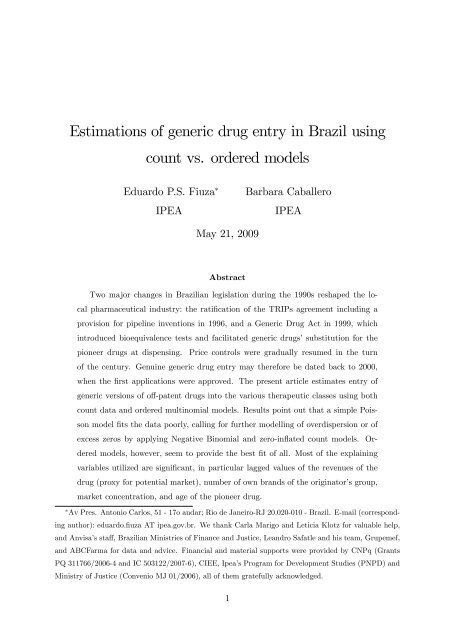
doctors had reason to concern that <strong>drug</strong>s <strong>of</strong> same API were not substitutible to eachother.In fact, until 1999 the registration <strong>of</strong> new <strong>drug</strong>s only required safety tests, and absolutee¤ectiveness; no comparisons were undertaken between <strong>drug</strong>s based on the sameAPI. Generic names were utilized by pharmaceutical companies without demonstrat<strong>in</strong>gbioequivalence. They were actually similar <strong>drug</strong>s. In sum, <strong>Brazil</strong> had only pioneer (notnecessarily orig<strong>in</strong>ator’s) and/or similar (branded or non-branded) versions <strong>of</strong> a same <strong>drug</strong>.The Generic Drug Act (Lei 9787) <strong>in</strong>troduced bioequivalence tests and the <strong>generic</strong> <strong>drug</strong>as bioequivalent. Similar <strong>drug</strong>s were then mandated to adopt brand if they had none.Generic names (either <strong>Brazil</strong>ian or International Non-proprietary Names) have s<strong>in</strong>ce thenbeen allowed only to <strong>drug</strong>s bioequivalent to the pioneer. On the other hand, branded<strong>drug</strong>s may be pioneer (reference) or similar. 1Because <strong>of</strong> the TRIPS rati…cation, both similar and <strong>generic</strong> <strong>drug</strong>s are now only permittedif the orig<strong>in</strong>al <strong>drug</strong> is o¤-patent (i.e. either the patent has already expired or it hasnever been enforced). But it is worth mention<strong>in</strong>g that no exclusiveness period is grantedfor the …rst <strong>generic</strong>, as it happens <strong>in</strong> the US.The …rst <strong>generic</strong> <strong>drug</strong>s were launched <strong>in</strong> 2000. Figure 1 shows the evolution <strong>of</strong> <strong>generic</strong><strong>drug</strong> registrations. Table 2 displays the evolution <strong>of</strong> <strong>drug</strong>s, …rms and package versions.INSERT FIGURE 1 ABOUT HEREINSERT TABLE 2 ABOUT HEREPrice freedom, however, experienced a very short duration. In 1998 prices started be<strong>in</strong>gmonitored by the M<strong>in</strong>istry <strong>of</strong> F<strong>in</strong>ance. In 1999 the local currency’s huge devaluationprompted a negotiation between government and manufacturers to delay the foreign costpassthrough (as most APIs <strong>in</strong> <strong>Brazil</strong> are now imported). Several agreements followed.1 Homedes, L<strong>in</strong>ares and Ugalde [9] report that <strong>in</strong> most Lat<strong>in</strong> American <strong>count</strong>ries (Bolivia, Chile,Colombia, Costa Rica, Ecuador, Nicaragua, Peru and Uruguay) pharmaceuticals are classi…ed under twocategories only: Branded (compris<strong>in</strong>g branded orig<strong>in</strong>als, branded <strong>generic</strong>s and branded similar) versusGenerics (orig<strong>in</strong>al or own <strong>generic</strong>s, copy <strong>generic</strong>s and unbranded similars). Argent<strong>in</strong>a features threecategories: <strong>in</strong>novative (branded orig<strong>in</strong>al or copy), similar (non-bioequivalent), while <strong>generic</strong> applies tobioequivalent <strong>drug</strong>s, both branded and unbranded.5
In December 2000 the government resumed a price control based <strong>in</strong> cost spreadsheets,similarly to the system <strong>in</strong> force dur<strong>in</strong>g the 1970s and 1980s. CAMED, a regulatory boardassembl<strong>in</strong>g m<strong>in</strong>istries <strong>of</strong> Health, F<strong>in</strong>ance and Justice, and Anvisa, was then created. Thesame formula was applied <strong>in</strong> 2001 and 2002. In January 2003 three OTC (i.e., nonprescription)<strong>drug</strong> classes with low concentration levels (as measured by the Her…ndahl-Hirschman – HHI) had their prices released from control. In June 2003 CAMED wasreplaced by CMED (assembl<strong>in</strong>g the same government bodies, plus the Secretariat <strong>of</strong> Governmentand the M<strong>in</strong>istry <strong>of</strong> Industry and Trade) and a unique price cap was <strong>in</strong>troduced,based on the follow<strong>in</strong>g formula:p = CP IX + Y + Zwhere CPI stands for the Consumer Price Index; X is a (prospective) productivity factor;Y is a credit for non-manageable (past) cost raises; and Z allows for di¤erent price raisesaccord<strong>in</strong>g to competition level <strong>in</strong> each therapeutical class market (raise rate is equal forall <strong>drug</strong>s <strong>in</strong> the same class).More importantly, <strong>generic</strong> prices had been follow<strong>in</strong>g an unpublished rule <strong>of</strong> thumb thatentrants should price 35% below the reference <strong>drug</strong> prices; this rule was then o¢ ciallyadopted <strong>in</strong> 2004 by CMED.S<strong>in</strong>ce patents are not subject to so many extensions as <strong>in</strong> the USA 2 and s<strong>in</strong>ce <strong>generic</strong>sare not granted exclusiveness, the ma<strong>in</strong> <strong>entry</strong>-deterrence strategy left <strong>in</strong> <strong>Brazil</strong> for the<strong>in</strong>cumbents (reference <strong>drug</strong> sellers) is to launch follow-on <strong>drug</strong>s (life-cycle strategies, alsoknown as evergreen<strong>in</strong>g), to launch own <strong>generic</strong>s and/or to cross-license their <strong>generic</strong>s.Additional strategies available are the ones already surveyed by the European Commission[6]: strategic patent<strong>in</strong>g (especially patent cluster<strong>in</strong>g); patent litigation; patent settlements;and question<strong>in</strong>g safety <strong>of</strong> <strong>generic</strong>s. The …rst three strategies are more likely to occur andto be e¤ective <strong>in</strong> the upcom<strong>in</strong>g years, when a large wave <strong>of</strong> patents will expire locally.In our sample, follow on <strong>drug</strong>s are already <strong>of</strong> concern: we <strong>count</strong>ed 90 s<strong>in</strong>gle-API <strong>drug</strong>sconta<strong>in</strong><strong>in</strong>g at least one extended-release version, with a distribution rang<strong>in</strong>g from 1 to 15brands per <strong>drug</strong>. As the European Commission puts it: "In a number <strong>of</strong> cases, orig<strong>in</strong>ator2 The US patent legislation, <strong>in</strong>clud<strong>in</strong>g the 1984 Hatch-Waxman Act, provided for several <strong>entry</strong>deterrencestrategies. A useful source about these strategies is the Federal Trade Commission 2002special report [7].6
companies tried to switch patients <strong>of</strong> their medic<strong>in</strong>e fac<strong>in</strong>g imm<strong>in</strong>ent loss <strong>of</strong> exclusivityto a so-called second generation, or follow-on, medic<strong>in</strong>e. (...) In some cases, the …rstmedic<strong>in</strong>e was withdrawn from the market some months after the launch <strong>of</strong> the secondgeneration medic<strong>in</strong>e. If orig<strong>in</strong>ator companies succeed <strong>in</strong> switch<strong>in</strong>g patients by that po<strong>in</strong>t,the probability that <strong>generic</strong> companies will be able to ga<strong>in</strong> a signi…cant share <strong>of</strong> the marketdecreases signi…cantly. If, on the other hand, <strong>generic</strong> companies enter the market beforethe patients are switched, orig<strong>in</strong>ator companies have di¢ culties <strong>in</strong> conv<strong>in</strong>c<strong>in</strong>g doctors toprescribe their second generation medic<strong>in</strong>e and/or obta<strong>in</strong> a high price for it." [6] . It isalso worth not<strong>in</strong>g that <strong>in</strong> <strong>Brazil</strong> the regulator has to elect a new reference <strong>drug</strong> whenthe orig<strong>in</strong>al one is discont<strong>in</strong>ued, and this may a¤ect the bioequivalence status <strong>of</strong> exist<strong>in</strong>g<strong>generic</strong>s.Regard<strong>in</strong>g own <strong>generic</strong>s, we detected <strong>in</strong> our sample 37 <strong>generic</strong>s belong<strong>in</strong>g to their respectivereference <strong>drug</strong> seller groups (<strong>in</strong> 34 s<strong>in</strong>gle-API <strong>drug</strong>s, as some sellers market <strong>generic</strong>sunder di¤erent umbrella brands). Moreover, many unnoti…ed co-market<strong>in</strong>g agreementshave been discovered by antitrust authorities, but the registration department at Anvisahas not been able to keep track <strong>of</strong> them. This is an important antitrust issue, because…rms may divide their markets among them. An attempt to measure market divisionshould be undertaken <strong>in</strong> future extensions <strong>of</strong> this paper, by explor<strong>in</strong>g <strong>in</strong> greater depth thedata base with respect to concentration and diversi…cation <strong>of</strong> the …rms.The use <strong>of</strong> lobby<strong>in</strong>g before the regulatory and competition agencies, however, has notbeen an important practice <strong>in</strong> <strong>Brazil</strong>. On the contrary, the antitrust agencies <strong>in</strong>vestigatedthe reference <strong>drug</strong> makers’association for coord<strong>in</strong>ated pressure (agreed dur<strong>in</strong>g adocumented meet<strong>in</strong>g) on wholesalers to prevent them from distribut<strong>in</strong>g <strong>generic</strong> <strong>drug</strong>s,for deceitful advertisement question<strong>in</strong>g <strong>generic</strong>s’safety, right after the enactment <strong>of</strong> theGeneric Drug Act, and for distribut<strong>in</strong>g to doctors stickers labeled "I do not authorizethe substitution <strong>of</strong> the prescription at dispens<strong>in</strong>g" (without this order, any reference <strong>drug</strong>may be legally replaced by the pharmacist at dispens<strong>in</strong>g). The attempt <strong>in</strong>vestigated waspunished by the <strong>Brazil</strong>ian antitrust tribunal (CADE) <strong>in</strong> 2005, when the …rms tak<strong>in</strong>g part<strong>in</strong> the meet<strong>in</strong>g were …ned <strong>in</strong> one percent <strong>of</strong> their previous year’s revenues, except theagreement leader, Janssen-Cilag, whose …ne was doubled.7
3 Literature on pharmaceutical <strong>entry</strong>: a surveyTo the best <strong>of</strong> our knowledge, only two econometric estimations have been applied to thepharmaceutical <strong>in</strong> <strong>Brazil</strong>, all <strong>of</strong> them try<strong>in</strong>g to measure the impact <strong>of</strong> <strong>generic</strong> <strong>drug</strong> <strong>entry</strong>on prices. Fiuza and Lisboa [12] po<strong>in</strong>ted out that branded <strong>drug</strong> prices would go up <strong>in</strong>face <strong>of</strong> similar <strong>drug</strong>s´ market power <strong>in</strong>crease, a result similar to Frank and Salkever’s [13],but the data base utilized was previous to the Generic Dug Act.Nishijima and Biasoto [21] used a di¤erent sample (cover<strong>in</strong>g both before and afterthe Generic Drug Act) and a slightly di¤erent model from Fiuza and Lisboa’s and gotdi¤erent results, namely that reference <strong>drug</strong> prices would go down as they faced greaternumbers <strong>of</strong> <strong>generic</strong> copies. Lopes [18] recently replicated Fiuza and Lisboa’s model withmore <strong>drug</strong>s <strong>in</strong> a more recent period and reached the same conclusions as the latter.A better understand<strong>in</strong>g <strong>of</strong> the process that generates <strong>generic</strong> <strong>drug</strong> <strong>entry</strong> is therefore<strong>of</strong> extreme <strong>in</strong>terest for <strong>Brazil</strong>ian policymakers, for the <strong>in</strong>dustry and for the academia <strong>in</strong>general. A few models <strong>in</strong> the <strong>in</strong>ternational literature may then become a start<strong>in</strong>g po<strong>in</strong>tfor our work.As Rei¤en and Ward [22] po<strong>in</strong>t out, the <strong>generic</strong> <strong>drug</strong> <strong>in</strong>dustry is a useful …eld forstudy<strong>in</strong>g empirically how competition evolves with<strong>in</strong> a market: (i) each chemical representsa dist<strong>in</strong>ct experiment; (ii) <strong>in</strong>formation about the market for each <strong>drug</strong> is observableto researchers; e.g. date <strong>of</strong> open<strong>in</strong>g <strong>of</strong> the market (the patent expiration date); (iii) …rmsmust s<strong>in</strong>k signi…cant costs to apply for the authorities’approval prior to know<strong>in</strong>g when,or how many, rivals will enter the market.Papers by Danzon and Chao[5] and Lanjouw[16] <strong>in</strong>dicate that price regulation underm<strong>in</strong>escompetition <strong>in</strong> o¤-patent markets because they discourage <strong>generic</strong> <strong>drug</strong> <strong>entry</strong>. Inthe same direction –even though look<strong>in</strong>g for <strong>in</strong>dustrial policy, scale economies, and safetyregulation explanations – Thomas[26] also …nds that the same <strong>count</strong>ries with weakeror non-existent price control – and consequently higher prices (US, UK, Germany andSwitzerland) –have stronger competitive performance, and ac<strong>count</strong> for most <strong>of</strong> the global<strong>drug</strong>s launched (<strong>drug</strong>s sold <strong>in</strong> more <strong>count</strong>ries, and with greater market shares), whileother developed <strong>count</strong>ries tend to launch more <strong>of</strong>ten local <strong>drug</strong>s.The ma<strong>in</strong> empirical references <strong>in</strong> <strong>generic</strong> <strong>drug</strong> <strong>entry</strong> are Scott-Morton [24], [25] andRei¤en and Ward [22]. The three papers studied the US market.8
Scott-Morton [24] used <strong>in</strong>dividual data on Abbreviated New Drug Applications (AN-DAs) from the FDA dur<strong>in</strong>g the 1984-1994 period to estimate <strong>entry</strong>. Firm characteristicswere comb<strong>in</strong>ed with market characateristics to produce novel expla<strong>in</strong><strong>in</strong>g variables. Sheexplored all ANDAs <strong>of</strong> the period, totall<strong>in</strong>g 1,233 unique comb<strong>in</strong>ations <strong>of</strong> applicant, <strong>drug</strong>,form, and patent expiration, <strong>in</strong> 363 markets. The FDA provided the submission date, approvaldate, applicant name, API, form, route, and strength. She merged these data withIMS revenue datas from hospital and <strong>drug</strong>store audits, and classi…ed them <strong>in</strong>to therapeuticalclasses us<strong>in</strong>g a standard pharmaceutical reference. Her approach uses observationsat …rm and <strong>drug</strong> (API, form, strength) level. Follow<strong>in</strong>g Berry [2], she creates a set <strong>of</strong>potential entrants, who then decide to enter or not, a discrete choice (probit) decision.Thereby she is able to <strong>in</strong>clude as expla<strong>in</strong><strong>in</strong>g variables a range <strong>of</strong> …rm characteristics, suchas proxies <strong>of</strong> …rm’s experience with the <strong>in</strong>gredient, form, therapy and/or <strong>drug</strong> family –Kyle[15] also uses …rms ’ experience proxies (<strong>in</strong>clud<strong>in</strong>g <strong>count</strong>ry-class experience) alongwith geographical proximity and cultural and regulatory likeness measures for estimat<strong>in</strong>g<strong>entry</strong> <strong>of</strong> NCEs <strong>in</strong>to the G7 <strong>count</strong>ries as from 1980. The ma<strong>in</strong> <strong>in</strong>dications <strong>of</strong> the <strong>drug</strong>s arealso classi…ed <strong>in</strong>to chronic or acute conditions. 3Scott-Morton[25] adopted a Poisson <strong>count</strong> data modell<strong>in</strong>g for test<strong>in</strong>g whether preexpirationbrand advertis<strong>in</strong>g deters <strong>generic</strong> <strong>entry</strong>. Her sample covered <strong>drug</strong>s that lostpatents from 1986 to 1991. She observed revenues and quantity from two years beforepatent expiration to one year after expiration, and advertis<strong>in</strong>g data from three years beforeto one year after the same event. She found characteristics <strong>of</strong> a <strong>drug</strong> market before patentexpiration to be signi…cant predictors <strong>of</strong> <strong>generic</strong> <strong>entry</strong>. Entry was more likely <strong>in</strong> marketsfeatur<strong>in</strong>g higher market revenues, high share <strong>of</strong> sales to hospitals, <strong>drug</strong>s <strong>in</strong> topical formand for treat<strong>in</strong>g chronic conditions. The author also got a very small estimate <strong>of</strong> the e¤ect<strong>of</strong> advertis<strong>in</strong>g on <strong>entry</strong>, and noted that its sign varied with the type <strong>of</strong> advertis<strong>in</strong>g.Rei¤en and Ward [22] developed a system <strong>of</strong> equations to expla<strong>in</strong> <strong>generic</strong> <strong>entry</strong>, <strong>generic</strong>post-<strong>entry</strong> market share, and <strong>entry</strong> price. For <strong>entry</strong>, an expected pro…t was assumed to bezero for the last entrant; from this condition, and assum<strong>in</strong>g that <strong>entry</strong> decisions are taken<strong>in</strong>dependently and simultaneously; the result<strong>in</strong>g mixed strategy Nash equilibrium number3 We pursue this approach <strong>in</strong> a near future extension, after learn<strong>in</strong>g with the present research, merg<strong>in</strong>gregistration data from Anvisa (important for test<strong>in</strong>g hypotheses about …rms’behaviors follow<strong>in</strong>g <strong>entry</strong>authorization), and construct<strong>in</strong>g the relevant proxies.9
<strong>of</strong> entrants followed a b<strong>in</strong>omial distribution, approximated by a Poisson distribution,yield<strong>in</strong>g <strong>in</strong> turn a hazard rate regression; an iterative procedure was undertaken to ac<strong>count</strong>for the endogeneity <strong>of</strong> the (unobserved) rent variable present <strong>in</strong> the three equations. Thepost-patent-expiration price when there are i <strong>generic</strong> <strong>drug</strong>s <strong>of</strong> type k, relative to the price<strong>of</strong> the pre-<strong>entry</strong> branded version <strong>of</strong> the same <strong>drug</strong> was regressed on cost and demandshifters and on dummies for each possible number <strong>of</strong> <strong>generic</strong>s. The total log-revenue<strong>of</strong> the <strong>generic</strong> <strong>drug</strong>s was then regressed on the average pre-patent-expiration brandedversion revenue and on other expla<strong>in</strong><strong>in</strong>g variables (some <strong>of</strong> them present <strong>in</strong> the previousregression equation). The results <strong>in</strong>dicate that the ‡ow <strong>of</strong> <strong>generic</strong> <strong>in</strong>dustry rents <strong>in</strong> theUSA <strong>in</strong>creases for the <strong>in</strong>itial 5 to 10 months follow<strong>in</strong>g patent expiration but then fallsas more entrants compete away price-cost marg<strong>in</strong>s. For markets <strong>of</strong> su¢ cient size <strong>entry</strong>will ultimately lead to near-competitive levels, while prices rema<strong>in</strong> above marg<strong>in</strong>al cost<strong>in</strong> small markets without <strong>in</strong>duc<strong>in</strong>g <strong>entry</strong>. The authors used a data set cover<strong>in</strong>g 31 <strong>drug</strong>sthat went o¤ patent <strong>in</strong> the late 1980s and early 1990s <strong>in</strong> the USA.Bae[1] used a proportional hazard regression model to estimate time <strong>of</strong> delay (<strong>in</strong> days)to <strong>entry</strong> after patent expiration <strong>in</strong> the USA for a list <strong>of</strong> 77 s<strong>in</strong>gle-API <strong>drug</strong>s that lostpatent dur<strong>in</strong>g the period 1987-1994. Aga<strong>in</strong>, <strong>entry</strong> is faster <strong>in</strong> markets <strong>of</strong> greater revenue,with fewer branded competitors, and for chronic-use <strong>drug</strong>s. The Medicaid Drug RebateProgram, which imposed mandatory rebates o¤ the private sector wholesale prices for theMedicaid (public) purchases, had a positive impact on the <strong>entry</strong> delay.Hudson[10] studied <strong>entry</strong> <strong>in</strong> four developed <strong>count</strong>ries: USA, UK, Germany and Japan.USA and Japan are the greatest pharmaceutical markets <strong>in</strong> the world, as measured byrevenues. He analyzed: (i) the determ<strong>in</strong>ants <strong>of</strong> <strong>generic</strong> <strong>drug</strong> <strong>entry</strong>; (ii) determ<strong>in</strong>ants <strong>of</strong><strong>entry</strong> delay when <strong>entry</strong> does occur; (iii) impact <strong>of</strong> <strong>entry</strong> on the orig<strong>in</strong>al brand’s sales. Hisresults also suggest that the greater the market, the more likely are <strong>entry</strong> and its impacton the orig<strong>in</strong>al <strong>drug</strong>’s sales. His estimations are based on a sample <strong>of</strong> the …fty best-sell<strong>in</strong>gAPIs present <strong>in</strong> at leas one <strong>of</strong> these <strong>count</strong>ries.Rudholm [23] analyzed determ<strong>in</strong>ants <strong>of</strong> <strong>generic</strong> <strong>entry</strong> <strong>in</strong> Sweden, where a referencepric<strong>in</strong>g system has been used for reimbursement purposes s<strong>in</strong>ce 1993. Unfortunately hisdata (a panel <strong>of</strong> twenty-two APIs from 1972 to 1996) have a short overlap with the periodafter the <strong>in</strong>troduction <strong>of</strong> this system. He ran an <strong>in</strong>teger-valued autoregressive model byNon-L<strong>in</strong>ear Least Squares, and found that expected pro…ts a¤ect positively the number10
<strong>of</strong> entries, but the longer the exclusivity period enjoyed by the branded pioneer <strong>drug</strong>, thelower the likelihood <strong>of</strong> <strong>generic</strong> <strong>entry</strong>.Recent unpublished papers by Moreno-Torres et al [20] and Iizuka [11] analyze <strong>entry</strong>respectively <strong>in</strong> Spa<strong>in</strong> and Japan, two heavily regulated markets, with tight price controls.Spa<strong>in</strong> is the seventh largest market <strong>in</strong> the world (…fth <strong>in</strong> the EU), and price controlshave been <strong>in</strong> force there s<strong>in</strong>ce the 1920s. Reimbursement by the government has been subjectto reference pric<strong>in</strong>g s<strong>in</strong>ce 2000. Follow<strong>in</strong>g Berry[2], and unlike Rei¤en and Ward[22],Moreno-Torres et al [20] assume di¤erent <strong>entry</strong> costs and use a pure strategy equilibriumconcept. Still they end up assum<strong>in</strong>g a <strong>count</strong> data model: start<strong>in</strong>g with a Poisson, andreject<strong>in</strong>g the hypothesis <strong>of</strong> equidispersion, they end up mov<strong>in</strong>g to a (zero-<strong>in</strong>‡ated) FixedE¤ects Negative B<strong>in</strong>omial model. Their data set is an unbalanced panel cover<strong>in</strong>g 86 prescription<strong>drug</strong> APIs for a maximum number <strong>of</strong> 34 quarters, collected from the SpanishNational Health System. They exclude OTCs, <strong>drug</strong>s for hospital consumption, non-oral<strong>drug</strong>s (thus exclud<strong>in</strong>g topicals and <strong>in</strong>jectables), pediatric <strong>drug</strong> types, and <strong>drug</strong>s with morethan one API. One s<strong>in</strong>gular feature <strong>of</strong> the Spanish price control system is that the <strong>drug</strong>maximum prices are …xed <strong>in</strong> a negotiation between the …rm and the health authorityand <strong>in</strong> particular new <strong>generic</strong> entrants have systematically been priced below the <strong>in</strong>cumbent<strong>generic</strong> <strong>drug</strong>s. Moreover, as new <strong>generic</strong>s enter, and due to the formula utilized,the reference price for reimbursement is recalculated downwards. Expla<strong>in</strong><strong>in</strong>g variables <strong>in</strong>cludedummies for reference pric<strong>in</strong>g and long duration treatment, age <strong>of</strong> the pioneer <strong>drug</strong>,number <strong>of</strong> <strong>generic</strong> …rms <strong>in</strong> the market, and number <strong>of</strong> APIs <strong>in</strong> the therapeutic (ATC-4)subgroup. The …rst dummy and the last two variables are found signi…cant and negativelysigned, along with a (negatively signed) time trend and the (four-quarter) laggedmarket revenue level (found signi…cantly negative). The results contrast with …nd<strong>in</strong>gs<strong>in</strong> the US market, but re<strong>in</strong>force the thesis that regulations foster<strong>in</strong>g <strong>generic</strong> substitution(the reference pric<strong>in</strong>g system) deter <strong>entry</strong>.Japan is the second largest market <strong>in</strong> the world, and is severely regulated. Curiously,as Thomas [26] note, a great share <strong>of</strong> <strong>drug</strong>s launched <strong>in</strong> Japan are local, i.e., they aremarketed only there. Retail prices are set by the government, while wholesale pricesare free. Prices are updated every other year, follow<strong>in</strong>g a formula that comb<strong>in</strong>es thewholesale and the retail average prices. Generic <strong>drug</strong> <strong>in</strong>troductory prices are set 30%below the comparable brand-name <strong>drug</strong>s’, and <strong>entry</strong> approvals are issued only once a11
year. Generic <strong>drug</strong>s’shares are quite low <strong>in</strong> Japan, for several reasons, accord<strong>in</strong>g to Iizuka[11] : (i) di¢ culty to substitute <strong>generic</strong>s at pharmacies (only allowed when prescriptionused the nonproprietary name, a provision reversed <strong>in</strong> April 2008); (ii) widely believedperception <strong>of</strong> low quality for <strong>generic</strong>s; (iii) uncerta<strong>in</strong>ty <strong>in</strong> supply side, due to sudden exits<strong>of</strong> <strong>generic</strong> …rms. A new reimbursement premium was created <strong>in</strong> 2002 that <strong>in</strong>centives<strong>generic</strong> prescription. Iizuka uses prescription data <strong>in</strong>stead <strong>of</strong> market level data for 97API-form-strength comb<strong>in</strong>ations (57 APIs) from Japan Medical Data Center from 2002to 2006. and also uses a <strong>count</strong> data model (a negative b<strong>in</strong>omial regression on pooled data)to estimate <strong>generic</strong> <strong>drug</strong> <strong>entry</strong>. He obta<strong>in</strong>s some very <strong>in</strong>terest<strong>in</strong>g …nd<strong>in</strong>gs: (i) fewer <strong>generic</strong>…rms enter if there is a large number <strong>of</strong> brand names already <strong>in</strong> the market; (ii) <strong>entry</strong> di¤ersacross therapeutic classes (for <strong>in</strong>stance, they are lower <strong>in</strong> classes that treat cancer andthe nervous system, where <strong>entry</strong> costs are higher and expeted revenues lower); (iii) fewer<strong>generic</strong>s enter a market with a high share <strong>of</strong> <strong>in</strong>stitutions where prescrib<strong>in</strong>g and dispens<strong>in</strong>gare separated 4 –suggest<strong>in</strong>g that <strong>in</strong>tegration take greater advantage <strong>of</strong> the <strong>generic</strong> <strong>drug</strong>s’higher markup; (iv) fewer <strong>generic</strong>s enter markets ma<strong>in</strong>ly used <strong>in</strong> large hospitals, whosephysicians are strongly connected to medical schools, where <strong>in</strong> turn pr<strong>of</strong>essors are <strong>of</strong>ten<strong>in</strong>volved with the development <strong>of</strong> branded <strong>drug</strong>s.4 The model4.1 MethodologyOur observation is a <strong>count</strong> <strong>of</strong> entries <strong>of</strong> <strong>generic</strong> <strong>drug</strong>s for a s<strong>in</strong>gle-API <strong>drug</strong> <strong>in</strong> a given route<strong>of</strong> adm<strong>in</strong>istration and ATC-3 class, <strong>in</strong> a given year. There are three basic approaches forestimat<strong>in</strong>g regressions where the dependent variable is a non-negative <strong>in</strong>teger: (i) the usuall<strong>in</strong>ear regression, sometimes undertak<strong>in</strong>g some monotonic transformation <strong>of</strong> the dependentvariable to render it cont<strong>in</strong>uous; (ii) a regression us<strong>in</strong>g a <strong>count</strong> data speci…cation, fromthe Poisson family; (iii) an ordered mult<strong>in</strong>omial regression.S<strong>in</strong>ce l<strong>in</strong>ear regressions are more known, we atta<strong>in</strong> ourselves to describe the other two4 A unique feature <strong>of</strong> this <strong>in</strong>dustry <strong>in</strong> Japan is the <strong>in</strong>tegration <strong>of</strong> prescription and dispensation <strong>of</strong> <strong>drug</strong>sby doctors, especially the o¢ ce-based.12
model families. We then discuss the pros and cons <strong>of</strong> the three approaches, and <strong>in</strong> thenext section their results are compared.4.1.1 Count data modelsPoissonThe start<strong>in</strong>g po<strong>in</strong>t for standard <strong>count</strong> data analysis is the Poisson regressionmodel. In a cross-section, the basic model usually utilized for expla<strong>in</strong><strong>in</strong>g an <strong>in</strong>teger-valuedvariable y i is:such thatf (y) = e yy!(1)E (y i jx i ) = V ar (y i jx i ) = i = exp (x 0 i) (2):The advantages <strong>of</strong> the Poisson regression, accord<strong>in</strong>g to Hausman, Hall and Griliches(1984) [8] are: (i) it is analogous to the standard regressions <strong>in</strong> the sense that the oneobta<strong>in</strong>s a parametrized mean conditional on expla<strong>in</strong><strong>in</strong>g variables, estimated by someweighted least squares (nowadays extended to the generalized method <strong>of</strong> moments) ormaximum likelihood procedure, and thanks to its global concavity the optimization algorithmsconverge fast; (ii) the zero problem y i = 0 is a natural outcome <strong>of</strong> the distribution,and the <strong>in</strong>teger property as a whole is handled directly, <strong>in</strong> contrast to the usual logarithmicregression speci…cation, where a cont<strong>in</strong>uous distribution needs to be truncated;(iii) the Poisson speci…cation "allows for convenient time aggregation so long as its basicassumption <strong>of</strong> time <strong>in</strong>dependence holds true", such that the summation <strong>of</strong> a Poi ssondistributedvariable over time also follows a Poisson whose mean equals the summation <strong>of</strong>the period means. However, the authors also po<strong>in</strong>t out, "the time <strong>in</strong>dependence propertyis also a potential weakness (...), given the <strong>of</strong>ten noted serial correlation <strong>of</strong> residuals <strong>in</strong>econometric speci…cations" (p. 911).For the Poisson Maximum Likelihood Estimator, it can be shown that (see Cameronand Trivedi[3] ): (i) consistency requires a correct speci…cation <strong>of</strong> the conditional mean,but not that the dependent variable is actually Poisson distributed; (ii) valid statistical13
<strong>in</strong>ference us<strong>in</strong>g computed ML standard errors and t-statistics requires correct speci…cation<strong>of</strong> both the conditional mean and variance. That requires equidispersion (i.e. thedistribution’s property that the mean equals variance, or 2), but, aga<strong>in</strong>, not a Poissondistribution for y; (iii) valid statistical <strong>in</strong>ference us<strong>in</strong>g appropriately modi…ed ML outputis still possible when data are not equidispersed, as long as the conditional mean is correctlyspeci…ed; <strong>in</strong> this case, it is necessary to adjust the standard error estimates, whatyields a Pseudo-MLE; (iv) more e¢ cient estimators than Poisson can be obta<strong>in</strong>ed if dataare not equidispersed.In fact, equidispersion <strong>in</strong> the Poisson model is a very severe restriction, analogousto homoskedasticity <strong>in</strong> OLS, and is <strong>of</strong>ten rejected by the data. To address this issue, anumber <strong>of</strong> alternatives have been proposed, depart<strong>in</strong>g <strong>in</strong> various extents from the basicPoisson model. We describe next the models we explored for the present study.Negative b<strong>in</strong>omialto be:A more ‡exible speci…cation allows for the conditional varianceV ar (y i jx i ) = ! i = ! ( i ; ) (3)The most utilized speci…cation for this function is the family:! i = i + p i (4)In particular, the default Negative B<strong>in</strong>omial speci…cation assumes p = 1 (NB1 model),so that the conditional variance becomes a constant multiple <strong>of</strong> the conditional mean:V ar (y i jx i ) = (1 + ) i = exp (x 0 ) (5)One derivation <strong>of</strong> the negative b<strong>in</strong>omial is that the <strong>in</strong>dividual units follow a Poissonregression model, but there is an ommitted variable i : i = exp (x 0 i + i ) (6)14
such that i follows a Gamma distribution:e j~Gamma ( i =; ) (7)Another speci…cation (NB2) is obta<strong>in</strong>ed when i follows another Gamma distribution:e j~Gamma (1=; ) (8)and thereforeV ar (y i jx i ) = i (1 + i ) (9)The distribution obta<strong>in</strong>ed can be <strong>in</strong>terpreted as a parametric mixture <strong>of</strong> two distributions,the Poisson and a conjugate Gamma:Zh (yj; ) =f (yj; ) g (; ) d (10)where f (yj; ) is the Poisson distribution referr<strong>in</strong>g to the conditional mean 6, andg (; ) <strong>in</strong> turn is another mix<strong>in</strong>g distribution. In the NB1 case:g (; ) = ( 1 ) 1( 1 ) 1 1 e 1 ; > 0 (11)where(a) =1Ze t t a 1 dt; a > 0 (12)0Substitut<strong>in</strong>g the Poisson and the mixed Gamma 11 back <strong>in</strong>to h (yj; ), we obta<strong>in</strong>: ( 1 + y) 1 1 yh (yj; ) =(13)( 1 ) (y + 1) 1 + 1 + and the log-likelihood to be maximized <strong>in</strong> the NB1 case is:ln L (; ) =nX(yi 1i=1 j=0)Xln j + 1 ln y i ! y i + 1 ln (1 + exp (x 0 i)) + y i ln + y i x 0 i(14)15
Zero-<strong>in</strong>‡ated modelsLambert [17] <strong>in</strong>troduced the Zero-In‡ated Poisson <strong>in</strong> order toac<strong>count</strong> for the excess number <strong>of</strong> zeros usually found <strong>in</strong> <strong>count</strong> regressions, which implyoverdispersion. It can be <strong>in</strong>terpreted as a mixture <strong>of</strong> the Poisson distribution f 2 () witha degenerate distribution whose mass is concentrated at zero. A b<strong>in</strong>ary process withdensity f 1 () sorts the outcomes between the two distributions. Thus, a zero can bean outcome either <strong>of</strong> the degenerate distribution or <strong>of</strong> the Poisson distribution, and theresult<strong>in</strong>g probabilities are:Pr [y i = 0] = f 1 (0) + (1 f 1 (0)) f 2 (0) (15)Pr [y i = r] = (1 f 1 (0)) f 2 (r) ; r = 1; 2::: (16)The b<strong>in</strong>ary distribution is ord<strong>in</strong>arily speci…ed as a logit with regressors z i and parameters.The log-likelihood then becomes:nXnXln L () = 1 (y i = 0) ln (exp (z 0 i) + exp ( exp (x 0 i)))+ (1 1 (y i = 0)) (y i x 0 i exp ( exp (x 0 i)i=1i=1The zero-<strong>in</strong>‡ated negative b<strong>in</strong>omial follows the same reason<strong>in</strong>g, just substitut<strong>in</strong>g thenegative b<strong>in</strong>omial for f 2 () .4.1.2 Ordered mult<strong>in</strong>omial modelsIn such models a …xed number <strong>of</strong> outcomes, say m, can be obta<strong>in</strong>ed, which can be thenordered <strong>in</strong>to <strong>in</strong>teger categories. Let the latent variable be:y i = x 0 i + u i (17)Then de…ne the observed outcomey i = j if j1 < y i jwhere the a j are the thresholds, or cuto¤ po<strong>in</strong>ts, to be estimated along with the parameters by MLE. It is conventioned that 0 = 1 and m = +1. Then16
Pr [y i = j] = Pr ( j 1 < yi j ) == F ( j x 0 i) F ( j 1 x 0 i) (18)where F () is the cdf <strong>of</strong> u i . An ordered logit is such model where the cdf is a logisticdistribution, and an ordered probit where the cdf is a Normal. In the former case, thereare K + m 1 parameters to be estimated, where K is the dimension <strong>of</strong> , while <strong>in</strong>the latter case, there are (m 1) (K + 1) parameters. These models have been applied to<strong>count</strong> data that take very few values. In some cases, as <strong>in</strong> our present study, the frequency<strong>of</strong> higher values is low enough so that an upper censor<strong>in</strong>g is undertaken (namely, entriesabove 5 are censored at that level).5 Data and resultsOur estimations are based on retail level market data. IMS Health is the ma<strong>in</strong> marketaudit company <strong>of</strong> the pharmaceutical <strong>in</strong>dustry worldwide. Pharmaceutical Market <strong>Brazil</strong>(PMB) surveys sales only through retail channel, so we are not able to <strong>in</strong>clude hospitalsales as expla<strong>in</strong><strong>in</strong>g variable. Only recently have hospital sales started be<strong>in</strong>g collected. Weuse then PMB data but exclude <strong>drug</strong>s sold typically or exclusively to hospitals, such asanesthesia, parenteral solutions, diagnostic agents, and blood derivatives. The data basehad also to be cleaned up with the exclusion <strong>of</strong> functional food, shampoos, soaps andother cosmetics. But phytotherapics have not been excluded.PMB records extracted comprised monthly sales <strong>in</strong> volume and value (local currency).Units are packages. Strength (amount <strong>of</strong> API content <strong>in</strong> the <strong>drug</strong>) is not available for all<strong>drug</strong>s <strong>in</strong> a separate …eld, but packag<strong>in</strong>g description is not standardized; as a consequence,the …eld for equivalent dosages is also <strong>in</strong>complete. We observe sales per brand and packag<strong>in</strong>g.Descriptive variables <strong>in</strong>clude: seller´s name; API; type <strong>of</strong> <strong>drug</strong> (reference, similaror <strong>generic</strong>) launch<strong>in</strong>g date <strong>of</strong> the packag<strong>in</strong>g; launch date <strong>of</strong> the brand or <strong>generic</strong>; formand route <strong>of</strong> adm<strong>in</strong>istration (e.g. tablets, sprays, ampoles, etc.). Follow<strong>in</strong>g Scott-Morton[24], [25] and advice from the <strong>in</strong>dustry 5 , we grouped forms <strong>in</strong>to (i) oral solids, (ii) oral5 We are extremely grateful to Mr. Jair Calixto, manager <strong>of</strong> good manufactur<strong>in</strong>g practices and phar-17
liquids, (iii) semi-solids (topics and suppositories), (iv) <strong>in</strong>jectables, and (v) sprays. Scott-Morton’s orig<strong>in</strong>al papers groups orals together, and semi-solids and sprays <strong>in</strong>to "topics".We de…ne then a <strong>drug</strong> as the triple API-class-form.We have no reliable data on advertisement and promotion (’detail<strong>in</strong>g’). Prescriptiondata have not been explored yet.PMB has an unfortunate feature worldwide: the seller´s name is not tracked alongthe months; when a brand is transfered because <strong>of</strong> divestiture, licens<strong>in</strong>g, partial or totalmerger or acquisition, the whole sales series are relabeled to the new seller. Depend<strong>in</strong>gon the date <strong>of</strong> the extraction, the whole series will be completely assigned to the currentseller. We overcame this obstacle with an external data base, from ABCFarma, a monthlymagaz<strong>in</strong>e conta<strong>in</strong><strong>in</strong>g all <strong>drug</strong> price lists. By consolidat<strong>in</strong>g all price lists throughout theperiod, we were able to identify each <strong>drug</strong>’s seller <strong>in</strong> each month. As the <strong>drug</strong> labels<strong>of</strong> IMS and ABCFarma were not completely comparable, we summarized the transitionpairs <strong>of</strong> sellers and doublechecked them with merger dates from the <strong>Brazil</strong>ian antitrustagencies and by search<strong>in</strong>g the Web. Parent companies were also checked this way, andadditionally by check<strong>in</strong>g the addresses <strong>of</strong> the companies registered at CMED/Anvisa. Theheavy workload at this stage <strong>of</strong> our research process could never be overstated. To the best<strong>of</strong> our knowledge, this is the …rst work <strong>in</strong> the <strong>in</strong>ternational literature that complementsIMS data with other pieces <strong>of</strong> <strong>in</strong>formation to overcome such a classical data limitationproblem.5.1 Descriptive statisticsWe found 648 s<strong>in</strong>gle-API <strong>drug</strong>s that were not under patent at least one year <strong>of</strong> our sampledperiod; <strong>in</strong> fact,18 <strong>drug</strong>s had their patent expired dur<strong>in</strong>g our sample; only four <strong>of</strong> them had<strong>generic</strong>s launched. One <strong>of</strong> them was letrozole, expired <strong>in</strong> 2007, but with an (own-) <strong>generic</strong>launched <strong>in</strong> 2006. This was the only case <strong>of</strong> own-<strong>generic</strong> launched before expiration <strong>in</strong> oursample.We then obta<strong>in</strong>ed 984 <strong>drug</strong>s (triples API-class-form). Tables 3 and 4 summarize<strong>entry</strong> and <strong>generic</strong> penetration <strong>in</strong> the markets. Table 3 br<strong>in</strong>g the shares <strong>of</strong> <strong>drug</strong>s conta<strong>in</strong><strong>in</strong>g<strong>generic</strong> versions <strong>in</strong> each year, both <strong>in</strong> number and <strong>in</strong> revenue. It also br<strong>in</strong>gs the shares <strong>of</strong>maceutical audits <strong>of</strong> the Pharmaceutical Industry Syndicate <strong>of</strong> São Paulo for graciously provid<strong>in</strong>g adviceon the classi…cation <strong>of</strong> production processes.18
<strong>drug</strong>s where <strong>generic</strong> <strong>entry</strong> occurred <strong>in</strong> the same year, also <strong>in</strong> number and <strong>in</strong> revenue. One<strong>in</strong>terest<strong>in</strong>g feature to remark is that the revenue shares <strong>of</strong> <strong>drug</strong>s with <strong>entry</strong> and <strong>of</strong> <strong>drug</strong>swith <strong>generic</strong>s moved <strong>in</strong> opposTable 4 <strong>count</strong>s <strong>drug</strong> market yearly observations accord<strong>in</strong>g to the number <strong>of</strong> <strong>generic</strong><strong>drug</strong> entrants recorded <strong>in</strong> the respective year.INSERT TABLE 3 ABOUT HEREINSERT TABLE 4 ABOUT HEREWe notice that the greatest share <strong>of</strong> our observations is <strong>of</strong> <strong>drug</strong>s without <strong>generic</strong> <strong>drug</strong><strong>entry</strong> (appr. 85%). The share <strong>of</strong> each zero-<strong>entry</strong> class (<strong>in</strong> number) <strong>in</strong> the total is similarto the share <strong>of</strong> the class (<strong>in</strong> number) <strong>in</strong> the total. Shares <strong>of</strong> yearly observations <strong>of</strong> no <strong>entry</strong><strong>in</strong> the class´s total number <strong>of</strong> observations range from 77.4% (class J –Anti<strong>in</strong>fectives) to96.8% (class B –Blood and Blood Form<strong>in</strong>g Organs). Class J is therefore the class withthe greatest rate <strong>of</strong> <strong>generic</strong> <strong>entry</strong>.Accumulat<strong>in</strong>g <strong>generic</strong> <strong>drug</strong> <strong>entry</strong> changes a little the picture: the number <strong>of</strong> classeswith no <strong>generic</strong> <strong>entry</strong> whatsoever dur<strong>in</strong>g the period 2000-2007 goes down to 64% <strong>in</strong>number. The cumulative density <strong>of</strong> entries up to 6 is 90%; see Figure 2.INSERT FIGURE 2 ABOUT HERE5.2 ResultsThe reader should bear <strong>in</strong> m<strong>in</strong>d that, unlike <strong>in</strong> the l<strong>in</strong>ear regressions, marg<strong>in</strong>al e¤ects<strong>in</strong> <strong>count</strong> data are nonl<strong>in</strong>ear. In particular, the derivative <strong>of</strong> the expected <strong>count</strong> w.r.t.a particular regressor x j <strong>in</strong> the Poisson and Negative B<strong>in</strong>omial family has the follow<strong>in</strong>gformula:@E [yjx]@x j= j exp (x 0 i) (19)The K-vector <strong>of</strong> derivatives <strong>in</strong> an ordered mult<strong>in</strong>omial model is calculated for eachvalue <strong>of</strong> the dependent variable’s support:19
@ Pr [y i = jjx i ]@x i= [F 0 ( j 1 x 0 i) F 0 ( j x 0 i)] ( 2 0 )where F 0 () is the derivative <strong>of</strong> the respective cdf apply<strong>in</strong>g to the problem: <strong>in</strong> the logitcase, F 0 () = () (1simply the Normal pdf (). ()), where () is the logistic cdf; <strong>in</strong> the probit case, F 0 () isTables 5 and 7 display the marg<strong>in</strong>al e¤ects <strong>of</strong> the <strong>count</strong> data models and <strong>of</strong> theordered probit, respectively. Ordered Probit and Ordered Logit’s results are compared<strong>in</strong> Table 6. Results show that: as regards <strong>count</strong> models, we found that a simple Poissonregression provides a poor estimation <strong>of</strong> <strong>generic</strong> <strong>drug</strong> <strong>entry</strong> because <strong>of</strong> overdispersion;both the Negative B<strong>in</strong>omial family and the zero-<strong>in</strong>‡ated models improve considerablyover Poisson. Most <strong>of</strong> the expla<strong>in</strong><strong>in</strong>g variables utilized are signi…cant, <strong>in</strong> particular:1. lagged values <strong>of</strong> the revenues <strong>of</strong> the particular <strong>drug</strong> (proxy for potential market)have positive sign for the branded revenue and for the total <strong>drug</strong>’s revenue over allforms, but negative for the the <strong>drug</strong>’s revenues <strong>in</strong> a particular form <strong>in</strong> the classs,and for the total <strong>of</strong> the therapeutical class;2. the lagged value <strong>of</strong> the number <strong>of</strong> own <strong>generic</strong>s surpris<strong>in</strong>gly a¤ects positively <strong>entry</strong>,but the number <strong>of</strong> extended release brands and the number <strong>of</strong> brands belong<strong>in</strong>g tothe reference <strong>drug</strong>’s seller a¤ect negatively <strong>entry</strong>, as expected;3. the lagged HHI market concentration <strong>in</strong>dexes also have mixed signs: a higher therapeuticalclass HHI attracts <strong>entry</strong> (though with a very slight signi…cance), while ahigher <strong>drug</strong>’s HHI repells it; the number <strong>of</strong> sellers <strong>in</strong> the class has a positive sign;4. the age <strong>of</strong> the pioneer <strong>drug</strong> –a proxy for the age <strong>of</strong> the molecule and therefore <strong>of</strong>the maturity <strong>of</strong> the <strong>drug</strong>’s market –attracts <strong>generic</strong> <strong>entry</strong>;5. the lagged number <strong>of</strong> brands also curiously is positively correlated with <strong>entry</strong>;6. the number <strong>of</strong> s<strong>in</strong>gle-API <strong>drug</strong>s <strong>in</strong> the therapeutical class has also mixed signs; thesummation over the entire class has a negative sign, while the summation with<strong>in</strong>the same route <strong>of</strong> adm<strong>in</strong>istration <strong>in</strong> the class has a positive sign;7. the revenues <strong>of</strong> phyotherapics and the market share <strong>of</strong> the own <strong>generic</strong>s <strong>in</strong> the classand <strong>in</strong> the class/form are not signi…cant for expla<strong>in</strong><strong>in</strong>g <strong>entry</strong>.20
Ordered mult<strong>in</strong>omial models display similar results, but some magnitudes <strong>of</strong> the marg<strong>in</strong>ale¤ects vary considerably, especially along the categories.INSERT TABLE 5 ABOUT HEREINSERT TABLE 6 ABOUT HEREINSERT TABLE 7 ABOUT HERE5.3 Diagnostic tests and commentsWald tests compar<strong>in</strong>g Poisson to NB1, NB2 and generalized NB models reject equidispersion.Vuong tests reject both Poisson and NB2 models <strong>in</strong> favor <strong>of</strong> Zero-<strong>in</strong>‡ated Poissonand Zero-<strong>in</strong>‡ated NB2 models, respectively. Both Akaike and Bayesian Information Criteriaalso suggest that the zero-<strong>in</strong>‡ated models are the best models. See Tables 5 and8.On the other hand, proportion <strong>of</strong> <strong>count</strong>s predicted by NB2 seem to be closer to theobserved proportions than ZIP; see Figure 3 and Tables 8-A to 8-E. ZINB predicts betterthe proportions <strong>of</strong> ones and twos than regular NB2. The worst …t is the regular Poisson’s.INSERT FIGURE 3 ABOUT HEREINSERT TABLES 8 AND 8-A TO 8-E ABOUT HEREThe comparison <strong>of</strong> predicted proportions given by ordered mult<strong>in</strong>omial probit versusordered mult<strong>in</strong>omial logit (see Tables 9 and 10) favors only slightly the latter: 84.70%success rate 6 versus 84.92%. Another crude check (See Figure 4) po<strong>in</strong>t out that both theordered logit and the ordered probit …t better the predicted proportions than ZINB.INSERT FIGURE 4 ABOUT HEREINSERT TABLES 9 AND 10 ABOUT HERE6 Success rate measured by the proportion <strong>of</strong> the "choices" that were predicted correctly (see Maddala,1993, p. 77)21
It is <strong>in</strong>terest<strong>in</strong>g to note how the variables related to deterrence a¤ect <strong>entry</strong>. Tak<strong>in</strong>gthe best model …tted to the data, ZINB, own-<strong>generic</strong>s, own similar brands and extendedreleaseversions do not appear to be very e¤ective <strong>in</strong> deterr<strong>in</strong>g <strong>entry</strong>. But it is worthrem<strong>in</strong>d<strong>in</strong>g that our data do not keep track <strong>of</strong> co-market<strong>in</strong>g agreements unnoti…ed to the<strong>Brazil</strong>ian antitrust agencies, so the e¤ect <strong>of</strong> own brands may be severely underestimated.It is also <strong>in</strong>terest<strong>in</strong>g to note how the zero-<strong>in</strong>‡ated models predict zeros from the differentdistributions <strong>of</strong> the mixture. Figure 5 plots predicted proportions <strong>of</strong> zeros aga<strong>in</strong>stthe <strong>count</strong>s <strong>of</strong> brands <strong>in</strong> the respective <strong>drug</strong> markets. We note that <strong>drug</strong>s with as few asone brand hardly attract any <strong>entry</strong>, so the <strong>entry</strong> <strong>of</strong> branded competitors is an importantlead<strong>in</strong>g <strong>in</strong>dicator <strong>of</strong> a <strong>generic</strong>. In fact, it is easier to <strong>in</strong>troduce a similar brand …rst. Moreover,as the formula for <strong>entry</strong> price takes <strong>in</strong>to ac<strong>count</strong> either the average market price orthe average …rm price, …rms had better <strong>in</strong>troduce similar <strong>drug</strong>s …rst, because existence <strong>of</strong><strong>generic</strong> <strong>drug</strong>s br<strong>in</strong>g the average down, due to their mandatory 35% rebate.INSERT FIGURE 5 ABOUT HERE6 ConclusionsThis article is the …rst e¤ort to estimate <strong>generic</strong> <strong>drug</strong> <strong>entry</strong> <strong>in</strong> <strong>Brazil</strong>, a relatively novelfeature <strong>of</strong> the <strong>Brazil</strong>ian market, as bioequivalence has only been regulated <strong>in</strong> the <strong>count</strong>rys<strong>in</strong>ce 1999. We used both <strong>count</strong> models and ordered mult<strong>in</strong>omial models for this purpose.As regards <strong>count</strong> models, we found that a simple Poisson regression provides a poorestimation <strong>of</strong> <strong>generic</strong> <strong>drug</strong> <strong>entry</strong> because <strong>of</strong> overdispersion; both the Negative B<strong>in</strong>omialfamily and the zero-<strong>in</strong>‡ated models improve considerably over Poisson. Most <strong>of</strong> the expla<strong>in</strong><strong>in</strong>gvariables utilized are signi…cant, <strong>in</strong> particular:1. lagged values <strong>of</strong> the revenues <strong>of</strong> the particular <strong>drug</strong> (proxy for potential market)have positive sign for the branded revenue and for the total <strong>drug</strong>’s revenue over allforms, but negative for the the <strong>drug</strong>’s revenues <strong>in</strong> a particular form <strong>in</strong> the classs,and for the total <strong>of</strong> the therapeutical class;2. the lagged value <strong>of</strong> the number <strong>of</strong> own <strong>generic</strong>s surpris<strong>in</strong>gly a¤ects positively <strong>entry</strong>,but the number <strong>of</strong> extended release brands and the number <strong>of</strong> brands belong<strong>in</strong>g tothe reference <strong>drug</strong>’s seller a¤ect negatively <strong>entry</strong>, as expected;22
3. the lagged HHI market concentration <strong>in</strong>dexes also have mixed signs: a higher therapeuticalclass HHI attracts <strong>entry</strong> (though with a very slight signi…cance), while ahigher <strong>drug</strong>’s HHI repels it; the number <strong>of</strong> sellers <strong>in</strong> the class has a positive sign;4. the age <strong>of</strong> the pioneer <strong>drug</strong> –a proxy for the age <strong>of</strong> the molecule and therefore <strong>of</strong>the maturity <strong>of</strong> the <strong>drug</strong>’s market –attracts <strong>generic</strong> <strong>entry</strong>;5. the lagged number <strong>of</strong> brands also curiously is positively correlated with <strong>entry</strong>;6. the number <strong>of</strong> s<strong>in</strong>gle-API <strong>drug</strong>s <strong>in</strong> the therapeutical class has also mixed signs; thesummation over the entire class has a negative sign, while the summation with<strong>in</strong>the same route <strong>of</strong> adm<strong>in</strong>istration <strong>in</strong> the class has a positive sign;7. the revenues <strong>of</strong> phyotherapics and the market share <strong>of</strong> the own <strong>generic</strong>s <strong>in</strong> the classand <strong>in</strong> the class/form are not signi…cant for expla<strong>in</strong><strong>in</strong>g <strong>entry</strong>.Ordered mult<strong>in</strong>omial models display similar results, but some magnitudes <strong>of</strong> the marg<strong>in</strong>ale¤ects vary considerably, especially along the categories. Fit <strong>of</strong> the predicted proportionsappears to be much better than the <strong>count</strong> models’.This article is only the beg<strong>in</strong>n<strong>in</strong>g <strong>of</strong> a series <strong>of</strong> studies on the pharmaceutical <strong>in</strong>dustry<strong>in</strong> <strong>Brazil</strong> us<strong>in</strong>g retail level data. Some extensions are already envisaged, <strong>in</strong> particular: (i)a model <strong>of</strong> <strong>entry</strong> us<strong>in</strong>g …rm-level data and sequential decision each year; thereby enabl<strong>in</strong>gus to add …rm characteristics, as suggested by Kyle[14] and Scott-Morton [25], follow<strong>in</strong>gBerry [2]. In particular, we may use diversi…cation measures, <strong>in</strong>gredient experience, therapeuticclass experience, and form experience; (ii) <strong>in</strong>corporat<strong>in</strong>g dynamics <strong>of</strong> <strong>drug</strong> <strong>entry</strong>,as modeled by Rei¤en and Ward [22]; (iii) an assessment <strong>of</strong> diversi…cation <strong>of</strong> sellers’s salesand <strong>of</strong> market concentration across therapeutic classes and/or relevant markets de…ned bythe <strong>Brazil</strong>ian antitrust system; (iv) estimation <strong>of</strong> <strong>entry</strong> <strong>of</strong> NCE (New Chemical Entities) –what will require re…nement <strong>of</strong> <strong>in</strong>formation on patent status and access to classi…cation <strong>of</strong><strong>drug</strong>s for <strong>in</strong>troductory price regulation purposes –thus provid<strong>in</strong>g for a better assessment<strong>of</strong> welfare associated to <strong>in</strong>novation.23
References[1] Bae, J.P. (1997). "Drug Patent Expirations and the Speed <strong>of</strong> Generic Entry", HealthServices Research, vol. 32, 87–101.[2] Berry, S.T. (1992). "Estimation <strong>of</strong> a Model <strong>of</strong> Entry <strong>in</strong> the Airl<strong>in</strong>e Industry". Econometrica,Vol. 60, pp. 889-917.[3] Cameron, A.C. & Trivedi, P.K. (1998). Regression Analysis <strong>of</strong> <strong>count</strong> data. Cambridge,Cambridge U.P.[4] Chaves, G.C. & Reis, R. (2007). "Challenges for the universal access to medic<strong>in</strong>es <strong>in</strong><strong>Brazil</strong> –brief comments from civil society". International Conference on CompulsoryLicens<strong>in</strong>g: Innovation and Access for All", 21-23 November 2007, Bangkok, Thailand.[5] Danzon and Chao (2000) –"Does Regulation Drive out Competion <strong>in</strong> Pharmaceuticalmarkets?". Journal <strong>of</strong> Laws & Economics, vol 43, pp.311-357.[6] European Commission (2008). Pharmaceutical Sector Inquiry – Prelim<strong>in</strong>ary Report/FactSheet –"Orig<strong>in</strong>ator-Generic competition".[7] Federal Trade Commision (2002). Generic Drug Entry Prior to Patent Expiration:an FTC Study. Wash<strong>in</strong>gton (DC).[8] Hausman, J.; Hall, B.H. & Griliches, Z. (1984). "Econometric Models for Count Datawith an application to the Patents-R& D Relationship". Econometrica, Vol. 52, No.4, pp. 909-938.[9] Homedes, N.; L<strong>in</strong>ares, R.L. & Ugalde, A. (2005). Generic Drug Policies <strong>in</strong> Lat<strong>in</strong>America. Health, Nutrition and Population (HNP) Discussion Paper. Wash<strong>in</strong>gton(DC): World Bank.[10] Hudson, J. (2000). “Generic take-up <strong>in</strong> the pharmaceutical market follow<strong>in</strong>g patentexpiry: a multi-<strong>count</strong>ry study”. International Review <strong>of</strong> Law and Economics, vol. 20,pp. 205-221.[11] Iizuka (2008) "Generic Entry <strong>in</strong> a Regulated Pharmaceutical Market". AoyamaGaku<strong>in</strong> University. Mimeo.24
[12] Fiuza, E.P.S. & Lisboa, M.B. (2003) "Credence Goods and Market Power: An EconometricStudy <strong>of</strong> the <strong>Brazil</strong>ian Pharmaceutical Industry”. Estudos Econômicos, vol.33, no. 4, pp. 601-638.[13] Frank, R. G. & Salkever, D. S. (1997). "Generic Entry and the Pric<strong>in</strong>g <strong>of</strong> Pharmaceuticals".Journal <strong>of</strong> Economics & Management Strategy, Volume 6, Number 1, pp.75–90.[14] Kyle, M.K. (2003) –"Pharmaceutical Price Controls and Entry Strategies". Review<strong>of</strong> Economics and Statistics, vol. 89, no.1, pp.88-99.[15] Kyle, M.K. (2006) – "The role <strong>of</strong> …rm characteristics <strong>in</strong> pharmaceutical productlaunches". Rand Journal <strong>of</strong> Economics, vol. 37, no.3, pp.602-618.[16] Lanjouw, J.O. (2005) – "Patents, Price Controls and Acess to New Drugs: HowPolicy a¤ects Global Market <strong>entry</strong>". NBER Work<strong>in</strong>g Paper No. 11321.[17] Lambert, D. (1992), "Zero-In‡ated Poisson Regression with an Application to Defects<strong>in</strong> Manufactur<strong>in</strong>g," Technometrics, 34, 1-14.[18] Lopes, J.A.(2009). Estudo sobre a reação de preço dos medicamentos líderes de mercadoà <strong>in</strong>trodução de concorrentes genéricos e similares. São Paulo: EESP/<strong>FGV</strong>.Unpublished Master’s Dissertation.[19] G.S. (1993). Limited-Dependent and Qualitative Variables <strong>in</strong> Econometrics. Cambridge(UK): Cambridge U.P.[20] Moreno-Torres, Junoy and Arqué (2007) –"Generic <strong>entry</strong> <strong>in</strong>to a regulated pharmaceuticalmarket". Mimeo.[21] Nishijima M, Biasoto Jr G. (2003). Os preços dos medicamentos de referência apósa entrada dos medicamentos genéricos no mercado brasileiro. Downloadable fromhttp://www.anpec.org.br/encontro2003/artigos/D29.pdf[22] Rei¤en, D. &M.E. Ward (2005) “Generic Drug Industry Dynamics”. Review <strong>of</strong> Economicsand Statistics, Vol. 87, no. 1, pp. 37-49.25
[23] Rudholm, N (2005) “Entry and the Number <strong>of</strong> Firms <strong>in</strong> the Swedish PharmaceuticalsMarket ”Review <strong>of</strong> Industrial Organization, Vol. 19, pp. 351-364.[24] Scott-Morton, F. (1999) “Entry Decisions <strong>in</strong> the Generic Pharmaceutical Industry”.Rand Journal <strong>of</strong> Economics, Vol. 30, pp. 421-440.[25] Scott-Morton, F. (2000) “Barriers to Entry, Brand Advertis<strong>in</strong>g, and Generic Entry <strong>in</strong>the U.S. Pharmaceutical Industry”International Journal <strong>of</strong> Industrial Organization,Vol. 18, pp. 1085-1104.[26] Thomas, L.G., III (1996) – "Industrial Policy and International Competitiveness<strong>in</strong> the Pharmaceutical Industry". In: Helms, R. (ed.) Competitive Strategies <strong>in</strong> thePharmaceutical Industry. Wash<strong>in</strong>gton (DC): AEI Press.26
TABLE 1Generic Drug Market Share <strong>in</strong> Selected CountriesCountry % <strong>in</strong> Revenue % <strong>in</strong> VolumeUSA 13 60Germany 26 60United K<strong>in</strong>gdom 26 60Canada 22 45France 14 35Spa<strong>in</strong> 13 30<strong>Brazil</strong> 13.8 16.9Source: Pro-Genérico.FIGURE 1Evolution <strong>of</strong> <strong>generic</strong> <strong>drug</strong> registrationsNumber <strong>of</strong> <strong>generic</strong> <strong>drug</strong> registrations,by route <strong>of</strong> adm<strong>in</strong>istration300270250240214200173164181169150127 131100500849091 918460473745 45 4820 222832 35221922 2022000 2001 2002 2003 2004 2005 2006 2007 2008 2009Injectables Orals TopicalsSource: Anvisa/NUREM (last update Feb 25, 2009).TABLE 2Evolution <strong>of</strong> <strong>generic</strong> <strong>drug</strong> presence <strong>in</strong> <strong>Brazil</strong>ian market2000 2001 2002 2003 2004 2005 2006 2007APIs 68 140 203 220 243 271 282 263Firms 11 25 31 33 36 37 40 37Drugs 118 295 503 619 818 1,040 1,169 1,099Package versions 135 490 594 1,029 1,611 2,069 2,385 2,245Source: ANVISA/NUREM.27
TABLE 3Drugs with Entry and Drugs with Generics, versus Total SampleYearShare <strong>of</strong> <strong>drug</strong>swith <strong>entry</strong> alongthe year, <strong>in</strong>numberShare <strong>of</strong> <strong>drug</strong>swith <strong>generic</strong>s, <strong>in</strong>numberShare <strong>of</strong> <strong>drug</strong>swith <strong>entry</strong> alongthe year, <strong>in</strong>revenueShare <strong>of</strong> <strong>drug</strong>swith <strong>generic</strong>s, <strong>in</strong>revenue2000 11.32 12.21 81.31 4.402001 13.93 17.93 79.37 11.082002 15.52 23.59 78.41 16.352003 12.81 25.00 65.34 19.702004 15.60 28.20 68.52 21.852005 15.78 30.94 64.10 24.592006 13.15 32.99 50.88 29.262007 12.75 34.17 60.38 33.85Source: IMS/PMB sample <strong>of</strong> s<strong>in</strong>gle-API <strong>drug</strong>s.TABLE 4Yearly <strong>generic</strong> <strong>entry</strong> across ATC-1 ClassesATC-10 1 2 3 4 5+ TotalClassA 531 51 25 12 3 4 626B 214 5 2 0 0 0 221C 750 89 26 17 8 3 893D 511 49 28 7 9 10 614G 543 27 13 6 2 0 591H 177 10 11 4 5 2 209J 641 94 56 13 13 12 829L 242 9 0 0 0 0 251M 420 42 21 6 6 11 506N 981 106 36 15 11 10 1,159P 221 7 10 2 6 5 251R 590 58 22 11 11 7 699S 402 16 9 0 2 1 430Total 6,223 563 259 93 76 65 7,27928
FIGURE 2Distribution <strong>of</strong> Accumulated Number <strong>of</strong> Entrants across Drug Markets(CDF)11010090Frequency80706050400 1 2 3 4 5 6 7 8 9 10 11 12 13 14 15 16 17 18 19 20#Entrants#Generic Entrants #Branded Entrants Total # Entrants29
#Generic Drug EntrantsTABLE 5Marg<strong>in</strong>al Effects <strong>in</strong> Count Data Regressions and Diagnostic TestsPOISSON NB2 NB1 Generalized NB ZIP ZINBdy/dx z dy/dx z dy/dx z dy/dx z dy/dx z dy/dx zRevenue Branded 2.5500E-09 0.00 2.3100E-09 3.51 2.4000E-09 4.99 2.3500E-09 1.59 1.8300E-09 1.75 2.3500E-09 1.59Revenue Drug -4.2700E-10 0.00 -3.5200E-10 -3.85 -4.6400E-10 -5.01 -5.2000E-10 -0.86 -3.7000E-10 -0.98 -5.2000E-10 -0.86Revenue Drug X Form 5.9800E-10 0.00 7.1900E-10 5.32 6.9200E-10 5.65 8.2900E-10 0.97 8.4600E-10 1.80 8.2900E-10 0.97Revenue Class -5.1600E-10 0.00 -6.5000E-10 -6.22 -5.2900E-10 -6.22 -7.7800E-10 -1.12 -7.1400E-10 -1.76 -7.7800E-10 -1.12#Firms <strong>in</strong> Class 0.002542 0.00 0.002170 5.58 0.002223 5.17 0.003646 4.16 0.002587 4.87 0.003646 4.16HHI ATC-3 Class 0.000011 0.13 0.000009 1.08 0.000010 1.00 0.000028 1.41 0.000026 2.08 0.000028 1.41HHI Drug -0.000038 0.00 -0.000028 -4.10 -0.000036 -4.68 -0.000059 -3.63 -0.000045 -4.43 -0.000059 -3.63Age <strong>of</strong> Pioneer Drug 0.003151 0.00 0.002628 6.77 0.003033 7.86 0.001371 1.54 0.000697 1.31 0.001371 1.54Revenue Phyto. Class 0.000000 0.10 0.000000 -0.30 0.000000 -0.02 0.000000 -0.32 0.000000 -1.15 0.000000 -0.32Year 2001 -0.044834 0.00 -0.013116 -0.74 -0.020775 -1.14 -0.091294 -2.80 -0.090810 -5.62 -0.091294 -2.80Year 2002 -0.036314 0.00 -0.011542 -0.66 -0.006247 -0.33 -0.083854 -2.62 -0.076659 -4.70 -0.083854 -2.62Year 2003 -0.070530 0.00 -0.042956 -2.85 -0.050606 -3.21 -0.144619 -5.07 -0.119251 -7.82 -0.144619 -5.07Year 2004 -0.046518 0.00 -0.007738 -0.43 -0.027643 -1.62 -0.092332 -2.97 -0.090195 -5.81 -0.092332 -2.97Year 2005 -0.053280 0.00 0.002648 0.14 -0.045007 -2.85 -0.079049 -2.46 -0.086238 -5.47 -0.079049 -2.46Year 2006 -0.080427 0.00 -0.045358 -3.02 -0.071338 -4.94 -0.138410 -4.80 -0.115471 -7.49 -0.138410 -4.80Year 2007 -0.106151 0.00 -0.073255 -5.55 -0.080822 -5.79 -0.196456 -7.34 -0.156614 -10.35 -0.196456 -7.34# Non-<strong>generic</strong> Brands 0.010297 0.00 0.012394 13.38 0.011123 15.09 0.113682 13.40 0.091232 10.11 0.113682 13.40#Drugs <strong>in</strong> ATC-3 Class#Drugs <strong>in</strong> Class X Form0.012191 0.00 0.010669 4.64 0.014340 5.72 0.015904 3.09 0.009576 3.14 0.015904 3.09-0.004435 0.00 -0.003299 -2.65 -0.006070 -4.44 -0.002963 -1.10 -0.001115 -0.70 -0.002963 -1.10# Extended Release Brands-0.025865 0.00 -0.006449 -1.27 -0.021914 -4.17 -0.024260 -2.67 -0.015576 -3.26 -0.024260 -2.67#Own-<strong>generic</strong>s 0.101858 0.00 0.091026 4.44 0.116086 6.32 0.147245 4.02 0.076799 4.13 0.147245 4.02#Brands <strong>of</strong> Pioneer iDrug -0.036717 0.00 -0.008695 -1.02 -0.043718 -6.78 -0.036380 -2.76 -0.021128 -3.26 -0.036380 -2.76Revenue <strong>of</strong> Pioneer DrugShare Own-<strong>generic</strong>s Drug-7.6000E-12 0.99 7.7400E-10 0.91 1.2900E-10 0.21 2.4500E-09 1.17 1.2300E-09 1.24 2.4500E-09 1.170.194513 0.12 0.125485 0.60 0.263335 1.87 0.130662 0.36 0.025785 0.14 0.130662 0.36Share Own-<strong>generic</strong>s Class0.608698 0.01 0.087520 0.26 0.446583 1.63 0.437705 0.72 0.328609 0.96 0.437705 0.72AIC 8420.67 7487.27 7399.259 7330.563 7131.444 6873.10BIC 8585.40 7665.721 7570.85 7515.88 7316.762 7072.1430
TABLE 5 (Cont<strong>in</strong>ued)POISSON NB2 NB1 Generalized NB ZIP ZINBR2/Pseudo-R20.27 0.15 0.16 0.10TeststatisticP-valueTeststatisticP-valueTeststatistic P-value Test statistic P-value Test statistic P-value Test statisticP-valueChi-Sq/F 3164.89 0.00 1352.00 0.00 1438.01 0.00 811.96 0.00 512.34 0.00 396.70 0.00Vuong test 13.20 0.00 12.22 0.00Log-likelihood -4186.34 -3717.6337 -3674.63 -3638.2813 -3538.722 -3407.55AuxiliaryregressionsGeneralized NB(ln(alpha)) ZIP (<strong>in</strong>flate) ZINB (<strong>in</strong>flate)NB2Coef Chi_sq Coef. z Coef. z Coef. zalpha 2.148194 937.41delta 1.162497 1023.41Revenue Drug -5.60E-09 -3.19 -5.48E-09 -3.75 -4.20E -09 -2.26Revenue Class3.64E-09 2.48 3.76E-09 2.97 2.68E-09 1.61# Non-<strong>generic</strong>Brands -0.7015187 -36.16 -0.577174 -12.52 -0.9592287 -10.29Constant 4.760213 37.94 3.170769 24.08 3.398706 17.831
TABLE 6Estimates <strong>of</strong> Ordered Mult<strong>in</strong>omial ModelsVariable Ord. Probit Ord. LogitRevenue Branded9.25E-09 1.43E-083.56 3.08Revenue Drug-1.77E -09 -3.37E -09-4.72 -4.79Rev. Drug X Form2.76E-09 5.28E-095.08 5.13Rev. Class-2.30E -09 -4.29E -09-5.56 -5.4# Firms <strong>in</strong> Class0.008406 0.014945.13 4.71HHI ATC -3 Class4.14E-05 0.0000751.33 1.17HHI Drug-0.0001 -0.0002-3.92 -3.72Age <strong>of</strong> Pioneer Drug 0.009343 0.0166195.91 5.58Rev. Phyto. <strong>in</strong> Class 3.94E-10 4.07E-090.08 0.45# Non-gen. Brands0.062529 0.1151918.87 19.01#Drugs Class0.052326 0.0995435.46 5.45#Drugs Class X Form -0.01771 -0.03356-3.36 -3.3# Ext-Release Brands -0.02739 -0.02039-1.29 -0.51#Own-<strong>generic</strong>s0.5201 0.923246.05 5.98#Brands Pioneer Drug -0.14332 -0.21027-4.38 -3.22Rev. Pioneer <strong>in</strong> Drug 5.30E-09 1.38E-081.56 2.29Sh. Own-gen. Drug1.0093 1.64471.21 1.29Sh. Own-gen. Class0.16581 -0.439750.12 -0.19cut11.5638 2.793113.18 11.75cut22.1645 3.940217.95 16.24cut32.6606 4.943521.6 19.79cut42.9557 5.569123.51 21.68cut53.372 6.487325.49 23.52Note: dummies for years omitted.32
TABLE 7Marg<strong>in</strong>al Effects <strong>of</strong> Ordered Probit Models for each <strong>count</strong> bracket(<strong>count</strong>s > 5 are censored)c1 c2 c3 c4 c5 c6Revenue Branded-1.68E-09 1.02E-09 4.28E -10 1.21E-10 7.74E-11 3.39E-11-3.56 3.54 3.5 3.34 3.25 3Revenue Drug3.22E-10 -1.96E-10 -8.20E -11 -2.33E -11 -1.48E -11 -6.50E-124.73 -4.68 -4.59 -4.23 -4.05 -3.6Revenue Drug X Form-5.02E-10 3.05E-10 1.28E -10 3.63E-11 2.31E-11 1.01E-11-5.14 5.05 4.96 4.54 4.33 3.78Revenue ATC-3 Class4.18E-10 -2.53E-10 -1.06E -10 -3.02E -11 -1.92E -11 -8.42E-125.63 -5.51 -5.4 -4.87 -4.62 -3.98#Firms <strong>in</strong> Class-0.00153 0.000927 0.000389 0.00011 7.03E-05 3.08E-05-5.15 5.08 4.96 4.52 4.33 3.81HHI ATC -3 Class-7.53E-06 4.57E-06 1.92E -06 5.43E-07 3.46E-07 1.52E-07-1.33 1.33 1.33 1.32 1.32 1.3HHI Drug1.9E-05 -1.2E -05 -4.83E -06 -1.37E -06 -8.73E -07 -3.83E-073.96 -3.92 -3.88 -3.67 -3.56 -3.25Age <strong>of</strong> Pioneer Drug-0.0017 0.00103 0.000432 0.000123 7.81E-05 3.42E-05-5.98 5.85 5.7 5.06 4.79 4.08Revenue Phytotherapics <strong>in</strong> -7.15E-11 4.34E-11 1.82E -11 5.16E-12 3.29E-12 1.44E-12Class -0.08 0.08 0.08 0.08 0.08 0.08Year 20010.003883 -0.00236 -0.00099 -0.00028 -0.00018 -7.7E-050.27 -0.27 -0.27 -0.27 -0.27 -0.27Year 2002-0.00489 0.002959 0.00125 0.000356 0.000228 0.000101-0.33 0.33 0.33 0.33 0.33 0.32Year 20030.026827 -0.01663 -0.0067 -0.00185 -0.00115 -0.000492.11 -2.06 -2.13 -2.15 -2.17 -2.17Year 20040.002827 -0.00172 -0.00072 -0.0002 -0.00013 -5.6E-050.2 -0.2 -0.2 -0.2 -0.2 -0.2Year 20050.005284 -0.00322 -0.00134 -0.00038 -0.00024 -0.00010.38 -0.37 -0.38 -0.38 -0.38 -0.38Year 20060.037067 -0.02317 -0.00918 -0.00251 -0.00155 -0.000653.07 -2.97 -3.11 -3.1 -3.11 -2.99Year 20070.050677 -0.03201 -0.01242 -0.00334 -0.00205 -0.000854.51 -4.31 -4.53 -4.36 -4.3 -3.89# Non-<strong>generic</strong> Brands-0.01135 0.006892 0.00289 0.00082 0.000523 0.000229-16.99 15.03 12.26 8.22 7.11 5.29#Drugs <strong>in</strong> Class-0.0095 0.005768 0.002419 0.000686 0.000437 0.000192-5.48 5.39 5.25 4.74 4.49 3.89#Drugs <strong>in</strong> Class X Form0.003216 -0.00195 -0.00082 -0.00023 -0.00015 -6.5E-053.37 -3.35 -3.32 -3.18 -3.1 -2.87# Extended Release Brands0.004973 -0.00302 -0.00127 -0.00036 -0.00023 -0.00011.29 -1.29 -1.29 -1.28 -1.28 -1.2633
TABLE 8Compar<strong>in</strong>g Information Criteria among the Four Major Count ModelsPRM BIC=-54062.637 AIC= 1.192 Prefer Over EvidenceBIC=-54991.178 dif= 928.542 NBRM PRM Very strongvs NB2 AIC= 1.059 dif= 0.132 NBRM PRMLRX2= 937.405 prob= 0.000 NBRM PRM p=0.000BIC=-55322.411 dif= 1259.774 ZIP PRM Very strongvs ZIP AIC= 1.010 dif= 0.182 ZIP PRMVuong= 13.199 prob= 0.000 ZIP PRM p=0.000BIC=-55575.895 dif= 1513.259 ZINB PRM Very strongvs ZINBAIC= 0.973 dif= 0.219 ZINB PRMNB2 BIC=-54991.178 AIC= 1.059 Prefer Over EvidenceBIC=-55322.411 dif= 331.232 ZIP NBRM Very strongvs ZIPAIC= 1.010 dif= 0.050 ZIP NBRMBIC=-55575.895 dif= 584.717 ZINB NBRM Very strongvs ZINB AIC= 0.973 dif= 0.087 ZINB NBRMVuong= 12.223 prob= 0.000 ZINB NBRM p=0.000ZIP BIC=-55322.411 AIC= 1.010 Prefer Over EvidenceBIC=-55575.895 dif= 253.484 ZINB ZIP Very strongvs ZINB AIC= 0.973 dif= 0.037 ZINB ZIPLRX2= 262.348 prob= 0.000 ZINB ZIP p=0.000TABLE 8-AComparison <strong>of</strong> Mean Observed and Predicted CountModelMaximumDifferenceAtValueMean|Diff"PRM -0.071 1 0.01NB2 -0.015 1 0.003ZIP 0.015 0 0.003ZINB 0.003 4 0.00134
TABLE 8-BPRM: Predicted and actual probabilitiesActual Predicted |Diff| Pearson0 0.853 0.801 0.052 23.4761 0.079 0.150 0.071 238.3102 0.036 0.030 0.006 7.2243 0.013 0.009 0.004 11.0674 0.011 0.004 0.007 78.0805 0.003 0.002 0.001 1.2096 0.003 0.001 0.002 21.0027 0.001 0.001 0.000 1.4188 0.001 0.000 0.001 6.3319 0.000 0.000 0.000 2.26810 0.000 0.000 0.000 0.10111 0.000 0.000 0.000 1.17312 0.000 0.000 0.000 5.08213 0.000 0.000 0.000 0.164Sum 1.000 1.000 0.143 396.907TABLE 8-CNB2: Predicted and actual probabilitiesActual Predicted |Diff| Pearson0 0.853 0.853 0.000 0.0011 0.079 0.094 0.015 17.2552 0.036 0.024 0.012 40.0943 0.013 0.009 0.004 9.2684 0.011 0.005 0.006 48.3615 0.003 0.003 0.000 0.1466 0.003 0.002 0.001 4.6447 0.001 0.001 0.000 0.4198 0.001 0.001 0.000 0.0229 0.000 0.001 0.001 5.92110 0.000 0.001 0.000 1.58211 0.000 0.001 0.001 3.86712 0.000 0.000 0.000 0.01313 0.000 0.000 0.000 1.067Sum 1.000 0.996 0.040 132.66035
TABLE 8-DZIP: Predicted and actual probabilitiesActual Predicted |Diff| Pearson0 0.853 0.837 0.015 1.9631 0.079 0.086 0.007 4.2662 0.036 0.045 0.009 12.0463 0.013 0.019 0.006 14.2294 0.011 0.008 0.003 8.2535 0.003 0.003 0.000 0.1926 0.003 0.001 0.002 21.7117 0.001 0.001 0.001 5.2708 0.001 0.000 0.001 23.8709 0.000 0.000 0.000 0.82410 0.000 0.000 0.000 5.85711 0.000 0.000 0.000 0.23012 0.000 0.000 0.000 59.35013 0.000 0.000 0.000 8.166Sum 1.000 1.000 0.045 166.227TABLE 8-EZINB: Predicted and actual probabilitiesActual Predicted |Diff| Pearson0 0.853 0.852 0.001 0.0081 0.079 0.082 0.003 0.7482 0.036 0.034 0.002 0.6843 0.013 0.015 0.002 2.5164 0.011 0.007 0.003 9.5405 0.003 0.004 0.001 2.5206 0.003 0.002 0.001 3.1987 0.001 0.001 0.000 0.0698 0.001 0.001 0.000 1.2839 0.000 0.000 0.000 3.43710 0.000 0.000 0.000 0.03611 0.000 0.000 0.000 1.57712 0.000 0.000 0.000 3.13113 0.000 0.000 0.000 0.037Sum 1.000 0.999 0.015 28.78636
FIGURE 3Deviations <strong>in</strong> Observed vs. Predicted Proportions – Count ModelsNote: positive deviations show underpredictions.Observed-Predicted-.1 -.05 0 .05 .10 1 2 3 4 5 6 7 8 9 10 11 12 13CountPRMZIPNBRMZINBGeneric Entry Count ModelsFIGURE 4Deviations <strong>in</strong> Observed vs. Predicted Proportions – ordered Models0.0030.0020.001Observed - Predicted0-0.001-0.0020 1 2 3 4 5-0.003-0.004-0.005# <strong>of</strong> EntrantsOLogitOProbit37
TABLE 9Predicted vs. Observed CountsOrdered ProbitObserved valuesPredicted values0 1 2 3 4 5+Observed<strong>count</strong>0 5,897 98 22 6 2 3 6,0281 466 65 14 4 6 1 5562 163 58 15 13 2 3 2543 54 19 11 3 5 0 924 43 18 7 4 2 1 755+ 28 16 5 6 4 6 65Predicted<strong>count</strong> 6,651 274 74 36 21 14 7,070TABLE 10Predicted vs. Observed CountsOrdered LogitObserved value sPredicted values0 1 2 3 4 5+Observed<strong>count</strong>0 5,886 103 29 5 3 2 6,0281 448 82 15 3 7 1 5562 159 53 25 12 2 3 2543 53 19 12 3 5 0 924 40 20 8 4 2 1 755+ 26 18 5 6 4 6 65Predicted<strong>count</strong> 6,612 295 94 33 23 13 7,07038
FIGURE 5Sources <strong>of</strong> zeros <strong>in</strong> the ZINB modelProbability <strong>of</strong> zeros0 .2 .4 .6 .8 10 5 10 15 20 25 30 35 40 45 50 55 60 65 70 75 80 85 90# Non-<strong>generic</strong> BrandsZeros from B<strong>in</strong>ary EquationZeros from Both EquationsZeros from Count Equation39