- Page 2 and 3:
Decision Making Using Game TheoryAn
- Page 5 and 6:
CAMBRIDGE UNIVERSITY PRESSCambridge
- Page 7 and 8:
viContents4 Sequential decision mak
- Page 9 and 10:
MMMM
- Page 11 and 12:
xPreface∑∑∑To Wnd new solutio
- Page 13 and 14:
2Introductionvying for business fro
- Page 16 and 17:
5TerminologyTable 1.1 The union’s
- Page 18 and 19:
7Classifying gamesGAME THEORYGames
- Page 20 and 21:
9A brief history of game theoryIn 1
- Page 22 and 23:
11A brief history of game theoryano
- Page 24 and 25:
13A brief history of game theoryIt
- Page 26 and 27:
15Layoutexplained. Games involving
- Page 28 and 29:
2 Games of skillIt is not from the
- Page 30 and 31:
19Linear programming, optimisation
- Page 32 and 33:
21Linear programming, optimisation
- Page 34 and 35:
23Linear programming, optimisation
- Page 36 and 37:
25Linear programming, optimisation
- Page 38 and 39:
27The Lagrange method of partial de
- Page 40 and 41:
29The Lagrange method of partial de
- Page 42 and 43:
31The Lagrange method of partial de
- Page 44 and 45:
33An introduction to basic probabil
- Page 46 and 47:
35An introduction to basic probabil
- Page 48 and 49:
37Games of chance involving riskV(X
- Page 50 and 51:
39Games of chance involving riskthe
- Page 52 and 53:
41Games of chance involving riskyu(
- Page 54 and 55:
43Games of chance involving riskExa
- Page 56 and 57:
45Games of chance involving uncerta
- Page 58 and 59:
47Games of chance involving uncerta
- Page 60 and 61:
49Representing sequential decision
- Page 62 and 63:
51Representing sequential decision
- Page 64 and 65:
53Sequential decision making in sin
- Page 66 and 67:
55Sequential decision making in sin
- Page 68 and 69:
57Sequential decision making in sin
- Page 70 and 71:
59Sequential decision making in sin
- Page 72 and 73:
61Sequential decision making in sin
- Page 74 and 75:
63Sequential decision making in sin
- Page 76 and 77:
65Sequential decision making in sin
- Page 78 and 79:
67Sequential decision making in two
- Page 80 and 81: 69Sequential decision making in two
- Page 82 and 83: 71Sequential decision making in two
- Page 84 and 85: 73Cooperative two-person gamesapply
- Page 86 and 87: 75Cooperative two-person games∑it
- Page 88 and 89: 5 Two-person zero-sum games ofstrat
- Page 90 and 91: 79Representing zero-sum gamesPlayer
- Page 92 and 93: 81Games with saddle pointsFigure 5.
- Page 94 and 95: 83Games with saddle pointsSurgeonSt
- Page 96 and 97: 85Games with saddle pointsPlayer 1a
- Page 98 and 99: 87Games with no saddle pointsPlayer
- Page 100 and 101: 89Games with no saddle pointsStrate
- Page 102 and 103: 91Large matrices generallybigger th
- Page 104 and 105: 93Interval and ordinal scales for p
- Page 106 and 107: 95Interval and ordinal scales for p
- Page 108 and 109: 97Interval and ordinal scales for p
- Page 110 and 111: 99Representing mixed-motive games a
- Page 112 and 113: 101Representing mixed-motive games
- Page 114 and 115: 103Mixed-motive games without singl
- Page 116 and 117: 105Mixed-motive games without singl
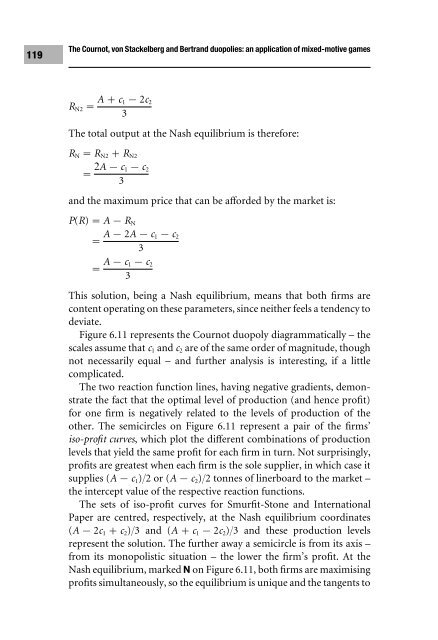
- Page 118 and 119: 107Mixed-motive games without singl
- Page 120 and 121: 109Mixed-motive games without singl
- Page 122 and 123: 111Mixed-motive games without singl
- Page 124 and 125: 113Summary of features of mixed-mot
- Page 126 and 127: 115The Cournot, von Stackelberg and
- Page 128 and 129: 117The Cournot, von Stackelberg and
- Page 132 and 133: 121The Cournot, von Stackelberg and
- Page 134 and 135: 123The Cournot, von Stackelberg and
- Page 136 and 137: 125The Cournot, von Stackelberg and
- Page 138 and 139: 127The Cournot, von Stackelberg and
- Page 140 and 141: 129Solving games without Nash equil
- Page 142 and 143: 131Solving games without Nash equil
- Page 144 and 145: 133Solving games without Nash equil
- Page 146 and 147: 7 Repeated gamesLife is an offensiv
- Page 148 and 149: 137Infinitely repeated gamesincenti
- Page 152 and 153: 141Finitely repeated gamescontinuou
- Page 154 and 155: 143Finitely repeated gamesBUPALarge
- Page 156 and 157: 145Finitely repeated gamesGHGLarge
- Page 158 and 159: 147Finitely repeated gamesNatureGHG
- Page 160 and 161: 8 Multi-person games, coalitions an
- Page 162 and 163: 151Mixed-motive multi-person gamesp
- Page 164 and 165: 153Partially cooperative multi-pers
- Page 166 and 167: 155Indices of power: measuring infl
- Page 168 and 169: 157Indices of power: measuring infl
- Page 170 and 171: 159Indices of power: measuring infl
- Page 172 and 173: 161Indices of power: measuring infl
- Page 174 and 175: 163Indices of power: measuring infl
- Page 176 and 177: 165Indices of power: measuring infl
- Page 178 and 179: 167Indices of power: measuring infl
- Page 180 and 181:
169Indices of power: measuring infl
- Page 182 and 183:
171Indices of power: measuring infl
- Page 184 and 185:
173Indices of power: measuring infl
- Page 186 and 187:
175Rationalityexperimental evidence
- Page 188 and 189:
177Indeterminacygot locked into a l
- Page 190 and 191:
179Inconsistencythe pot of £49 at
- Page 192 and 193:
181Conclusionpost-industrial econom
- Page 194 and 195:
183Appendix APlayer 1 wants to maxi
- Page 196 and 197:
185Appendix APlayer 1choosesrow 1Pl
- Page 198 and 199:
187Appendix Aon the straight line b
- Page 200 and 201:
189Appendix Amax p min q Σw ij p i
- Page 202 and 203:
191Appendix Bandp(B/A 2 )·p(A 2 )p
- Page 204 and 205:
193BibliographyBenoit, J.P. & Krish
- Page 206 and 207:
195BibliographyJenkinson, T. (Ed.)
- Page 208 and 209:
197BibliographyRobinson, M. (1975)
- Page 210 and 211:
Indexancestors and descendants 49ap
- Page 212 and 213:
201Indexmaximin principle, in chanc
- Page 214 and 215:
203Indexschool buses college cooper