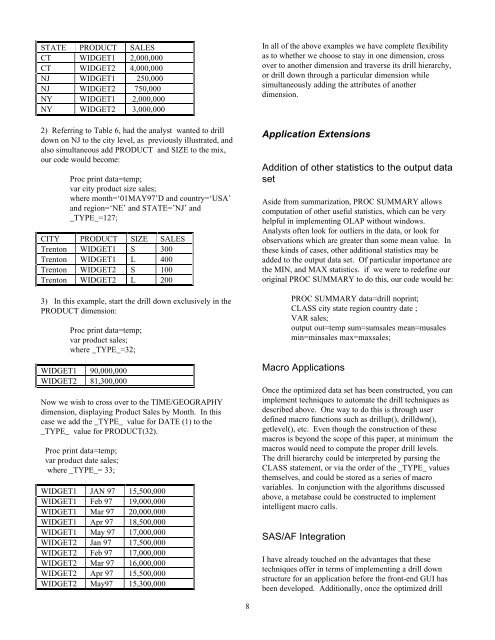
STATE PRODUCT SALESCT WIDGET1 2,000,000CT WIDGET2 4,000,000NJ WIDGET1 250,000NJ WIDGET2 750,000NY WIDGET1 2,000,000NY WIDGET2 3,000,0002) Referring to Table 6, had the analyst wanted to drilldown on NJ to the city level, as previously illustrated, andalso simultaneous add PRODUCT and SIZE to the mix,our code would become:Proc print data=temp;var city product size sales;where month=‘01MAY97’D and country=‘USA’and region=‘NE’ and STATE=’NJ’ and_TYPE_=127;CITY PRODUCT SIZE SALESTrenton WIDGET1 S 300Trenton WIDGET1 L 400Trenton WIDGET2 S 100Trenton WIDGET2 L 2003) In this example, start the drill down exclusively in thePRODUCT dimension:Proc print data=temp;var product sales;where _TYPE_=32;WIDGET1 90,000,000WIDGET2 81,300,000Now we wish to cross over to the TIME/GEOGRAPHYdimension, displaying Product Sales by Month. In thiscase we add the _TYPE_ value for DATE (1) to the_TYPE_ value for PRODUCT(32).Proc print data=temp;var product date sales;where _TYPE_= 33;WIDGET1 JAN 97 15,500,000WIDGET1 Feb 97 19,000,000WIDGET1 Mar 97 20,000,000WIDGET1 Apr 97 18,500,000WIDGET1 May 97 17,000,000WIDGET2 Jan 97 17,500,000WIDGET2 Feb 97 17,000,000WIDGET2 Mar 97 16,000,000WIDGET2 Apr 97 15,500,000WIDGET2 May97 15,300,000In all of the above examples we have complete flexibilityas to whether we choose to stay in one dimension, crossover to another dimension and traverse its drill hierarchy,or drill down through a particular dimension whilesimultaneously adding the attributes of anotherdimension.Application ExtensionsAddition of other statistics to the output datasetAside from summarization, PROC SUMMARY allowscomputation of other useful statistics, which can be veryhelpful in implementing <strong>OLAP</strong> without windows.Analysts often look for outliers in the data, or look forobservations which are greater than some mean value. Inthese kinds of cases, other additional statistics may beadded to the output data set. Of particular importance arethe MIN, and MAX statistics. if we were to redefine ouroriginal PROC SUMMARY to do this, our code would be:PROC SUMMARY data=drill noprint;CLASS city state region country date ;VAR sales;output out=temp sum=sumsales mean=musalesmin=minsales max=maxsales;Macro ApplicationsOnce the optimized data set has been constructed, you canimplement techniques to automate the drill techniques asdescribed above. One way to do this is through userdefined macro functions such as drillup(), drilldwn(),getlevel(), etc. Even though the construction of thesemacros is beyond the scope of this paper, at minimum themacros would need to compute the proper drill levels.The drill hierarchy could be interpreted by parsing theCLASS statement, or via the order of the _TYPE_ valuesthemselves, and could be stored as a series of macrovariables. In conjunction with the algorithms discussedabove, a metabase could be constructed to implementintelligent macro calls.SAS/AF IntegrationI have already touched on the advantages that thesetechniques offer in terms of implementing a drill downstructure for an application before the front-end GUI hasbeen developed. Additionally, once the optimized drill8
down database has been built, it is possible to integrateand access the database directly from within a SAS/AFFrame application, possibly using the customized macrocalls mentioned above, and Screen Control Language.Features common to such applications might include:• Identifying the drill down level. This could bedetermined via PMENU processing or by using SCLfunctions to determine which drill elements havebeen selected from within List Boxes, etc.• Once the drill level has been determined, theappropriate _TYPE_ value could then be computed,through the use of customized macros, or SCL lists.• The analyst will just about always want to subset thedata. A sub-application could be built whichconstructs a Where Statement based upon user inputand the parameters computed above, and submits theentire request to the optimized drill down databaseusing either SUBMIT CONTINUE, or SUBMIT SQLprocessing.Whatever method is used to implement integration withSAS/AF Frame applications, development could benefitfrom cost savings and increased productivity, since thedrill down access techniques and methodology will havealready been implemented and tested.Comparison with other methodsFor comparison purposes, I have identified threealternates for doing drill downs compared to the methodsI have outlined. Each has distinct advantages anddisadvantages:Comparison with PROC SQLIt is also possible to use Structured Query Language as aninterface to drill down hierarchies via the GROUP BYclause. In fact, SQL is the standard query interface formany vendors’ <strong>OLAP</strong> applications. PROC SQL wouldneed a mechanism for determining the drill downhierarchy, but once determined, could easily be expresseddue to the elegance of SQL. Since speed of query wouldprobably be an issue for larger datasets, when using thismethod, first summarize the data to the highest level ofsummarization that yields the lowest level of detail for thedrill hierarchy. Using the optimized drill down databasehas an advantage since data has already beenpresummarized and optimized for <strong>Drill</strong> <strong>Down</strong> access.Compared with other EIS applications<strong>You</strong> may decide to set up a metabase, drill down structure,and report gallery using SAS/EIS, or to constructmultidimensional cubes using one of the many specialized<strong>OLAP</strong> tools and products in the market today. Howeverthese products are not available on all users’ desktop, anddo require significant effort to get them to run the wayanalysts require. How many times have you heard “Well,this is great, but for this specific group (or month, orsample etc.) I need to look at the data in a slightlydifferent manner” ? Contrast that with the widespreadavailability of BASE SAS, the open structure of themethods, and the equivalent amount of work which wouldbe used to build the optimized drill down databasecustomized to the analysts requirements.Brute ForceFinally, we have the brute force method. Applying eachdrill down level to the original detail database.Advantages to this method are those dealing with datacurrency, data integrity, and the need to satisfy manydifferent kinds of requests. The disadvantages arenumerous. Many times there is no well thought out planconcerning the levels of the data, and as a result queriescan take a long time to run. Multiple programmers cancome up with different results due to the complexity of thedetail data. Contrast this with the optimized drill downdatabase method which imposes a logical order on thedata, and can return results extremely quickly.CONCLUSIONEvery situation demands an optimal solution, and drilldown applications are no exception. When deciding towhether or not to implement techniques such as the onesdescribed, evaluate your application to determine theadvantages and disadvantages of using the optimized drilldown database.Advantages• Speed - since the information has already been highlysummarized and data reduction has been performed,queries will run against the data extremely fast.Processing time will usually not be an issue, and theanalyst can spend more time analyzing, refining theanalysis, and presenting the data.9• Size - Space required to store the data will beminimal. Since the data is restricted to the levels