Deere & Company Investor Relations - John Deere
Deere & Company Investor Relations - John Deere
Deere & Company Investor Relations - John Deere

Create successful ePaper yourself
Turn your PDF publications into a flip-book with our unique Google optimized e-Paper software.
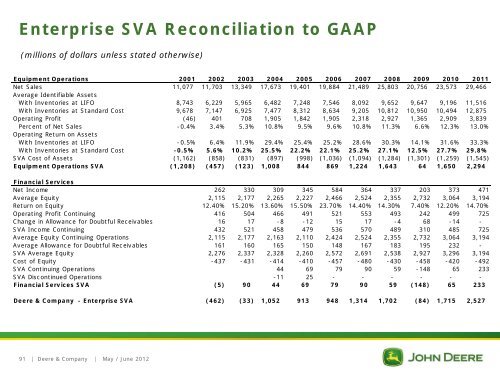
Enterprise SVA Reconciliation to GAAP<br />
(millions of dollars unless stated otherwise)<br />
Equipment Operations 2001 2002 2003 2004 2005 2006 2007 2008 2009 2010 2011<br />
Net Sales<br />
Average Identifiable Assets<br />
11,077 11,703 13,349 17,673 19,401 19,884 21,489 25,803 20,756 23,573 29,466<br />
With Inventories at LIFO 8,743 6,229 5,965 6,482 7,248 7,546 8,092 9,652 9,647 9,196 11,516<br />
With Inventories at Standard Cost 9,678 7,147 6,925 7,477 8,312 8,634 9,205 10,812 10,950 10,494 12,875<br />
Operating Profit (46) 401 708 1,905 1,842 1,905 2,318 2,927 1,365 2,909 3,839<br />
Percent of Net Sales<br />
Operating Return on Assets<br />
-0.4% 3.4% 5.3% 10.8% 9.5% 9.6% 10.8% 11.3% 6.6% 12.3% 13.0%<br />
With Inventories at LIFO -0.5% 6.4% 11.9% 29.4% 25.4% 25.2% 28.6% 30.3% 14.1% 31.6% 33.3%<br />
With Inventories at Standard Cost -0.5% 5.6% 10.2% 25.5% 22.2% 22.1% 25.2% 27.1% 12.5% 27.7% 29.8%<br />
SVA Cost of Assets (1,162) (858) (831) (897) (998) (1,036) (1,094) (1,284) (1,301) (1,259) (1,545)<br />
Equipment Operations SVA (1,208) (457) (123) 1,008 844 869 1,224 1,643 64 1,650 2,294<br />
Financial Services<br />
Net Income 262 330 309 345 584 364 337 203 373 471<br />
Average Equity 2,115 2,177 2,265 2,227 2,466 2,524 2,355 2,732 3,064 3,194<br />
Return on Equity 12.40% 15.20% 13.60% 15.50% 23.70% 14.40% 14.30% 7.40% 12.20% 14.70%<br />
Operating Profit Continuing 416 504 466 491 521 553 493 242 499 725<br />
Change in Allowance for Doubtful Receivables 16 17 -8 -12 15 17 -4 68 -14 -<br />
SVA Income Continuing 432 521 458 479 536 570 489 310 485 725<br />
Average Equity Continuing Operations 2,115 2,177 2,163 2,110 2,424 2,524 2,355 2,732 3,064 3,194<br />
Average Allowance for Doubtful Receivables 161 160 165 150 148 167 183 195 232 -<br />
SVA Average Equity 2,276 2,337 2,328 2,260 2,572 2,691 2,538 2,927 3,296 3,194<br />
Cost of Equity -437 -431 -414 -410 -457 -480 -430 -458 -420 -492<br />
SVA Continuing Operations 44 69 79 90 59 -148 65 233<br />
SVA Discontinued Operations -11 25 - - - - - -<br />
Financial Services SVA (5) 90 44 69 79 90 59 (148) 65 233<br />
<strong>Deere</strong> & <strong>Company</strong> - Enterprise SVA (462)<br />
91<br />
| <strong>Deere</strong> & <strong>Company</strong> | May / June 2012<br />
(33)<br />
1,052<br />
913<br />
948<br />
1,314<br />
1,702<br />
(84)<br />
1,715<br />
2,527