- Page 1 and 2:
HEDGE FUNDSAND PRIVATE EQUITY -A CR
- Page 3 and 4:
The need for long-term investmentTh
- Page 5 and 6:
On the basis of a coherent analysis
- Page 7 and 8:
The pension fundsWhere does all the
- Page 9 and 10:
3. The target company is merged wit
- Page 11 and 12:
Societies’ response - current nat
- Page 13 and 14:
In most of the case studies, PE inv
- Page 15 and 16:
huge tax advantages when the rate o
- Page 17 and 18:
known to bank supervisors. Those da
- Page 19 and 20:
provide transparency with respect t
- Page 21:
The demand for change and better re
- Page 24 and 25:
industrial policy, focusing on know
- Page 26 and 27:
AcknowledgementsThis report has bec
- Page 28 and 29:
The situation we are facing now is
- Page 30 and 31:
market to promote the knowledge-eco
- Page 32 and 33:
Our desire to separate the single s
- Page 34 and 35: Typically a single strategy HF oper
- Page 36 and 37: In most European countries, fund ma
- Page 38 and 39: It should also be signalled that:
- Page 40 and 41: Institutional investorsCurrent and
- Page 42 and 43: leverage in order to benefit from s
- Page 44 and 45: 1.6 The costs, the management fees
- Page 46 and 47: only remaining way to boost returns
- Page 48 and 49: A majority of hedge funds have limi
- Page 50 and 51: Our analysis is that these concerns
- Page 52 and 53: Average annual returnsTremont HF in
- Page 54 and 55: 1.11. Tendency of crowdingDespite t
- Page 56 and 57: • Corporate governance:“In the
- Page 58 and 59: Onshore FoHFsCountryUnitedKingdomGe
- Page 60 and 61: ItalyBank ofItaly•Specializedasse
- Page 62 and 63: 1.14 Societies’ response - curren
- Page 64 and 65: Investments are often in individual
- Page 66 and 67: employed 21 . Leverage effect expla
- Page 68 and 69: Investments are sold off to other c
- Page 70 and 71: Private Equity: European trends in
- Page 72 and 73: time because of the longer holding
- Page 74 and 75: Bain CapitalPartners 74.7 9Thomas H
- Page 76 and 77: Sources of new funds raised (2005)C
- Page 78 and 79: The private equity manager virtuall
- Page 80 and 81: The fund structuring arrangements f
- Page 82 and 83: ownership transfers. But buyout cap
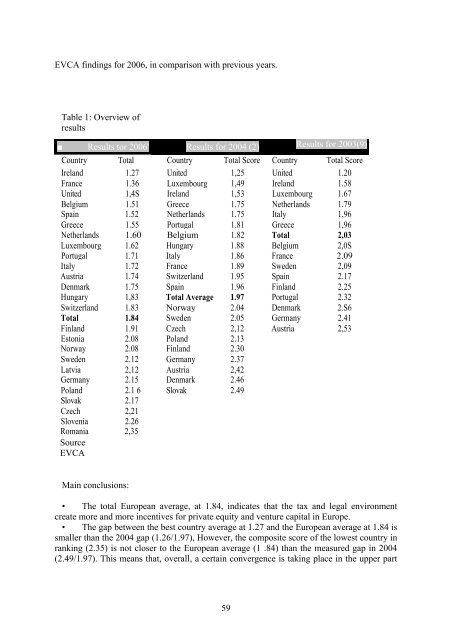
- Page 86 and 87: of the table but that less mature c
- Page 88 and 89: UCITS (Undertakings for Collective
- Page 90 and 91: Article 49Within the framework of t
- Page 92 and 93: open and secure retail markets and
- Page 94 and 95: offeree company must give its views
- Page 96 and 97: In its Communication on worker info
- Page 98 and 99: est practices, promoting innovative
- Page 100 and 101: - Work to ensure more consistent an
- Page 102 and 103: destabilising the financial markets
- Page 104 and 105: & LBOs invest. It increases financi
- Page 106 and 107: In particular, incumbent managers o
- Page 108 and 109: long-term competitiveness of the ac
- Page 110 and 111: It also leads to further weakening
- Page 112 and 113: If HFs and LBOs have brought uncert
- Page 114 and 115: the social responsibilities of comp
- Page 116 and 117: areas after recapitalisation 11 . I
- Page 118 and 119: Furthermore, the funds in many case
- Page 120 and 121: privatised with a view to stimulati
- Page 122 and 123: asset stripping, and the offering o
- Page 124 and 125: dividend to Valentia.The second pub
- Page 126 and 127: ***The three country case studies o
- Page 128 and 129: eturns well below those achieved by
- Page 130 and 131: investment funds - in the UK alone
- Page 132 and 133: 4.2 The issue of pension fundsThe p
- Page 134 and 135:
One year earlier the British Financ
- Page 136 and 137:
the fund exceeds the highest value
- Page 138 and 139:
5.3 Short sellingHistorically, hedg
- Page 140 and 141:
global financial markets. In 1998 t
- Page 142 and 143:
implications associated with the li
- Page 144 and 145:
The classic source of leverage is l
- Page 146 and 147:
I talk to have got a prayer in the
- Page 148 and 149:
The main reason for the lack of inf
- Page 150 and 151:
7. The need for change to ensure a
- Page 152 and 153:
clearly destructive must be prevent
- Page 154 and 155:
European Union.Part III is going to
- Page 156 and 157:
2. Market transparency - a common i
- Page 158 and 159:
International Settlements in Switze
- Page 160 and 161:
3.2 The main beneficiaries of regul
- Page 162 and 163:
within jurisdictions with enhanced
- Page 164 and 165:
In our view, if we want to promote
- Page 166 and 167:
investors.The EC should set up an i
- Page 168 and 169:
Alternative investment fund manager
- Page 170 and 171:
widely differing impacts of PE acti
- Page 172 and 173:
estrict investment to specific asse
- Page 174 and 175:
Clearly the governance authorities
- Page 176 and 177:
paid. There is therefore a need for
- Page 178 and 179:
5. Our immediate proposalsIn the pa
- Page 180 and 181:
isks are honestly and clearly commu
- Page 182 and 183:
Corporate governance provisionsLong
- Page 184 and 185:
ANNEX 1 - Case studiesANNEX 1 - Cas
- Page 186 and 187:
1. Company description ............
- Page 188 and 189:
AA1. Company descriptionThe Automob
- Page 190 and 191:
Autoteile Unger1. Company descripti
- Page 192 and 193:
Bulgarian Telecommunications Compan
- Page 194 and 195:
Deutsche Börse1. Company descripti
- Page 196 and 197:
DIS1. Company descriptionThe DIS De
- Page 198 and 199:
DT-GROUP1. Company descriptionDT Gr
- Page 200 and 201:
(2005 €610m) resulting in an EBIT
- Page 202 and 203:
FRANS BONHOMME1. Company descriptio
- Page 204 and 205:
Friedrich Grohe AG1. Company descri
- Page 206 and 207:
3. LBO exit (secondary LBO, IPO, li
- Page 208 and 209:
industrial sector level. A compromi
- Page 210 and 211:
Linde1. Company descriptionLinde is
- Page 212 and 213:
2.5 Protection of minority sharehol
- Page 214 and 215:
marketing outside Germany and to bo
- Page 216 and 217:
2.3 Effects on job creation, invest
- Page 218 and 219:
Peguform1. Company descriptionThe h
- Page 220 and 221:
PICARD1. Company descriptionPicard
- Page 222 and 223:
STORK1. Company descriptionThe indu
- Page 224 and 225:
TDC1. Company descriptionTDC is the
- Page 226 and 227:
TELECOM ITALIA GROUP1. Company desc
- Page 228 and 229:
2.5 Corporate governance and econom
- Page 230 and 231:
same way like some institutional in
- Page 232 and 233:
Viterra1. Company descriptionViterr
- Page 234 and 235:
Glossary 1Absolute returns: The ret
- Page 236 and 237:
Hurdle rate: A rate of return that
- Page 238:
Stock option: An individual's right