NATURALRESOURCESNATURAL RESOURCESCASE STUDYThe Pines, Doncaster VictoriaWATERCONSUMPTIONWATERDrought is a common feature of theAustralian landscape. Water restrictions are inplace in many regions of Australia due to thechronic shortage of water resulting from lowrainfall levels. We recognise that in the longtermwe need to reduce water consumptionand maximise water efficiency. To improvewater efficiency we:Environment Rating System (NABERS) tomeasure water consumption in our existingoffice buildings. For the 2008 calendaryear we achieved our 3.5 Star NABERSWater portfolio average target for<strong>Stockland</strong> managed properties with a3.6 Star average. Our medium-term targetis to achieve 4.0 Star NABERS Waterportfolio average rating by 2013,16 of our retail shopping centres in FY09to identify water-saving opportunities,and water quality for our Residential andRetirement Living projects, with a focuson appropriate water-sensitive urbandesign to manage our impacts on waterflow and quality.12 % <strong>Stockland</strong> Corporate Responsibility & Sustainability <strong>Report</strong> 30 June <strong>2009</strong>Water usage in our office portfolioIn FY09, our office sites reduced waterconsumption by 28 per cent compared to ourFY06 benchmark. This has been achievedthrough the implementation of sub-metering,water-efficient fittings and waterless urinalsthroughout our properties. In FY09 wereceived grants from Sydney Water to modifytaps and toilets at 110 Walker Street,133 Castlereagh Street, 75 George Street,77 Pacific Highway and 222 Pitt Street.Water usage in our shopping centresIn early 2008, we examined water efficiencyat 16 of our retail shopping centres. Each sitewas independently assessed by Ecosave, awater conservation organisation, and watersavingsolutions were proposed for eachsite. The predicted target water saving was78,927kL or 16.6 per cent against the usagerecorded in FY07. The project commencedin FY08 and verification of the savings wasfinalised in FY09.The water reduction from March 2008to March <strong>2009</strong> was 14.5 per cent. Whena full year has passed we expect to meetour target.Smart water metersWe have installed an online data loggingsystem that records water usage everyfive minutes, 24 hours per day. These‘smart’ water meters are connected toevery main billing meter for our retailsites, plus a number of <strong>Stockland</strong>-ownedsub-meters, at 33 <strong>Stockland</strong> retail sites.Overall, 148 meters are connected tothe ‘smart metering’ systems. In FY10,meters will be extended to six additionaloffice assets where sub-metering forwater is not already in place (a portfolio ofbuildings had sub-metering implementedin FY07 and all new office developmentsare fitted with third party managedmetering).Alarms are set off when water usageexceeds a selected amount during certainhours of the night, as high water usagewhen the building is unoccupied in mostcases signals a leak.A high water usage alarm went off at<strong>Stockland</strong> Nowra shopping centre inNew South Wales on 21 February <strong>2009</strong>when water usage exceeded 150 litresbetween 10-11pm. An investigation founda leak in a cooler connection and theproblem was rectified on 23 February.If this leak had gone undetected,2,600 litres of water an hour wouldhave been wasted.THE PINES, EAST DONCASTER,VICTORIATo reduce water consumption atThe Pines shopping centre in EastDoncaster, we implemented a numberof measures in FY09. These included:minimal flush as per AS3500National Plumbing Code,where they were leaking,with four litre flow control valves,two litre vandal proof aerators inpublic areas,Tap spindles were lubricatedwhere required,for 100 per cent operationalefficiency.We reduced our water consumptionat The Pines by 3,493kL in FY09compared to FY08.62
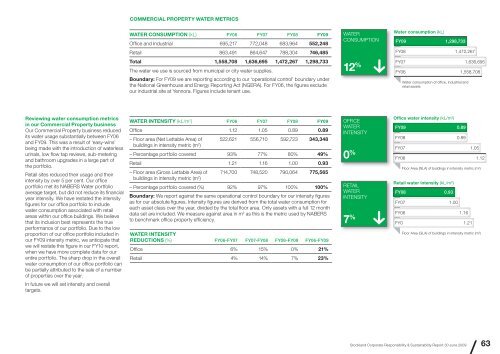
COMMERCIAL PROPERTY WATER METRICSWATER CONSUMPTION (kL) FY06 FY07 FY08 FY09Office and Industrial 695,217 772,048 683,964 552,248WATERCONSUMPTIONWater consumption (kL)FY091,298,733Retail 863,491 864,647 788,304 746,485FY081,472,267Total 1,558,708 1,636,695 1,472,267 1,298,733The water we use is sourced from municipal or city water supplies.Boundary: For FY09 we are reporting according to our ‘operational control’ boundary underthe National Greenhouse and Energy <strong>Report</strong>ing Act (NGERA). For FY06, the figures excludeour industrial site at Yennora. Figures include tenant use.12 %FY07FY06Water consumption of office, industrial andretail assets1,636,6951,558,708Reviewing water consumption metricsin our Commercial Property businessOur Commercial Property business reducedits water usage substantially between FY06and FY09. This was a result of ‘easy-wins’being made with the introduction of waterlessurinals, low flow tap reviews, sub-meteringand bathroom upgrades in a large part ofthe portfolio.Retail sites reduced their usage and theirintensity by over 5 per cent. Our officeportfolio met its NABERS Water portfolioaverage target, but did not reduce its financialyear intensity. We have restated the intensityfigures for our office portfolio to includewater consumption associated with retailareas within our office buildings. We believethat its inclusion best represents the trueperformance of our portfolio. Due to the lowproportion of our office portfolio included inour FY09 intensity metric, we anticipate thatwe will restate this figure in our FY10 report,when we have more complete data for ourentire portfolio. The sharp drop in the overallwater consumption of our office portfolio canbe partially attributed to the sale of a numberof properties over the year.WATER INTENSITY (kL/m 2 ) FY06 FY07 FY08 FY09Office 1.12 1.05 0.89 0.89– Floor area (Net Lettable Area) of 522,621 556,710 592,723 343,348buildings in intensity metric (m 2 )– Percentage portfolio covered 93% 77% 80% 49%Retail 1.21 1.16 1.00 0.93– Floor area (Gross Lettable Area) of 714,700 748,520 790,064 775,565buildings in intensity metric (m 2 )– Percentage portfolio covered (%) 92% 97% 100% 100%Boundary: We report against the same operational control boundary for our intensity figuresas for our absolute figures. Intensity figures are derived from the total water consumption foreach asset class over the year, divided by the total floor area. Only assets with a full 12 monthdata set are included. We measure against area in m 2 as this is the metric used by NABERSto benchmark office property efficiency.WATER INTENSITYREDUCTIONS (%) FY06-FY07 FY07-FY08 FY08-FY09 FY06-FY09Office 6% 15% 0% 21%Retail 4% 14% 7% 23%OFFICEWATERINTENSITY0 %RETAILWATERINTENSITYOffice water intensity (kL/m²)FY090.89FY080.89FY071.05FY061.12Floor Area (NLA) of buildings in intensity metric (m²)Retail water intensity (kL/m²)FY080.93FY071.00FY061.16FY01.21Floor Area (GLA) of buildings in intensity metric (m²)7 % <strong>Stockland</strong> Corporate Responsibility & Sustainability <strong>Report</strong> 30 June <strong>2009</strong> 63In future we will set intensity and overalltargets.