Harmonic detection and filtering - Schneider Electric
Harmonic detection and filtering - Schneider Electric
Harmonic detection and filtering - Schneider Electric

You also want an ePaper? Increase the reach of your titles
YUMPU automatically turns print PDFs into web optimized ePapers that Google loves.
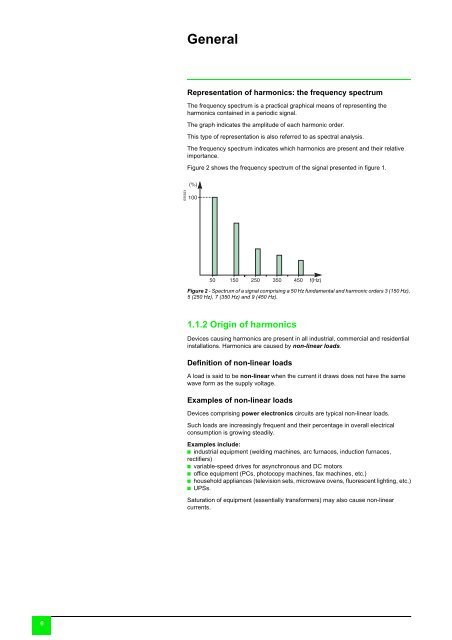
GeneralRepresentation of harmonics: the frequency spectrumThe frequency spectrum is a practical graphical means of representing theharmonics contained in a periodic signal.The graph indicates the amplitude of each harmonic order.This type of representation is also referred to as spectral analysis.The frequency spectrum indicates which harmonics are present <strong>and</strong> their relativeimportance.Figure 2 shows the frequency spectrum of the signal presented in figure 1.E55523Figure 2 - Spectrum of a signal comprising a 50 Hz fundamental <strong>and</strong> harmonic orders 3 (150 Hz),5 (250 Hz), 7 (350 Hz) <strong>and</strong> 9 (450 Hz).1.1.2 Origin of harmonicsDevices causing harmonics are present in all industrial, commercial <strong>and</strong> residentialinstallations. <strong>Harmonic</strong>s are caused by non-linear loads.Definition of non-linear loadsA load is said to be non-linear when the current it draws does not have the samewave form as the supply voltage.Examples of non-linear loadsDevices comprising power electronics circuits are typical non-linear loads.Such loads are increasingly frequent <strong>and</strong> their percentage in overall electricalconsumption is growing steadily.Examples include:b industrial equipment (welding machines, arc furnaces, induction furnaces,rectifiers)b variable-speed drives for asynchronous <strong>and</strong> DC motorsb office equipment (PCs, photocopy machines, fax machines, etc.)b household appliances (television sets, microwave ovens, fluorescent lighting, etc.)b UPSs.Saturation of equipment (essentially transformers) may also cause non-linearcurrents.6