Tutorial 2 - GUC - Faculty of Information Engineering & Technology
Tutorial 2 - GUC - Faculty of Information Engineering & Technology
Tutorial 2 - GUC - Faculty of Information Engineering & Technology

You also want an ePaper? Increase the reach of your titles
YUMPU automatically turns print PDFs into web optimized ePapers that Google loves.
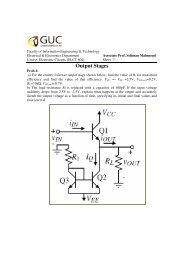
<strong>Tutorial</strong> 2Problem 1The Y-factor method is used to measure the noise figure <strong>of</strong> an amplifier, with anoise source having an ENR = 20 dB, and a cold load at a temperature <strong>of</strong> 77 K. Ifthe Y-factor ratio is measured to be 16.285 dB, what is the noise figure <strong>of</strong> theamplifier?Problem 2A certain transmission line has a noise figure F = 1 dB at a temperature T o = 290K. calculate and plot the noise figure <strong>of</strong> this line as its physical temperature rangesfrom T = 0 K to T = 1000 K.Problem 3A PCS cellular receiver front-end is shown below. The operating frequency is1805-1880 MHz, and the physical temperature <strong>of</strong> the system is 300 K. A noisesource with noise power N i = -95 dBm is applied to the receiver input.a) What is the equivalent noise temperature <strong>of</strong> the source over the operatingbandwidth?b) What is the noise figure (in dB) <strong>of</strong> the amplifier?c) What is the noise figure (in dB) <strong>of</strong> the cascaded transmission line andamplifier?d) What is the total noise power (in dBm) <strong>of</strong> the receiver output over theoperating bandwidth?Noise SourceTransmissionLineAmplifierN oN i = -95 dBm L = 1.5 dBm G = 12 dBT e = 180 KPage 1 <strong>of</strong> 3
Problem 4An amplifier with a gain <strong>of</strong> 12 dB, a bandwidth <strong>of</strong> 150 MHz, and a noise figure <strong>of</strong>4 dB feeds a receiver with a noise temperature <strong>of</strong> 900 K. Find the overall noisefigure.Problem 5Consider the WLAN receiver front-end shown below, where the bandwidth <strong>of</strong> thebandpass filter is 100 MHz centered at 2.4 GHz. If the system is at roomtemperature, find the overall noise figure. What is the resulting signal-to-noise ratioat the output is the input signal power level is -90 dBm? Can the components berearranged to give a better noise figure?IL = 1.5 dBG = 10 dBF = 2 dBG = 20 dBF = 2 dBProblem 6A two-way power divider has one output port terminated in a matched load asshown below. Find the noise figure <strong>of</strong> the resulting network if the divider is:a) An equal-split two-way resistive divider.b) A two-way Wilkinson divider.c) A 3-dB quadrature hybrid.PowerDividerZ oAssume the divider is matched and at room temperature.Page 2 <strong>of</strong> 3