Hydromagnetic waves in Earth's core and their influence on ...
Hydromagnetic waves in Earth's core and their influence on ...
Hydromagnetic waves in Earth's core and their influence on ...

Create successful ePaper yourself
Turn your PDF publications into a flip-book with our unique Google optimized e-Paper software.
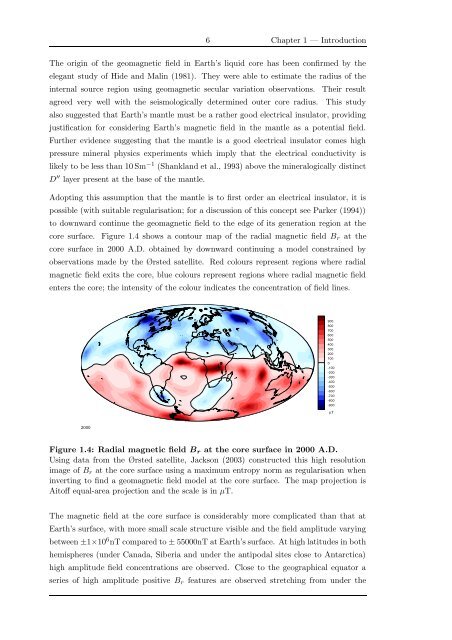
6 Chapter 1 — Introducti<strong>on</strong>The orig<str<strong>on</strong>g>in</str<strong>on</strong>g> of the geomagnetic field <str<strong>on</strong>g>in</str<strong>on</strong>g> Earth’s liquid <str<strong>on</strong>g>core</str<strong>on</strong>g> has been c<strong>on</strong>firmed by theelegant study of Hide <str<strong>on</strong>g>and</str<strong>on</strong>g> Mal<str<strong>on</strong>g>in</str<strong>on</strong>g> (1981). They were able to estimate the radius of the<str<strong>on</strong>g>in</str<strong>on</strong>g>ternal source regi<strong>on</strong> us<str<strong>on</strong>g>in</str<strong>on</strong>g>g geomagnetic secular variati<strong>on</strong> observati<strong>on</strong>s. Their resultagreed very well with the seismologically determ<str<strong>on</strong>g>in</str<strong>on</strong>g>ed outer <str<strong>on</strong>g>core</str<strong>on</strong>g> radius. This studyalso suggested that Earth’s mantle must be a rather good electrical <str<strong>on</strong>g>in</str<strong>on</strong>g>sulator, provid<str<strong>on</strong>g>in</str<strong>on</strong>g>gjustificati<strong>on</strong> for c<strong>on</strong>sider<str<strong>on</strong>g>in</str<strong>on</strong>g>g Earth’s magnetic field <str<strong>on</strong>g>in</str<strong>on</strong>g> the mantle as a potential field.Further evidence suggest<str<strong>on</strong>g>in</str<strong>on</strong>g>g that the mantle is a good electrical <str<strong>on</strong>g>in</str<strong>on</strong>g>sulator comes highpressure m<str<strong>on</strong>g>in</str<strong>on</strong>g>eral physics experiments which imply that the electrical c<strong>on</strong>ductivity islikely to be less than 10 Sm −1 (Shankl<str<strong>on</strong>g>and</str<strong>on</strong>g> et al., 1993) above the m<str<strong>on</strong>g>in</str<strong>on</strong>g>eralogically dist<str<strong>on</strong>g>in</str<strong>on</strong>g>ctD ′′ layer present at the base of the mantle.Adopt<str<strong>on</strong>g>in</str<strong>on</strong>g>g this assumpti<strong>on</strong> that the mantle is to first order an electrical <str<strong>on</strong>g>in</str<strong>on</strong>g>sulator, it ispossible (with suitable regularisati<strong>on</strong>; for a discussi<strong>on</strong> of this c<strong>on</strong>cept see Parker (1994))to downward c<strong>on</strong>t<str<strong>on</strong>g>in</str<strong>on</strong>g>ue the geomagnetic field to the edge of its generati<strong>on</strong> regi<strong>on</strong> at the<str<strong>on</strong>g>core</str<strong>on</strong>g> surface. Figure 1.4 shows a c<strong>on</strong>tour map of the radial magnetic field B r at the<str<strong>on</strong>g>core</str<strong>on</strong>g> surface <str<strong>on</strong>g>in</str<strong>on</strong>g> 2000 A.D. obta<str<strong>on</strong>g>in</str<strong>on</strong>g>ed by downward c<strong>on</strong>t<str<strong>on</strong>g>in</str<strong>on</strong>g>u<str<strong>on</strong>g>in</str<strong>on</strong>g>g a model c<strong>on</strong>stra<str<strong>on</strong>g>in</str<strong>on</strong>g>ed byobservati<strong>on</strong>s made by the Ørsted satellite. Red colours represent regi<strong>on</strong>s where radialmagnetic field exits the <str<strong>on</strong>g>core</str<strong>on</strong>g>, blue colours represent regi<strong>on</strong>s where radial magnetic fieldenters the <str<strong>on</strong>g>core</str<strong>on</strong>g>; the <str<strong>on</strong>g>in</str<strong>on</strong>g>tensity of the colour <str<strong>on</strong>g>in</str<strong>on</strong>g>dicates the c<strong>on</strong>centrati<strong>on</strong> of field l<str<strong>on</strong>g>in</str<strong>on</strong>g>es.9008007006005004003002001000-100-200-300-400-500-600-700-800-900µΤ2000Figure 1.4: Radial magnetic field B r at the <str<strong>on</strong>g>core</str<strong>on</strong>g> surface <str<strong>on</strong>g>in</str<strong>on</strong>g> 2000 A.D.Us<str<strong>on</strong>g>in</str<strong>on</strong>g>g data from the Ørsted satellite, Jacks<strong>on</strong> (2003) c<strong>on</strong>structed this high resoluti<strong>on</strong>image of B r at the <str<strong>on</strong>g>core</str<strong>on</strong>g> surface us<str<strong>on</strong>g>in</str<strong>on</strong>g>g a maximum entropy norm as regularisati<strong>on</strong> when<str<strong>on</strong>g>in</str<strong>on</strong>g>vert<str<strong>on</strong>g>in</str<strong>on</strong>g>g to f<str<strong>on</strong>g>in</str<strong>on</strong>g>d a geomagnetic field model at the <str<strong>on</strong>g>core</str<strong>on</strong>g> surface. The map projecti<strong>on</strong> isAitoff equal-area projecti<strong>on</strong> <str<strong>on</strong>g>and</str<strong>on</strong>g> the scale is <str<strong>on</strong>g>in</str<strong>on</strong>g> µT.The magnetic field at the <str<strong>on</strong>g>core</str<strong>on</strong>g> surface is c<strong>on</strong>siderably more complicated than that atEarth’s surface, with more small scale structure visible <str<strong>on</strong>g>and</str<strong>on</strong>g> the field amplitude vary<str<strong>on</strong>g>in</str<strong>on</strong>g>gbetween ±1×10 6 nT compared to ± 55000nT at Earth’s surface. At high latitudes <str<strong>on</strong>g>in</str<strong>on</strong>g> bothhemispheres (under Canada, Siberia <str<strong>on</strong>g>and</str<strong>on</strong>g> under the antipodal sites close to Antarctica)high amplitude field c<strong>on</strong>centrati<strong>on</strong>s are observed. Close to the geographical equator aseries of high amplitude positive B r features are observed stretch<str<strong>on</strong>g>in</str<strong>on</strong>g>g from under the