- Page 3: iAbstractIn this thesis east-west m
- Page 6 and 7: iv2.5.3 Filter warm-up effects <str
- Page 8 and 9: vi7.2.1 Governing
- Page 10 and 11: viiiList of Figures1.1 The geomagne
- Page 12 and 13: x5.5 Snapshots of ˜B r from DYN1 a
- Page 14 and 15: xiiList of Tables6.1 Hydrom
- Page 16 and 17: xiv̂φ Unit vector in</str
- Page 18 and 19: xviĤ Time-averaged Ĥ˜H Time-ave
- Page 20 and 21: xviiiu yu zVv nXx̂xxYŷyZẑzFlow
- Page 22 and 23: xxAcknowledgementsI would like firs
- Page 24 and 25: 2 Chapter 1 — Introductionangle b
- Page 26 and 27: 4 Chapter 1 — Introductionseen by
- Page 28 and 29: 6 Chapter 1 — IntroductionThe ori
- Page 30 and 31: 8 Chapter 1 — IntroductionPoirier
- Page 32 and 33: 10 Chapter 1 — Introductionimport
- Page 34 and 35: 12 Chapter 1 — IntroductionRau et
- Page 36 and 37: 14 Chapter 1 — Introductionof geo
- Page 38 and 39: 16Chapter 2A space-time process<str
- Page 40 and 41: 18 Chapter 2 — Space-time analysi
- Page 42 and 43: 20 Chapter 2 — Space-time analysi
- Page 44 and 45: 22 Chapter 2 — Space-time analysi
- Page 46 and 47: 24 Chapter 2 — Space-time analysi
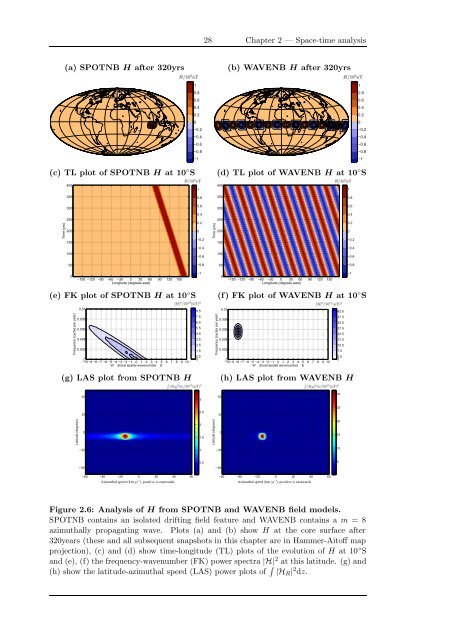
- Page 48 and 49: 26 Chapter 2 — Space-time analysi
- Page 52 and 53: 30 Chapter 2 — Space-time analysi
- Page 54 and 55: 32 Chapter 2 — Space-time analysi
- Page 56 and 57: 34 Chapter 2 — Space-time analysi
- Page 58 and 59: 36 Chapter 2 — Space-time analysi
- Page 60 and 61: 38 Chapter 2 — Space-time analysi
- Page 62 and 63: 40 Chapter 2 — Space-time analysi
- Page 64 and 65: 42 Chapter 2 — Space-time analysi
- Page 66 and 67: 44 Chapter 2 — Space-time analysi
- Page 68 and 69: 46 Chapter 2 — Space-time analysi
- Page 70 and 71: 48 Chapter 2 — Space-time analysi
- Page 72 and 73: 50 Chapter 2 — Space-time analysi
- Page 74 and 75: 52 Chapter 2 — Space-time analysi
- Page 76 and 77: 54Chapter 3Application of the space
- Page 78 and 79: 56 Chapter 3 — Historical field(a
- Page 80 and 81: 58 Chapter 3 — Historical field
- Page 82 and 83: 60 Chapter 3 — Historical field(a
- Page 84 and 85: 62 Chapter 3 — Historical field10
- Page 86 and 87: 64 Chapter 3 — Historical field(a
- Page 88 and 89: 66 Chapter 3 — Historical field(a
- Page 90 and 91: 68 Chapter 3 — Historical fieldTh
- Page 92 and 93: 70 Chapter 3 — Historical fieldso
- Page 94 and 95: 72 Chapter 3 — Historical fieldea
- Page 96 and 97: 74 Chapter 3 — Historical field(a
- Page 98 and 99: 76 Chapter 3 — Historical field(a
- Page 100 and 101:
78 Chapter 3 — Historical field40
- Page 102 and 103:
80Chapter 4Application of the space
- Page 104 and 105:
82 Chapter 4 — Archeomagnetic fie
- Page 106 and 107:
84 Chapter 4 — Archeomagnetic fie
- Page 108 and 109:
86 Chapter 4 — Archeomagnetic fie
- Page 110 and 111:
88 Chapter 4 — Archeomagnetic fie
- Page 112 and 113:
90 Chapter 4 — Archeomagnetic fie
- Page 114:
92 Chapter 4 — Archeomagnetic fie
- Page 117 and 118:
4.3.3 Hemispherical differences <st
- Page 119 and 120:
97 Chapter 4 — Archeomagnetic fie
- Page 121 and 122:
99Chapter 5Application of the space
- Page 123 and 124:
5.2.1 Radial magnetic field (B r )
- Page 125 and 126:
103 Chapter 5 — Dynamo model outp
- Page 127 and 128:
105 Chapter 5 — Dynamo model outp
- Page 129 and 130:
107 Chapter 5 — Dynamo model outp
- Page 131 and 132:
109 Chapter 5 — Dynamo model outp
- Page 133 and 134:
111 Chapter 5 — Dynamo model outp
- Page 135 and 136:
113 Chapter 5 — Dynamo model outp
- Page 137 and 138:
115 Chapter 5 — Dynamo model outp
- Page 139 and 140:
117 Chapter 5 — Dynamo model outp
- Page 141 and 142:
119 Chapter 5 — Dynamo model outp
- Page 143 and 144:
121 Chapter 5 — Dynamo model outp
- Page 145 and 146:
123 Chapter 5 — Dynamo model outp
- Page 147 and 148:
125 Chapter 5 — Dynamo model outp
- Page 149 and 150:
127 Chapter 5 — Dynamo model outp
- Page 151 and 152:
129 Chapter 5 — Dynamo model outp
- Page 153 and 154:
131 Chapter 5 — Dynamo model outp
- Page 155 and 156:
133 Chapter 5 — Dynamo model outp
- Page 157 and 158:
6.2 Survey of hydromagnetic wave li
- Page 159 and 160:
137 Chapter 6 — TheoryIn rapidly
- Page 161 and 162:
139 Chapter 6 — Theorywav
- Page 163 and 164:
141 Chapter 6 — TheoryProperties
- Page 165 and 166:
143 Chapter 6 — Theory6.5 Influen
- Page 167 and 168:
145 Chapter 6 — TheoryPlane wave
- Page 169 and 170:
147 Chapter 6 — Theory6.5.2 Full
- Page 171 and 172:
149 Chapter 6 — TheoryThe solutio
- Page 173 and 174:
151 Chapter 6 — Theory(i) Topogra
- Page 175 and 176:
153 Chapter 6 — Theoryfield where
- Page 177 and 178:
155 Chapter 6 — Theorythe length
- Page 179 and 180:
157 Chapter 6 — Theory(iii) Therm
- Page 181 and 182:
159 Chapter 6 — Theoryuniform bac
- Page 183 and 184:
161 Chapter 6 — Theorythermal Ros
- Page 185 and 186:
163 Chapter 6 — Theorybetween the
- Page 187 and 188:
165 Chapter 6 — Theoryfield becau
- Page 189 and 190:
167 Chapter 6 — Theorydue to the
- Page 191 and 192:
169 Chapter 6 — Theoryfocus<stron
- Page 193 and 194:
171 Chapter 7 — Lin</stro
- Page 195 and 196:
173 Chapter 7 — Lin</stro
- Page 197 and 198:
175 Chapter 7 — Lin</stro
- Page 199 and 200:
177 Chapter 7 — Lin</stro
- Page 201 and 202:
179 Chapter 7 — Lin</stro
- Page 203 and 204:
181 Chapter 7 — Lin</stro
- Page 205 and 206:
183 Chapter 7 — Lin</stro
- Page 207 and 208:
185 Chapter 7 — Lin</stro
- Page 209 and 210:
187 Chapter 7 — Lin</stro
- Page 211 and 212:
189 Chapter 7 — Lin</stro
- Page 213 and 214:
191 Chapter 7 — Lin</stro
- Page 215 and 216:
193 Chapter 7 — Lin</stro
- Page 217 and 218:
195 Chapter 8 — Wave flows8.2 1D
- Page 219 and 220:
197 Chapter 8 — Wave flowsthe fro
- Page 221 and 222:
199 Chapter 8 — Wave flowsso that
- Page 223 and 224:
201 Chapter 8 — Wave flows<strong
- Page 225 and 226:
203 Chapter 8 — Wave flowsbe cons
- Page 227 and 228:
205 Chapter 8 — Wave flows(a) U=1
- Page 229 and 230:
207 Chapter 8 — Wave flowsfor one
- Page 231 and 232:
209 Chapter 8 — Wave flowsIntegra
- Page 233 and 234:
211 Chapter 8 — Wave flowsField A
- Page 235 and 236:
213 Chapter 8 — Wave flows(a) m=8
- Page 237 and 238:
215 Chapter 8 — Wave flowsto aid
- Page 239 and 240:
217 Chapter 8 — Wave flowsthan th
- Page 241 and 242:
219 Chapter 8 — Wave flowssuite o
- Page 243 and 244:
221 Chapter 8 — Wave flows(a) Max
- Page 245 and 246:
223 Chapter 8 — Wave flows(a)B r
- Page 247 and 248:
225 Chapter 8 — Wave flows(a)B r
- Page 249 and 250:
227 Chapter 8 — Wave flows(a)B r
- Page 251 and 252:
229 Chapter 8 — Wave flowsFigure
- Page 253 and 254:
231 Chapter 8 — Wave flowsconcent
- Page 255 and 256:
233 Chapter 8 — Wave flows(a)B r
- Page 257 and 258:
235 Chapter 8 — Wave flowsobserve
- Page 259 and 260:
237 Chapter 8 — Wave flowsonly we
- Page 261 and 262:
239 Chapter 8 — Wave flows<strong
- Page 263 and 264:
241Chapter 9Conclusions and
- Page 265 and 266:
243 Chapter 9 — ConclusionsR=0.95
- Page 267 and 268:
245 Chapter 9 — Conclusionsresolu
- Page 269 and 270:
247 Chapter 9 — Conclusionsso lon
- Page 271 and 272:
249Appendix AHistorical geomagnetic
- Page 273 and 274:
251 Appendix A — gufm125000Freque
- Page 275 and 276:
⎢I = Arctan ⎣253 Appendix A —
- Page 277 and 278:
255 Appendix A — gufm1(a) Annual
- Page 279 and 280:
257 Appendix A — gufm1the secular
- Page 281 and 282:
259Appendix BThe archeomagnetic fie
- Page 283 and 284:
261 Appendix B — CALS7K.1Temporal
- Page 285 and 286:
B.5 Field modellin
- Page 287 and 288:
265Appendix CA 3D, convection-drive
- Page 289 and 290:
267 Appendix C — MAGICshell is re
- Page 291 and 292:
269 Appendix C — MAGICmagnetic di
- Page 293 and 294:
271 Appendix D — Governin
- Page 295 and 296:
273 Appendix D — Governin
- Page 297 and 298:
275 Appendix E — Symmetrywhile fo
- Page 299 and 300:
277 Appendix E — SymmetryOn the o
- Page 301 and 302:
279 Appendix F — AnimationsRefere
- Page 303 and 304:
281 Appendix F — AnimationsRefere
- Page 305 and 306:
283ReferencesAbramowitz, M. <strong
- Page 307 and 308:
285 ReferencesBragin</stron
- Page 309 and 310:
287 ReferencesDrazin</stron
- Page 311 and 312:
289 ReferencesGubbin</stron
- Page 313 and 314:
291 ReferencesJiang, W., Kuang, W.,
- Page 315 and 316:
293 ReferencesMete Uz, B., Yoder, J
- Page 317 and 318:
295 ReferencesSoward, A. M. Convect
- Page 319:
297 ReferencesZhang, K. and