CVHS 2010-2011 - Ceres Unified School District
CVHS 2010-2011 - Ceres Unified School District
CVHS 2010-2011 - Ceres Unified School District

You also want an ePaper? Increase the reach of your titles
YUMPU automatically turns print PDFs into web optimized ePapers that Google loves.
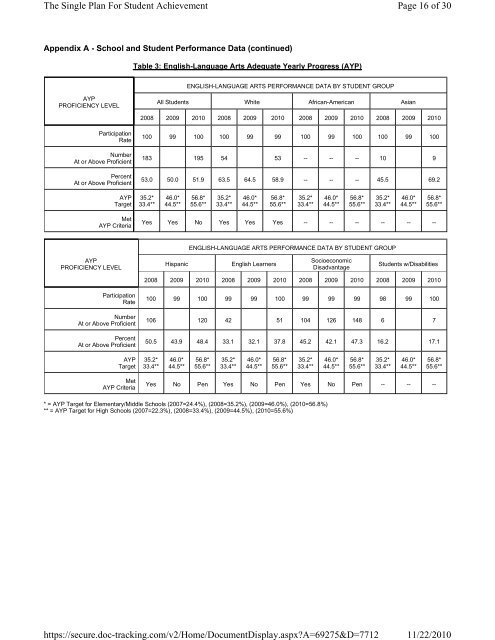
The Single Plan For Student Achievementhttps://secure.doc-tracking.com/v2/Home/DocumentDisplay.aspx?A=69275&D=7712Page 16 of 3011/22/<strong>2010</strong>Appendix A - <strong>School</strong> and Student Performance Data (continued)Table 3: English-Language Arts Adequate Yearly Progress (AYP)ENGLISH-LANGUAGE ARTS PERFORMANCE DATA BY STUDENT GROUPAYPPROFICIENCY LEVELAll Students White African-American Asian2008 2009 <strong>2010</strong> 2008 2009 <strong>2010</strong> 2008 2009 <strong>2010</strong> 2008 2009 <strong>2010</strong>ParticipationRate100 99 100 100 99 99 100 99 100 100 99 100NumberAt or Above Proficient183 195 54 53 -- -- -- 10 9PercentAt or Above Proficient53.0 50.0 51.9 63.5 64.5 58.9 -- -- -- 45.5 69.2AYP 35.2*Target 33.4**46.0*44.5**56.8*55.6**35.2*33.4**46.0*44.5**56.8*55.6**35.2*33.4**46.0*44.5**56.8*55.6**35.2*33.4**46.0*44.5**56.8*55.6**MetAYP CriteriaYes Yes No Yes Yes Yes -- -- -- -- -- --ENGLISH-LANGUAGE ARTS PERFORMANCE DATA BY STUDENT GROUPAYPPROFICIENCY LEVELHispanic English LearnersSocioeconomicDisadvantageStudents w/Disabilities2008 2009 <strong>2010</strong> 2008 2009 <strong>2010</strong> 2008 2009 <strong>2010</strong> 2008 2009 <strong>2010</strong>ParticipationRate100 99 100 99 99 100 99 99 99 98 99 100NumberAt or Above Proficient106 120 42 51 104 126 148 6 7PercentAt or Above Proficient50.5 43.9 48.4 33.1 32.1 37.8 45.2 42.1 47.3 16.2 17.1AYP 35.2*Target 33.4**46.0*44.5**56.8*55.6**35.2*33.4**46.0*44.5**56.8*55.6**35.2*33.4**46.0*44.5**56.8*55.6**35.2*33.4**46.0*44.5**56.8*55.6**MetAYP CriteriaYes No Pen Yes No Pen Yes No Pen -- -- --* = AYP Target for Elementary/Middle <strong>School</strong>s (2007=24.4%), (2008=35.2%), (2009=46.0%), (<strong>2010</strong>=56.8%)** = AYP Target for High <strong>School</strong>s (2007=22.3%), (2008=33.4%), (2009=44.5%), (<strong>2010</strong>=55.6%)