Organisational Structure as Barrier or Support in the Personal Social ...
Organisational Structure as Barrier or Support in the Personal Social ...
Organisational Structure as Barrier or Support in the Personal Social ...

Create successful ePaper yourself
Turn your PDF publications into a flip-book with our unique Google optimized e-Paper software.
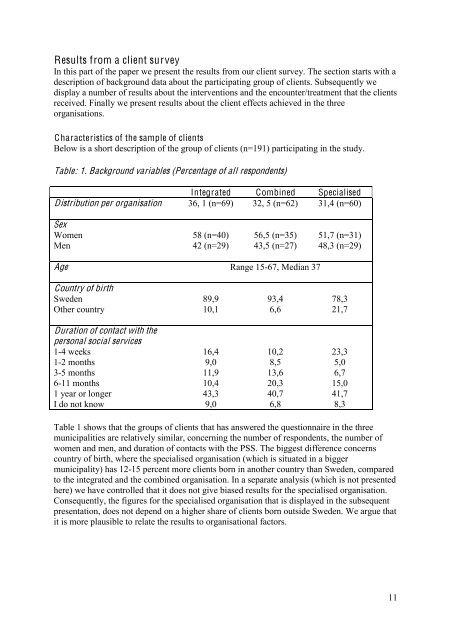
Results from a client surveyIn this part of <strong>the</strong> paper we present <strong>the</strong> results from our client survey. The section starts with adescription of background data about <strong>the</strong> participat<strong>in</strong>g group of clients. Subsequently wedisplay a number of results about <strong>the</strong> <strong>in</strong>terventions and <strong>the</strong> encounter/treatment that <strong>the</strong> clientsreceived. F<strong>in</strong>ally we present results about <strong>the</strong> client effects achieved <strong>in</strong> <strong>the</strong> three<strong>or</strong>ganisations.Characteristics of <strong>the</strong> sample of clientsBelow is a sh<strong>or</strong>t description of <strong>the</strong> group of clients (n=191) participat<strong>in</strong>g <strong>in</strong> <strong>the</strong> study.Table: 1. Background variables (Percentage of all respondents)Integrated Comb<strong>in</strong>ed SpecialisedDistribution per <strong>or</strong>ganisation 36, 1 (n=69) 32, 5 (n=62) 31,4 (n=60)SexWomen 58 (n=40) 56,5 (n=35) 51,7 (n=31)Men 42 (n=29) 43,5 (n=27) 48,3 (n=29)Age Range 15-67, Median 37Country of birthSweden 89,9 93,4 78,3O<strong>the</strong>r country 10,1 6,6 21,7Duration of contact with <strong>the</strong>personal social services1-4 weeks 16,4 10,2 23,31-2 months 9,0 8,5 5,03-5 months 11,9 13,6 6,76-11 months 10,4 20,3 15,01 year <strong>or</strong> longer 43,3 40,7 41,7I do not know 9,0 6,8 8,3Table 1 shows that <strong>the</strong> groups of clients that h<strong>as</strong> answered <strong>the</strong> questionnaire <strong>in</strong> <strong>the</strong> threemunicipalities are relatively similar, concern<strong>in</strong>g <strong>the</strong> number of respondents, <strong>the</strong> number ofwomen and men, and duration of contacts with <strong>the</strong> PSS. The biggest difference concernscountry of birth, where <strong>the</strong> specialised <strong>or</strong>ganisation (which is situated <strong>in</strong> a biggermunicipality) h<strong>as</strong> 12-15 percent m<strong>or</strong>e clients b<strong>or</strong>n <strong>in</strong> ano<strong>the</strong>r country than Sweden, comparedto <strong>the</strong> <strong>in</strong>tegrated and <strong>the</strong> comb<strong>in</strong>ed <strong>or</strong>ganisation. In a separate analysis (which is not presentedhere) we have controlled that it does not give bi<strong>as</strong>ed results f<strong>or</strong> <strong>the</strong> specialised <strong>or</strong>ganisation.Consequently, <strong>the</strong> figures f<strong>or</strong> <strong>the</strong> specialised <strong>or</strong>ganisation that is displayed <strong>in</strong> <strong>the</strong> subsequentpresentation, does not depend on a higher share of clients b<strong>or</strong>n outside Sweden. We argue thatit is m<strong>or</strong>e plausible to relate <strong>the</strong> results to <strong>or</strong>ganisational fact<strong>or</strong>s.11