Climate Action Plan - ACUPCC Reports - Climate Commitment
Climate Action Plan - ACUPCC Reports - Climate Commitment
Climate Action Plan - ACUPCC Reports - Climate Commitment

You also want an ePaper? Increase the reach of your titles
YUMPU automatically turns print PDFs into web optimized ePapers that Google loves.
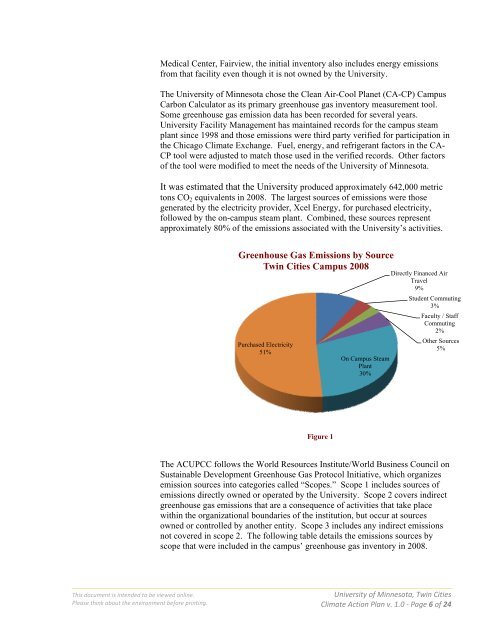
Medical Center, Fairview, the initial inventory also includes energy emissionsfrom that facility even though it is not owned by the University.The University of Minnesota chose the Clean Air-Cool <strong>Plan</strong>et (CA-CP) CampusCarbon Calculator as its primary greenhouse gas inventory measurement tool.Some greenhouse gas emission data has been recorded for several years.University Facility Management has maintained records for the campus steamplant since 1998 and those emissions were third party verified for participation inthe Chicago <strong>Climate</strong> Exchange. Fuel, energy, and refrigerant factors in the CA-CP tool were adjusted to match those used in the verified records. Other factorsof the tool were modified to meet the needs of the University of Minnesota.It was estimated that the University produced approximately 642,000 metrictons CO 2 equivalents in 2008. The largest sources of emissions were thosegenerated by the electricity provider, Xcel Energy, for purchased electricity,followed by the on-campus steam plant. Combined, these sources representapproximately 80% of the emissions associated with the University’s activities.Greenhouse Gas Emissions by SourceTwin Cities Campus 2008Purchased Electricity51%Directly Financed AirTravel9%Student Commuting3%Faculty / StaffCommuting2%Other Sources5%On Campus Steam<strong>Plan</strong>t30%Figure 1The <strong>ACUPCC</strong> follows the World Resources Institute/World Business Council onSustainable Development Greenhouse Gas Protocol Initiative, which organizesemission sources into categories called “Scopes.” Scope 1 includes sources ofemissions directly owned or operated by the University. Scope 2 covers indirectgreenhouse gas emissions that are a consequence of activities that take placewithin the organizational boundaries of the institution, but occur at sourcesowned or controlled by another entity. Scope 3 includes any indirect emissionsnot covered in scope 2. The following table details the emissions sources byscope that were included in the campus’ greenhouse gas inventory in 2008.This document is intended to be viewed online.Please think about the environment before printing.University of Minnesota, Twin Cities<strong>Climate</strong> <strong>Action</strong> <strong>Plan</strong> v. 1.0 ‐ Page 6 of 24