Doing Business with the World - Mapeo de Promotores de RSE
Doing Business with the World - Mapeo de Promotores de RSE
Doing Business with the World - Mapeo de Promotores de RSE

You also want an ePaper? Increase the reach of your titles
YUMPU automatically turns print PDFs into web optimized ePapers that Google loves.
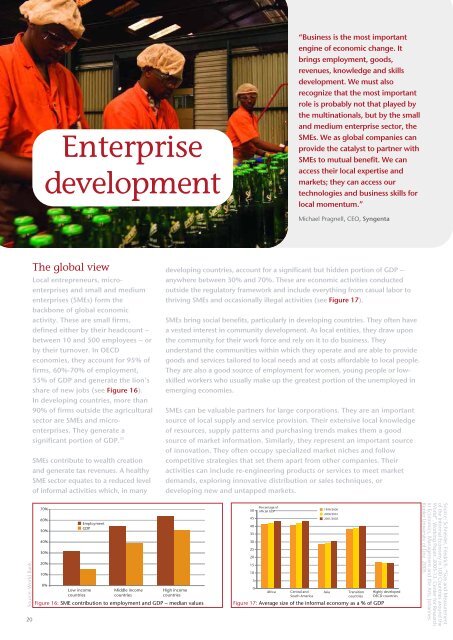
Enterprise<strong>de</strong>velopment“<strong>Business</strong> is <strong>the</strong> most importantengine of economic change. Itbrings employment, goods,revenues, knowledge and skills<strong>de</strong>velopment. We must alsorecognize that <strong>the</strong> most importantrole is probably not that played by<strong>the</strong> multinationals, but by <strong>the</strong> smalland medium enterprise sector, <strong>the</strong>SMEs. We as global companies canprovi<strong>de</strong> <strong>the</strong> catalyst to partner <strong>with</strong>SMEs to mutual benefit. We canaccess <strong>the</strong>ir local expertise andmarkets; <strong>the</strong>y can access ourtechnologies and business skills forlocal momentum.”Michael Pragnell, CEO, SyngentaThe global viewLocal entrepreneurs, microenterprisesand small and mediumenterprises (SMEs) form <strong>the</strong>backbone of global economicactivity. These are small firms,<strong>de</strong>fined ei<strong>the</strong>r by <strong>the</strong>ir headcount –between 10 and 500 employees – orby <strong>the</strong>ir turnover. In OECDeconomies, <strong>the</strong>y account for 95% offirms, 60%-70% of employment,55% of GDP and generate <strong>the</strong> lion’sshare of new jobs (see Figure 16).In <strong>de</strong>veloping countries, more than90% of firms outsi<strong>de</strong> <strong>the</strong> agriculturalsector are SMEs and microenterprises.They generate asignificant portion of GDP. 25SMEs contribute to wealth creationand generate tax revenues. A healthySME sector equates to a reduced levelof informal activities which, in many<strong>de</strong>veloping countries, account for a significant but hid<strong>de</strong>n portion of GDP –anywhere between 30% and 70%. These are economic activities conductedoutsi<strong>de</strong> <strong>the</strong> regulatory framework and inclu<strong>de</strong> everything from casual labor tothriving SMEs and occasionally illegal activities (see Figure 17).SMEs bring social benefits, particularly in <strong>de</strong>veloping countries. They often havea vested interest in community <strong>de</strong>velopment. As local entities, <strong>the</strong>y draw upon<strong>the</strong> community for <strong>the</strong>ir work force and rely on it to do business. Theyun<strong>de</strong>rstand <strong>the</strong> communities <strong>with</strong>in which <strong>the</strong>y operate and are able to provi<strong>de</strong>goods and services tailored to local needs and at costs affordable to local people.They are also a good source of employment for women, young people or lowskilledworkers who usually make up <strong>the</strong> greatest portion of <strong>the</strong> unemployed inemerging economies.SMEs can be valuable partners for large corporations. They are an importantsource of local supply and service provision. Their extensive local knowledgeof resources, supply patterns and purchasing trends makes <strong>the</strong>m a goodsource of market information. Similarly, <strong>the</strong>y represent an important sourceof innovation. They often occupy specialized market niches and followcompetitive strategies that set <strong>the</strong>m apart from o<strong>the</strong>r companies. Theiractivities can inclu<strong>de</strong> re-engineering products or services to meet market<strong>de</strong>mands, exploring innovative distribution or sales techniques, or<strong>de</strong>veloping new and untapped markets.Source: <strong>World</strong> Bank.2070%60%50%40%30%20%10%0%Low incomecountriesEmploymentGDPMiddle incomecountriesHigh incomecountriesFigure 16: SME contribution to employment and GDP – median values50454035302520151050Percentage ofofficial GDPAfricaCentral andSouth America1999/20002000/20012001/2002AsiaTransitioncountriesFigure 17: Average size of <strong>the</strong> informal economy as a % of GDPHighly <strong>de</strong>velopedOECD countriesSource: Schnei<strong>de</strong>r, Friedrich. “Size and Measurementof <strong>the</strong> Informal Economy in 100 Countries around <strong>the</strong><strong>World</strong>”. Working Paper. 2005-13. Center for Researchin Economics, Management and <strong>the</strong> Arts, JohannesKepler University of Linz. 2005.