Directional Waves in the Nearshore Coastal Region of Perth ...
Directional Waves in the Nearshore Coastal Region of Perth ...
Directional Waves in the Nearshore Coastal Region of Perth ...

You also want an ePaper? Increase the reach of your titles
YUMPU automatically turns print PDFs into web optimized ePapers that Google loves.
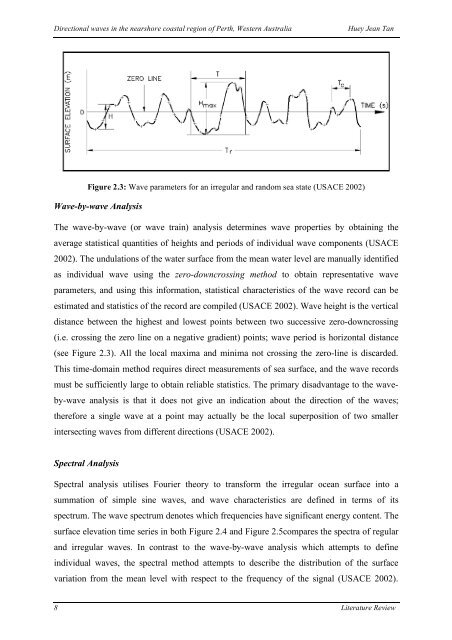
<strong>Directional</strong> waves <strong>in</strong> <strong>the</strong> nearshore coastal region <strong>of</strong> <strong>Perth</strong>, Western AustraliaHuey Jean TanFigure 2.3: Wave parameters for an irregular and random sea state (USACE 2002)Wave-by-wave AnalysisThe wave-by-wave (or wave tra<strong>in</strong>) analysis determ<strong>in</strong>es wave properties by obta<strong>in</strong><strong>in</strong>g <strong>the</strong>average statistical quantities <strong>of</strong> heights and periods <strong>of</strong> <strong>in</strong>dividual wave components (USACE2002). The undulations <strong>of</strong> <strong>the</strong> water surface from <strong>the</strong> mean water level are manually identifiedas <strong>in</strong>dividual wave us<strong>in</strong>g <strong>the</strong> zero-downcross<strong>in</strong>g method to obta<strong>in</strong> representative waveparameters, and us<strong>in</strong>g this <strong>in</strong>formation, statistical characteristics <strong>of</strong> <strong>the</strong> wave record can beestimated and statistics <strong>of</strong> <strong>the</strong> record are compiled (USACE 2002). Wave height is <strong>the</strong> verticaldistance between <strong>the</strong> highest and lowest po<strong>in</strong>ts between two successive zero-downcross<strong>in</strong>g(i.e. cross<strong>in</strong>g <strong>the</strong> zero l<strong>in</strong>e on a negative gradient) po<strong>in</strong>ts; wave period is horizontal distance(see Figure 2.3). All <strong>the</strong> local maxima and m<strong>in</strong>ima not cross<strong>in</strong>g <strong>the</strong> zero-l<strong>in</strong>e is discarded.This time-doma<strong>in</strong> method requires direct measurements <strong>of</strong> sea surface, and <strong>the</strong> wave recordsmust be sufficiently large to obta<strong>in</strong> reliable statistics. The primary disadvantage to <strong>the</strong> waveby-waveanalysis is that it does not give an <strong>in</strong>dication about <strong>the</strong> direction <strong>of</strong> <strong>the</strong> waves;<strong>the</strong>refore a s<strong>in</strong>gle wave at a po<strong>in</strong>t may actually be <strong>the</strong> local superposition <strong>of</strong> two smaller<strong>in</strong>tersect<strong>in</strong>g waves from different directions (USACE 2002).Spectral AnalysisSpectral analysis utilises Fourier <strong>the</strong>ory to transform <strong>the</strong> irregular ocean surface <strong>in</strong>to asummation <strong>of</strong> simple s<strong>in</strong>e waves, and wave characteristics are def<strong>in</strong>ed <strong>in</strong> terms <strong>of</strong> itsspectrum. The wave spectrum denotes which frequencies have significant energy content. Thesurface elevation time series <strong>in</strong> both Figure 2.4 and Figure 2.5compares <strong>the</strong> spectra <strong>of</strong> regularand irregular waves. In contrast to <strong>the</strong> wave-by-wave analysis which attempts to def<strong>in</strong>e<strong>in</strong>dividual waves, <strong>the</strong> spectral method attempts to describe <strong>the</strong> distribution <strong>of</strong> <strong>the</strong> surfacevariation from <strong>the</strong> mean level with respect to <strong>the</strong> frequency <strong>of</strong> <strong>the</strong> signal (USACE 2002).8 Literature Review