Lake Pocotopaug Lake and Watershed Restoration Evaluation ...
Lake Pocotopaug Lake and Watershed Restoration Evaluation ...
Lake Pocotopaug Lake and Watershed Restoration Evaluation ...

You also want an ePaper? Increase the reach of your titles
YUMPU automatically turns print PDFs into web optimized ePapers that Google loves.
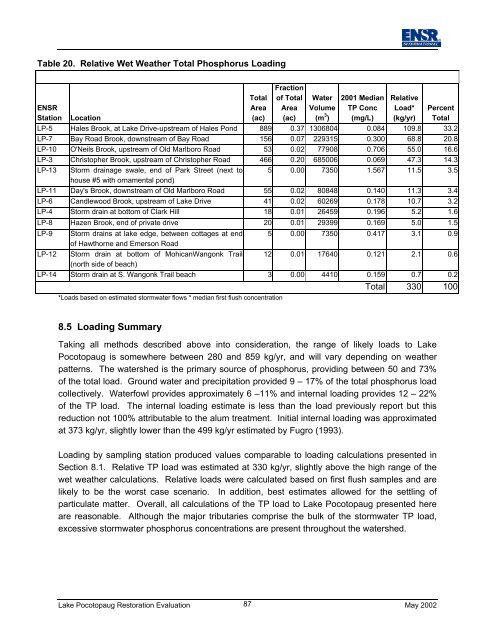
Table 20. Relative Wet Weather Total Phosphorus LoadingENSRStationLocationTotalArea(ac)Fractionof TotalArea(ac)WaterVolume(m 3 )2001 MedianTP Conc(mg/L)RelativeLoad*(kg/yr)PercentTotalLP-5 Hales Brook, at <strong>Lake</strong> Drive-upstream of Hales Pond 889 0.37 1306804 0.084 109.8 33.2LP-7 Bay Road Brook, downstream of Bay Road 156 0.07 229315 0.300 68.8 20.8LP-10 O'Neils Brook, upstream of Old Marlboro Road 53 0.02 77908 0.706 55.0 16.6LP-3 Christopher Brook, upstream of Christopher Road 466 0.20 685006 0.069 47.3 14.3LP-13 Storm drainage swale, end of Park Street (next to 5 0.00 7350 1.567 11.5 3.5house #5 with ornamental pond)LP-11 Day's Brook, downstream of Old Marlboro Road 55 0.02 80848 0.140 11.3 3.4LP-6 C<strong>and</strong>lewood Brook, upstream of <strong>Lake</strong> Drive 41 0.02 60269 0.178 10.7 3.2LP-4 Storm drain at bottom of Clark Hill 18 0.01 26459 0.196 5.2 1.6LP-8 Hazen Brook, end of private drive 20 0.01 29399 0.169 5.0 1.5LP-9 Storm drains at lake edge, between cottages at end 5 0.00 7350 0.417 3.1 0.9of Hawthorne <strong>and</strong> Emerson RoadLP-12 Storm drain at bottom of MohicanWangonk Trail 12 0.01 17640 0.121 2.1 0.6(north side of beach)LP-14 Storm drain at S. Wangonk Trail beach 3 0.00 4410 0.159 0.7 0.2*Loads based on estimated stormwater flows * median first flush concentrationTotal 330 1008.5 Loading SummaryTaking all methods described above into consideration, the range of likely loads to <strong>Lake</strong><strong>Pocotopaug</strong> is somewhere between 280 <strong>and</strong> 859 kg/yr, <strong>and</strong> will vary depending on weatherpatterns. The watershed is the primary source of phosphorus, providing between 50 <strong>and</strong> 73%of the total load. Ground water <strong>and</strong> precipitation provided 9 – 17% of the total phosphorus loadcollectively. Waterfowl provides approximately 6 –11% <strong>and</strong> internal loading provides 12 – 22%of the TP load. The internal loading estimate is less than the load previously report but thisreduction not 100% attributable to the alum treatment. Initial internal loading was approximatedat 373 kg/yr, slightly lower than the 499 kg/yr estimated by Fugro (1993).Loading by sampling station produced values comparable to loading calculations presented inSection 8.1. Relative TP load was estimated at 330 kg/yr, slightly above the high range of thewet weather calculations. Relative loads were calculated based on first flush samples <strong>and</strong> arelikely to be the worst case scenario. In addition, best estimates allowed for the settling ofparticulate matter. Overall, all calculations of the TP load to <strong>Lake</strong> <strong>Pocotopaug</strong> presented hereare reasonable. Although the major tributaries comprise the bulk of the stormwater TP load,excessive stormwater phosphorus concentrations are present throughout the watershed.<strong>Lake</strong> <strong>Pocotopaug</strong> <strong>Restoration</strong> <strong>Evaluation</strong> 87May 2002