Construction of Iso-contours, Bisectors and Voronoi Diagrams on ...
Construction of Iso-contours, Bisectors and Voronoi Diagrams on ...
Construction of Iso-contours, Bisectors and Voronoi Diagrams on ...

You also want an ePaper? Increase the reach of your titles
YUMPU automatically turns print PDFs into web optimized ePapers that Google loves.
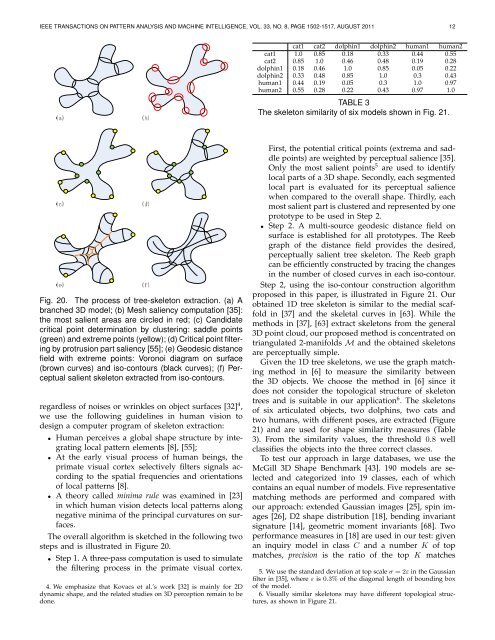
IEEE TRANSACTIONS ON PATTERN ANALYSIS AND MACHINE INTELLIGENCE, VOL. 33, NO. 8, PAGE 1502-1517, AUGUST 2011 12cat1 cat2 dolphin1 dolphin2 human1 human2cat1 1.0 0.85 0.18 0.33 0.44 0.55cat2 0.85 1.0 0.46 0.48 0.19 0.28dolphin1 0.18 0.46 1.0 0.85 0.05 0.22dolphin2 0.33 0.48 0.85 1.0 0.3 0.43human1 0.44 0.19 0.05 0.3 1.0 0.97human2 0.55 0.28 0.22 0.43 0.97 1.0TABLE 3The skelet<strong>on</strong> similarity <str<strong>on</strong>g>of</str<strong>on</strong>g> six models shown in Fig. 21.Fig. 20. The process <str<strong>on</strong>g>of</str<strong>on</strong>g> tree-skelet<strong>on</strong> extracti<strong>on</strong>. (a) Abranched 3D model; (b) Mesh saliency computati<strong>on</strong> [35]:the most salient areas are circled in red; (c) C<str<strong>on</strong>g>and</str<strong>on</strong>g>idatecritical point determinati<strong>on</strong> by clustering: saddle points(green) <str<strong>on</strong>g>and</str<strong>on</strong>g> extreme points (yellow); (d) Critical point filteringby protrusi<strong>on</strong> part saliency [55]; (e) Geodesic distancefield with extreme points: <str<strong>on</strong>g>Vor<strong>on</strong>oi</str<strong>on</strong>g> diagram <strong>on</strong> surface(brown curves) <str<strong>on</strong>g>and</str<strong>on</strong>g> iso-<str<strong>on</strong>g>c<strong>on</strong>tours</str<strong>on</strong>g> (black curves); (f) Perceptualsalient skelet<strong>on</strong> extracted from iso-<str<strong>on</strong>g>c<strong>on</strong>tours</str<strong>on</strong>g>.regardless <str<strong>on</strong>g>of</str<strong>on</strong>g> noises or wrinkles <strong>on</strong> object surfaces [32] 4 ,we use the following guidelines in human visi<strong>on</strong> todesign a computer program <str<strong>on</strong>g>of</str<strong>on</strong>g> skelet<strong>on</strong> extracti<strong>on</strong>:• Human perceives a global shape structure by integratinglocal pattern elements [8], [55];• At the early visual process <str<strong>on</strong>g>of</str<strong>on</strong>g> human beings, theprimate visual cortex selectively filters signals accordingto the spatial frequencies <str<strong>on</strong>g>and</str<strong>on</strong>g> orientati<strong>on</strong>s<str<strong>on</strong>g>of</str<strong>on</strong>g> local patterns [8].• A theory called minima rule was examined in [23]in which human visi<strong>on</strong> detects local patterns al<strong>on</strong>gnegative minima <str<strong>on</strong>g>of</str<strong>on</strong>g> the principal curvatures <strong>on</strong> surfaces.The overall algorithm is sketched in the following twosteps <str<strong>on</strong>g>and</str<strong>on</strong>g> is illustrated in Figure 20.• Step 1. A three-pass computati<strong>on</strong> is used to simulatethe filtering process in the primate visual cortex.4. We emphasize that Kovacs et al.’s work [32] is mainly for 2Ddynamic shape, <str<strong>on</strong>g>and</str<strong>on</strong>g> the related studies <strong>on</strong> 3D percepti<strong>on</strong> remain to bed<strong>on</strong>e.First, the potential critical points (extrema <str<strong>on</strong>g>and</str<strong>on</strong>g> saddlepoints) are weighted by perceptual salience [35].Only the most salient points 5 are used to identifylocal parts <str<strong>on</strong>g>of</str<strong>on</strong>g> a 3D shape. Sec<strong>on</strong>dly, each segmentedlocal part is evaluated for its perceptual saliencewhen compared to the overall shape. Thirdly, eachmost salient part is clustered <str<strong>on</strong>g>and</str<strong>on</strong>g> represented by <strong>on</strong>eprototype to be used in Step 2.• Step 2. A multi-source geodesic distance field <strong>on</strong>surface is established for all prototypes. The Reebgraph <str<strong>on</strong>g>of</str<strong>on</strong>g> the distance field provides the desired,perceptually salient tree skelet<strong>on</strong>. The Reeb graphcan be efficiently c<strong>on</strong>structed by tracing the changesin the number <str<strong>on</strong>g>of</str<strong>on</strong>g> closed curves in each iso-c<strong>on</strong>tour.Step 2, using the iso-c<strong>on</strong>tour c<strong>on</strong>structi<strong>on</strong> algorithmproposed in this paper, is illustrated in Figure 21. Ourobtained 1D tree skelet<strong>on</strong> is similar to the medial scaffoldin [37] <str<strong>on</strong>g>and</str<strong>on</strong>g> the skeletal curves in [63]. While themethods in [37], [63] extract skelet<strong>on</strong>s from the general3D point cloud, our proposed method is c<strong>on</strong>centrated <strong>on</strong>triangulated 2-manifolds M <str<strong>on</strong>g>and</str<strong>on</strong>g> the obtained skelet<strong>on</strong>sare perceptually simple.Given the 1D tree skelet<strong>on</strong>s, we use the graph matchingmethod in [6] to measure the similarity betweenthe 3D objects. We choose the method in [6] since itdoes not c<strong>on</strong>sider the topological structure <str<strong>on</strong>g>of</str<strong>on</strong>g> skelet<strong>on</strong>trees <str<strong>on</strong>g>and</str<strong>on</strong>g> is suitable in our applicati<strong>on</strong> 6 . The skelet<strong>on</strong>s<str<strong>on</strong>g>of</str<strong>on</strong>g> six articulated objects, two dolphins, two cats <str<strong>on</strong>g>and</str<strong>on</strong>g>two humans, with different poses, are extracted (Figure21) <str<strong>on</strong>g>and</str<strong>on</strong>g> are used for shape similarity measures (Table3). From the similarity values, the threshold 0.8 wellclassifies the objects into the three correct classes.To test our approach in large databases, we use theMcGill 3D Shape Benchmark [43]. 190 models are selected<str<strong>on</strong>g>and</str<strong>on</strong>g> categorized into 19 classes, each <str<strong>on</strong>g>of</str<strong>on</strong>g> whichc<strong>on</strong>tains an equal number <str<strong>on</strong>g>of</str<strong>on</strong>g> models. Five representativematching methods are performed <str<strong>on</strong>g>and</str<strong>on</strong>g> compared withour approach: extended Gaussian images [25], spin images[26], D2 shape distributi<strong>on</strong> [18], bending invariantsignature [14], geometric moment invariants [68]. Twoperformance measures in [18] are used in our test: givenan inquiry model in class C <str<strong>on</strong>g>and</str<strong>on</strong>g> a number K <str<strong>on</strong>g>of</str<strong>on</strong>g> topmatches, precisi<strong>on</strong> is the ratio <str<strong>on</strong>g>of</str<strong>on</strong>g> the top K matches5. We use the st<str<strong>on</strong>g>and</str<strong>on</strong>g>ard deviati<strong>on</strong> at top scale σ = 2ε in the Gaussianfilter in [35], where ε is 0.3% <str<strong>on</strong>g>of</str<strong>on</strong>g> the diag<strong>on</strong>al length <str<strong>on</strong>g>of</str<strong>on</strong>g> bounding box<str<strong>on</strong>g>of</str<strong>on</strong>g> the model.6. Visually similar skelet<strong>on</strong>s may have different topological structures,as shown in Figure 21.