Construction of Iso-contours, Bisectors and Voronoi Diagrams on ...
Construction of Iso-contours, Bisectors and Voronoi Diagrams on ...
Construction of Iso-contours, Bisectors and Voronoi Diagrams on ...

You also want an ePaper? Increase the reach of your titles
YUMPU automatically turns print PDFs into web optimized ePapers that Google loves.
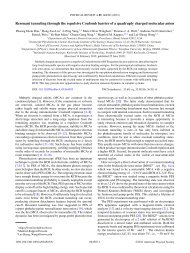
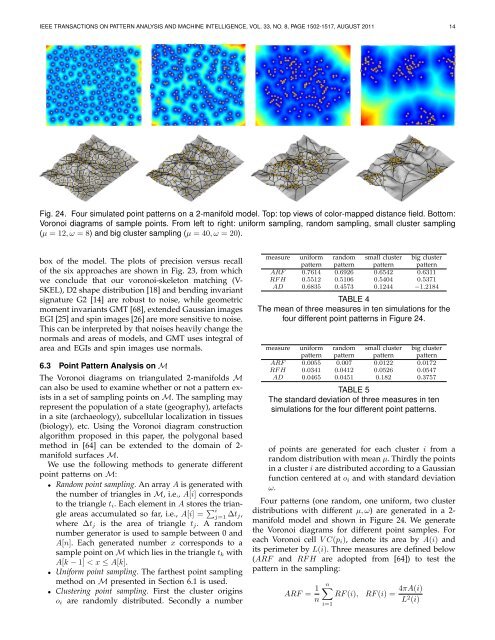
IEEE TRANSACTIONS ON PATTERN ANALYSIS AND MACHINE INTELLIGENCE, VOL. 33, NO. 8, PAGE 1502-1517, AUGUST 2011 14Fig. 24. Four simulated point patterns <strong>on</strong> a 2-manifold model. Top: top views <str<strong>on</strong>g>of</str<strong>on</strong>g> color-mapped distance field. Bottom:<str<strong>on</strong>g>Vor<strong>on</strong>oi</str<strong>on</strong>g> diagrams <str<strong>on</strong>g>of</str<strong>on</strong>g> sample points. From left to right: uniform sampling, r<str<strong>on</strong>g>and</str<strong>on</strong>g>om sampling, small cluster sampling(µ = 12, ω = 8) <str<strong>on</strong>g>and</str<strong>on</strong>g> big cluster sampling (µ = 40, ω = 20).box <str<strong>on</strong>g>of</str<strong>on</strong>g> the model. The plots <str<strong>on</strong>g>of</str<strong>on</strong>g> precisi<strong>on</strong> versus recall<str<strong>on</strong>g>of</str<strong>on</strong>g> the six approaches are shown in Fig. 23, from whichwe c<strong>on</strong>clude that our vor<strong>on</strong>oi-skelet<strong>on</strong> matching (V-SKEL), D2 shape distributi<strong>on</strong> [18] <str<strong>on</strong>g>and</str<strong>on</strong>g> bending invariantsignature G2 [14] are robust to noise, while geometricmoment invariants GMT [68], extended Gaussian imagesEGI [25] <str<strong>on</strong>g>and</str<strong>on</strong>g> spin images [26] are more sensitive to noise.This can be interpreted by that noises heavily change thenormals <str<strong>on</strong>g>and</str<strong>on</strong>g> areas <str<strong>on</strong>g>of</str<strong>on</strong>g> models, <str<strong>on</strong>g>and</str<strong>on</strong>g> GMT uses integral <str<strong>on</strong>g>of</str<strong>on</strong>g>area <str<strong>on</strong>g>and</str<strong>on</strong>g> EGIs <str<strong>on</strong>g>and</str<strong>on</strong>g> spin images use normals.6.3 Point Pattern Analysis <strong>on</strong> MThe <str<strong>on</strong>g>Vor<strong>on</strong>oi</str<strong>on</strong>g> diagrams <strong>on</strong> triangulated 2-manifolds Mcan also be used to examine whether or not a pattern existsin a set <str<strong>on</strong>g>of</str<strong>on</strong>g> sampling points <strong>on</strong> M. The sampling mayrepresent the populati<strong>on</strong> <str<strong>on</strong>g>of</str<strong>on</strong>g> a state (geography), artefactsin a site (archaeology), subcellular localizati<strong>on</strong> in tissues(biology), etc. Using the <str<strong>on</strong>g>Vor<strong>on</strong>oi</str<strong>on</strong>g> diagram c<strong>on</strong>structi<strong>on</strong>algorithm proposed in this paper, the polyg<strong>on</strong>al basedmethod in [64] can be extended to the domain <str<strong>on</strong>g>of</str<strong>on</strong>g> 2-manifold surfaces M.We use the following methods to generate differentpoint patterns <strong>on</strong> M:• R<str<strong>on</strong>g>and</str<strong>on</strong>g>om point sampling. An array A is generated withthe number <str<strong>on</strong>g>of</str<strong>on</strong>g> triangles in M, i.e., A[i] corresp<strong>on</strong>dsto the triangle t i . Each element in A stores the triangleareas accumulated so far, i.e., A[i] = ∑ ij=1 ∆t j,where ∆t j is the area <str<strong>on</strong>g>of</str<strong>on</strong>g> triangle t j . A r<str<strong>on</strong>g>and</str<strong>on</strong>g>omnumber generator is used to sample between 0 <str<strong>on</strong>g>and</str<strong>on</strong>g>A[n]. Each generated number x corresp<strong>on</strong>ds to asample point <strong>on</strong> M which lies in the triangle t k withA[k − 1] < x ≤ A[k].• Uniform point sampling. The farthest point samplingmethod <strong>on</strong> M presented in Secti<strong>on</strong> 6.1 is used.• Clustering point sampling. First the cluster originso i are r<str<strong>on</strong>g>and</str<strong>on</strong>g>omly distributed. Sec<strong>on</strong>dly a numbermeasure uniform r<str<strong>on</strong>g>and</str<strong>on</strong>g>om small cluster big clusterpattern pattern pattern patternARF 0.7614 0.6926 0.6542 0.6311RF H 0.5512 0.5106 0.5404 0.5371AD 0.6835 0.4573 0.1244 −1.2184TABLE 4The mean <str<strong>on</strong>g>of</str<strong>on</strong>g> three measures in ten simulati<strong>on</strong>s for thefour different point patterns in Figure 24.measure uniform r<str<strong>on</strong>g>and</str<strong>on</strong>g>om small cluster big clusterpattern pattern pattern patternARF 0.0055 0.007 0.0122 0.0172RF H 0.0341 0.0412 0.0526 0.0547AD 0.0465 0.0451 0.182 0.3757TABLE 5The st<str<strong>on</strong>g>and</str<strong>on</strong>g>ard deviati<strong>on</strong> <str<strong>on</strong>g>of</str<strong>on</strong>g> three measures in tensimulati<strong>on</strong>s for the four different point patterns.<str<strong>on</strong>g>of</str<strong>on</strong>g> points are generated for each cluster i from ar<str<strong>on</strong>g>and</str<strong>on</strong>g>om distributi<strong>on</strong> with mean µ. Thirdly the pointsin a cluster i are distributed according to a Gaussianfuncti<strong>on</strong> centered at o i <str<strong>on</strong>g>and</str<strong>on</strong>g> with st<str<strong>on</strong>g>and</str<strong>on</strong>g>ard deviati<strong>on</strong>ω.Four patterns (<strong>on</strong>e r<str<strong>on</strong>g>and</str<strong>on</strong>g>om, <strong>on</strong>e uniform, two clusterdistributi<strong>on</strong>s with different µ, ω) are generated in a 2-manifold model <str<strong>on</strong>g>and</str<strong>on</strong>g> shown in Figure 24. We generatethe <str<strong>on</strong>g>Vor<strong>on</strong>oi</str<strong>on</strong>g> diagrams for different point samples. Foreach <str<strong>on</strong>g>Vor<strong>on</strong>oi</str<strong>on</strong>g> cell V C(p i ), denote its area by A(i) <str<strong>on</strong>g>and</str<strong>on</strong>g>its perimeter by L(i). Three measures are defined below(ARF <str<strong>on</strong>g>and</str<strong>on</strong>g> RF H are adopted from [64]) to test thepattern in the sampling:ARF = 1 nn∑RF (i),i=1RF (i) = 4πA(i)L 2 (i)