

Jharkhand - DISE
Jharkhand - DISE
Jharkhand - DISE

You also want an ePaper? Increase the reach of your titles
YUMPU automatically turns print PDFs into web optimized ePapers that Google loves.
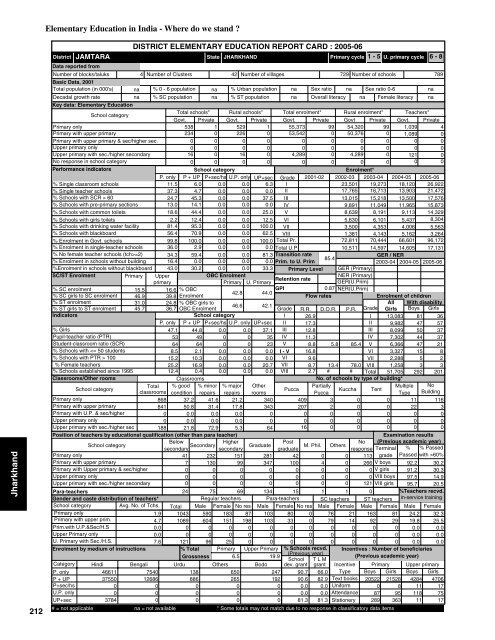
<strong>Jharkhand</strong>212Elementary Education in India - Where do we stand ?JAMTARADistrictData reported fromNumber of blocks/taluksBasic Data, 2001Total population (in 000's)Decadal growth rateDISTRICT ELEMENTARY EDUCATION REPORT CARD : 2005-06State4 Number of Clusters 42 Number of villages729 Number of schools789na % 0 - 6 population na % Urban population na Sex ratio na Sex ratio 0-6nana % SC population na % ST population na Overall literacy na Female literacy naPrimary cycle 1 - 5 U. primary cycle 6 - 8% SC enrolment15.5 16.6 % OBCGPI0.8742.8 44.0% SC girls to SC enrolment 46.9 39.8 EnrolmentFlow ratesEnrolment of children% ST enrolment31.0 24.8 % OBC girls toAll With disability46.6 42.1% ST girls to ST enrolment 45.7 36.7 OBC EnrolmentGrade R.R. D.O.R. P.R. Grade Girls Boys GirlsIndicatorsSchool categoryI 26.9I 13,083 81 36P. only P + UP P+sec/hs U.P. only UP+sec II 17.3II 9,982 47 57% Girls47.1 44.8 0.0 0.0 37.1 III 12.8III 8,099 50 37Pupil-teacher ratio (PTR)53 49 0 0 35 IV 11.3IV 7,302 44 37Student-classroom ratio (SCR)64 64 0 0 23 V 8.8 5.8 85.4 V 6,366 47 21% Schools with 10015.2 10.3 0.0 0.0 0.0 VI 9.6VII 2,288 5 2% Female teachers25.2 16.9 0.0 0.0 20.7 VII 8.7 13.4 78.0 VIII 1,258 3 3% Schools established since 199512.4 0.4 0.0 0.0 0.0 VIII 2.7 # # Total 51,705 292 201Classrooms/Other roomsClassroomsNo. of schools by type of building*School categoryTotal % good % minor % major OtherPartiallyMultiple NoPuccaKuccha Tentclassrooms condition repairs repairs roomsPuccaType BuildingPrimary only868 37.2 41.6 21.2 340 409 3 0 0 11 116Primary with upper primary841 50.8 31.4 17.8 343 207 2 0 0 22 3Primary with U.P. & sec/higher0 0.0 0.0 0.000 0 0 0 0 0Upper primary only0 0.0 0.0 0.000 0 0 0 0 0Upper primary with sec./higher sec 188 21.8 72.9 5.3 6416 0 0 0 0 0Position of teachers by educational qualification (other than para teacher)Examination resultsSchool category BelowHigherPost(Previous academic year)M. Phil.secondarysecondarygraduateNoresponse Terminal % % Passed41 232 151 281 42 0 0 113 grade Passed with >60%V boys7 130 99 347 100 4 0 26692.2 30.20 0 0 0 0 0 0 0 V girls 91.2 30.3Upper primary only0 0 0 0 0 0 0 0 VIII boys 97.5 14.9Upper primary with sec./higher secondary0 0 0 0 0 0 0 121 VIII girls 95.7 20.5Para-teachers24 75 69 134 15 1 1 0%Teachers recvd.Gender and caste distribution of teachers*Regular teachers Para-teachers SC teachers ST teachers in-service trainingSchool categoryAvg. No. of Tchs. Total Male Female No res Male Female No res Male Female Male Female Male FemalePrimary only1.9 1043 590 183 87 103 80 0 76 21 163 81 24.2 32.3Primary with upper prim.4.7 1089 604 151 198 103 33 0 79 14 92 29 19.8 25.5Prim.with U.P.&Sec/H.S0.0 0 0 0 0 0 0 0 0 0 0 0 0.0 0.0Upper Primary only0.0 0 0 0 0 0 0 0 0 0 0 0 0.0 0.0U. Primary with Sec./H.S.7.6 121 96 25 0 0 0 0 0 0 0 0 0.0 0.0Enrolment by medium of instructions% Total Primary Upper Primary % Schools recvd. Incentives : Number of beneficiaries(Previous year)Grossness 6.5 19.9(Previous academic year)School T L MCategory Hindi Bengali Urdu Others Bodo dev. grant grantPrimary Upper primary46611Boys Girls Boys Girls37550003784754012686000138886000JHARKHANDKey data: Elementary EducationSchool categoryTotal schools* Rural schools* Total enrolment* Rural enrolment* Teachers*Govt. Private Govt. Private Govt. Private Govt Private Govt. PrivatePrimary only538 1 529 1 55,373 99 54,320 99 1,039 4Primary with upper primary234 0 226 0 53,542 0 50,376 0 1,089 0Primary with upper primary & sec/higher sec.0 0 0 0 0 0 0 0 0 0Upper primary only0 0 0 0 0 0 0 0 0 0Upper primary with sec./higher secondary16 0 16 0 4,289 0 4,289 0 121 0No response in school category0 0 0 0 0 0 0 0 0 0Performance indicatorsSchool categoryEnrolment*P. only P + UP P+sec/hs U.P. only UP+sec Grade 2001-02 2002-03 2003-04 2004-05 2005-06% Single classroom schools11.5 6.0 0.0 0.0 6.3 I23,501 19,273 18,120 26,922% Single teacher schools37.3 4.7 0.0 0.0 0.0 II17,765 16,713 13,903 21,472% Schools with SCR > 6024.7 45.3 0.0 0.0 37.5 III13,015 15,218 13,500 17,576% Schools with pre-primary sections 13.0 14.1 0.0 0.0 0.0 IV9,891 11,049 11,965 15,873% Schools with common toilets 18.6 44.4 0.0 0.0 25.0 V8,639 8,191 9,113 14,329% Schools with girls toilets 2.2 12.4 0.0 0.0 12.5 VI5,630 6,101 5,437 8,304% Schools with drinking water facility 81.4 95.3 0.0 0.0 100.0 VII3,500 4,353 4,006 5,563% Schools with blackboard56.4 70.9 0.0 0.0 62.5 VIII 1,381 4,143 5,162 3,264% Enrolment in Govt. schools 99.8 100.0 0.0 0.0 100.0 Total Pr. 72,811 70,444 66,601 96,172% Enrolment in single-teacher schools 36.0 2.9 0.0 0.0 0.0 Total U.P10,511 14,597 14,605 17,131% No female teacher schools (tch>=2) 34.3 59.4 0.0 0.0 81.3 Transition rateGER / NER85.4% Enrolment in schools without building 16.4 0.0 0.0 0.0 0.0 Prim. to U. Prim2003-04 2004-05 2005-06%Enrolment in schools without blackboard 43.0 30.2 0.0 0.0 33.3 Primary LevelSC/ST EnrolmentPrimary UpperOBC EnrolmentprimaryPrimary U. PrimaryRetention ratePrimary onlyPrimary with upper primaryPrimary with Upper primary & sec/higherP. onlyP + UPP+sec/hsU.P. onlyUP+sec65026500024719200090.790.60.00.081.366.082.90.00.081.3GER (Primary)NER (Primary)GER(U.Prim)NER(U.Prim)IncentiveTypeText booksUniformAttendanceStationery# = not applicable na = not available * Some totals may not match due to no response in classificatory data items2052208728921528895363428411118114706177517


