

Jharkhand - DISE
Jharkhand - DISE
Jharkhand - DISE

You also want an ePaper? Increase the reach of your titles
YUMPU automatically turns print PDFs into web optimized ePapers that Google loves.
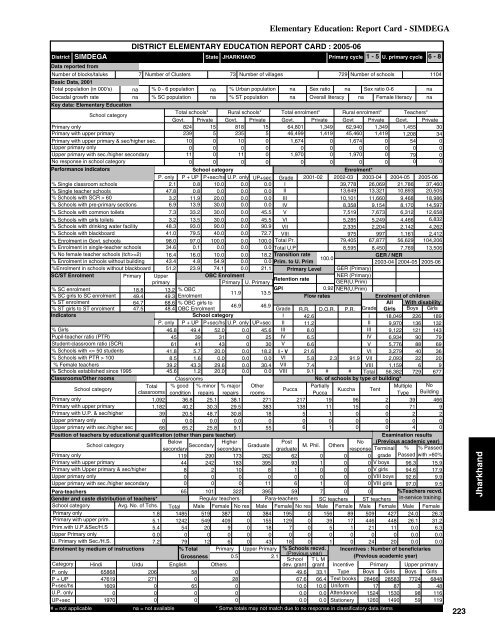
SIMDEGADistrictData reported fromNumber of blocks/taluksBasic Data, 2001Total population (in 000's)Decadal growth rateDISTRICT ELEMENTARY EDUCATION REPORT CARD : 2005-06State7 Number of Clusters 73 Number of villages729 Number of schools1104na % 0 - 6 population na % Urban population na Sex ratio na Sex ratio 0-6nana % SC population na % ST population na Overall literacy na Female literacy naPrimary cycle 1 - 5 U. primary cycle 6 - 8% SC enrolment18.8 13.2 % OBCGPI0.9211.9 13.5% SC girls to SC enrolment 49.4 49.3 EnrolmentFlow ratesEnrolment of children% ST enrolment64.7 68.6 % OBC girls toAll With disability46.9 46.9% ST girls to ST enrolment 47.5 48.4 OBC EnrolmentGrade R.R. D.O.R. P.R. Grade Girls Boys GirlsIndicatorsSchool categoryI 42.6I 18,049 226 189P. only P + UP P+sec/hs U.P. only UP+sec II 11.2II 9,970 136 132% Girls46.8 49.4 52.0 0.0 45.6 III 8.0III 9,122 121 143Pupil-teacher ratio (PTR)45 39 31 0 25 IV 6.5IV 6,934 90 79Student-classroom ratio (SCR)61 41 43 0 30 V 6.6V 5,776 88 69% Schools with 1008.5 1.6 0.0 0.0 0.0 VI 5.8 2.3 91.9 VII 2,093 22 20% Female teachers39.2 43.3 29.6 0.0 30.4 VII 7.4VIII 1,159 6 9% Schools established since 199545.6 1.2 20.0 0.0 0.0 VIII 9.1 # # Total 56,382 729 677Classrooms/Other roomsClassroomsNo. of schools by type of building*School categoryTotal % good % minor % major OtherPartiallyMultiple NoPuccaKuccha Tentclassrooms condition repairs repairs roomsPuccaType BuildingPrimary only1,092 36.8 25.1 38.1 271 217 19 96 2 39 466Primary with upper primary1,182 40.2 30.3 29.5 383 138 11 15 0 71 9Primary with U.P. & sec/higher39 20.5 48.7 30.8 185 1 0 0 2 2Upper primary only0 0.0 0.0 0.000 0 0 0 0 0Upper primary with sec./higher sec66 65.2 25.8 9.1 556 1 0 0 4 0Position of teachers by educational qualification (other than para teacher)Examination resultsSchool category BelowHigherPost(Previous academic year)M. Phil.secondarysecondarygraduateNoresponse Terminal % % Passed119 290 173 262 62 0 0 0 grade Passed with >60%V boys44 242 183 395 93 1 0 096.3 15.98 2 10 8 1 0 0 0 V girls 94.6 17.9Upper primary only0 0 0 0 0 0 0 0 VIII boys 92.6 9.9Upper primary with sec./higher secondary0 0 0 11 6 1 0 0 VIII girls 97.0 9.5Para-teachers65 101 322 395 59 7 0 0%Teachers recvd.Gender and caste distribution of teachers*Regular teachers Para-teachers SC teachers ST teachers in-service trainingSchool categoryAvg. No. of Tchs. Total Male Female No res Male Female No res Male Female Male Female Male FemalePrimary only1.8 1485 519 387 0 384 195 0 156 89 509 427 24.0 26.3Primary with upper prim.5.1 1242 549 409 0 155 129 0 39 17 446 448 26.1 31.2Prim.with U.P.&Sec/H.S5.4 54 20 9 0 18 7 0 5 1 21 11 0.0 6.3Upper Primary only0.0 0 0 0 0 0 0 0 0 0 0 0 0.0 0.0U. Primary with Sec./H.S.7.2 79 12 6 0 43 18 0 1 0 24 20 0.0 0.0Enrolment by medium of instructions% Total Primary Upper Primary % Schools recvd. Incentives : Number of beneficiaries(Previous year)Grossness 0.5 2.1(Previous academic year)School T L MCategory Hindi Urdu English Othersdev. grant grantPrimary Upper primary65868Boys Girls Boys Girls476191609019702062710005806500JHARKHANDKey data: Elementary EducationSchool categoryTotal schools* Rural schools* Total enrolment* Rural enrolment* Teachers*Govt. Private Govt. Private Govt. Private Govt Private Govt. PrivatePrimary only824 15 818 15 64,801 1,349 62,940 1,349 1,455 30Primary with upper primary239 5 235 5 46,499 1,419 45,460 1,419 1,208 34Primary with upper primary & sec/higher sec.10 0 10 0 1,674 0 1,674 0 54 0Upper primary only0 0 0 0 0 0 0 0 0 0Upper primary with sec./higher secondary11 0 11 0 1,970 0 1,970 0 79 0No response in school category0 0 0 0 0 0 0 0 0 0Performance indicatorsSchool categoryEnrolment*P. only P + UP P+sec/hs U.P. only UP+sec Grade 2001-02 2002-03 2003-04 2004-05 2005-06% Single classroom schools2.1 0.8 10.0 0.0 0.0 I39,778 26,069 21,786 37,460% Single teacher schools47.8 0.8 0.0 0.0 0.0 II13,649 13,321 10,893 20,505% Schools with SCR > 603.2 11.9 20.0 0.0 0.0 III10,101 11,660 9,468 18,986% Schools with pre-primary sections 6.9 13.9 30.0 0.0 0.0 IV8,358 9,154 8,170 14,597% Schools with common toilets 7.3 33.2 30.0 0.0 45.5 V7,519 7,673 6,312 12,658% Schools with girls toilets 3.2 13.5 30.0 0.0 45.5 VI5,285 5,249 4,466 6,832% Schools with drinking water facility 48.3 93.0 90.0 0.0 90.9 VII2,335 2,204 2,142 4,262% Schools with blackboard41.0 79.5 40.0 0.0 72.7 VIII 975 997 1,161 2,412% Enrolment in Govt. schools 98.0 97.0 100.0 0.0 100.0 Total Pr. 79,405 67,877 56,629 104,206% Enrolment in single-teacher schools 34.6 0.1 0.0 0.0 0.0 Total U.P8,595 8,450 7,769 13,506% No female teacher schools (tch>=2) 16.4 16.0 10.0 0.0 18.2 Transition rateGER / NER100.0% Enrolment in schools without building 43.4 4.8 54.9 0.0 0.0 Prim. to U. Prim2003-04 2004-05 2005-06%Enrolment in schools without blackboard 51.2 23.9 74.1 0.0 21.1 Primary LevelSC/ST EnrolmentPrimary UpperOBC EnrolmentprimaryPrimary U. PrimaryRetention ratePrimary onlyPrimary with upper primaryPrimary with Upper primary & sec/higherP. onlyP + UPP+sec/hsU.P. onlyUP+sec028000Elementary Education: Report Card - SIMDEGA49.667.610.00.00.033.166.410.00.00.0GER (Primary)NER (Primary)GER(U.Prim)NER(U.Prim)IncentiveTypeText booksUniformAttendanceStationery# = not applicable na = not available * Some totals may not match due to no response in classificatory data items284661715241260285838715301490772439859684848116119223<strong>Jharkhand</strong>


