

Jharkhand - DISE
Jharkhand - DISE
Jharkhand - DISE

Create successful ePaper yourself
Turn your PDF publications into a flip-book with our unique Google optimized e-Paper software.
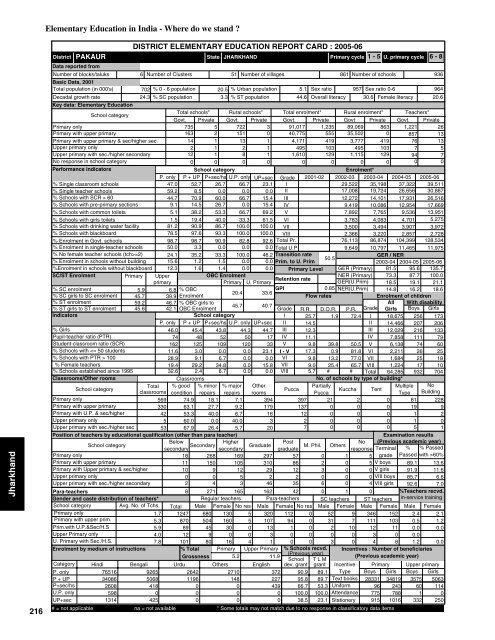
<strong>Jharkhand</strong>216Elementary Education in India - Where do we stand ?PAKAURDistrictData reported fromNumber of blocks/taluksBasic Data, 2001Total population (in 000's)Decadal growth rateDISTRICT ELEMENTARY EDUCATION REPORT CARD : 2005-06State6 Number of Clusters 51 Number of villages861 Number of schools936702 % 0 - 6 population 20.5 % Urban population 5.1 Sex ratio 957 Sex ratio 0-696424.3 % SC population 3.3 % ST population44.6 Overall literacy 30.6 Female literacy 20.6Primary cycle 1 - 5 U. primary cycle 6 - 8Key data: Elementary EducationSchool categoryTotal schools* Rural schools* Total enrolment* Rural enrolment* Teachers*Govt. Private Govt. Private Govt. Private Govt Private Govt. PrivatePrimary only735 5 722 3 91,017 1,235 89,069 863 1,221 26Primary with upper primary163 2 151 0 40,775 555 35,502 0 857 13Primary with upper primary & sec/higher sec.14 1 13 1 4,171 419 3,777 419 76 13Upper primary only2 1 2 1 495 103 495 103 7 5Upper primary with sec./higher secondary12 1 8 1 1,610 129 1,115 129 94 7No response in school category0 0 0 0 0 0 0 0 0 0Performance indicatorsSchool categoryEnrolment*P. only P + UP P+sec/hs U.P. only UP+sec Grade 2001-02 2002-03 2003-04 2004-05 2005-06% Single classroom schools47.0 52.7 26.7 66.7 23.1 I29,522 35,198 37,322 39,511% Single teacher schools59.2 8.5 0.0 0.0 0.0 II17,008 19,724 26,656 30,887% Schools with SCR > 6044.7 70.9 60.0 66.7 15.4 III12,272 14,101 17,931 26,516% Schools with pre-primary sections 9.1 14.5 26.7 0.0 15.4 IV9,419 10,086 12,954 17,669% Schools with common toilets 5.1 38.2 53.3 66.7 69.2 V7,892 7,765 9,536 13,951% Schools with girls toilets 1.5 19.4 40.0 33.3 61.5 VI3,783 4,083 4,701 5,275% Schools with drinking water facility 81.2 90.9 86.7 100.0 100.0 VII3,500 3,494 3,907 3,972% Schools with blackboard78.5 97.6 93.3 100.0 100.0 VIII 2,366 3,220 2,857 2,728% Enrolment in Govt. schools 98.7 98.7 90.9 82.8 92.6 Total Pr. 76,113 86,874 104,399 128,534% Enrolment in single-teacher schools 50.0 3.3 0.0 0.0 0.0 Total U.P9,649 10,797 11,465 11,975% No female teacher schools (tch>=2) 24.1 35.2 33.3 100.0 46.2 Transition rateGER / NER50.5% Enrolment in schools without building 15.6 1.2 1.5 0.0 0.0 Prim. to U. Prim2003-04 2004-05 2005-06%Enrolment in schools without blackboard 12.3 1.6 1.4 0.0 0.0 Primary Level GER (Primary) 81.5 95.6 135.7SC/ST EnrolmentPrimary UpperOBC EnrolmentNER (Primary) 73.3 87.7 100.0Retention rateprimaryPrimary U. PrimaryGER(U.Prim) 18.5 19.1 21.1% SC enrolment5.9 6.8 % OBCGPI0.85 NER(U.Prim) 14.8 16.2 18.620.4 33.6% SC girls to SC enrolment 45.7 39.9 EnrolmentFlow ratesEnrolment of children% ST enrolment59.2 46.7 % OBC girls toAll With disability45.7 40.7% ST girls to ST enrolment 45.6 42.1 OBC EnrolmentGrade R.R. D.O.R. P.R. Grade Girls Boys GirlsIndicatorsSchool categoryI 25.7 1.9 72.4 I 18,675 256 173P. only P + UP P+sec/hs U.P. only UP+sec II 14.5II 14,466 207 206% Girls46.0 45.4 43.8 44.3 44.7 III 12.3III 12,029 216 133Pupil-teacher ratio (PTR)74 48 52 50 17 IV 11.1IV 7,858 111 79Student-classroom ratio (SCR)162 125 109 120 33 V 9.8 39.8 50.5 V 6,138 74 60% Schools with 10028.9 9.1 6.7 0.0 0.0 VI 9.8 13.2 77.0 VII 1,684 25 18% Female teachers19.4 29.2 34.8 0.0 15.8 VII 9.0 25.4 65.7 VIII 1,224 17 10% Schools established since 199532.6 2.4 6.7 0.0 0.0 VIII 5.7 # # Total 64,285 932 704Classrooms/Other roomsClassroomsNo. of schools by type of building*School categoryTotal % good % minor % major OtherPartiallyMultiple NoPuccaKuccha Tentclassrooms condition repairs repairs roomsPuccaType BuildingPrimary only569 74.9 18.1 7.1 394 397 21 2 0 81 228Primary with upper primary330 63.1 27.7 9.2 179 137 0 0 0 19 9Primary with U.P. & sec/higher42 53.3 40.0 6.7 1612 0 0 0 1 2Upper primary only5 60.0 0.0 40.032 0 0 0 1 0Upper primary with sec./higher sec53 67.9 26.4 5.7 207 0 0 0 5 1Position of teachers by educational qualification (other than para teacher)Examination resultsSchool category BelowHigherPost(Previous academic year)M. Phil.secondarysecondarygraduateNoresponse Terminal % % Passed18 268 169 297 57 0 1 5 grade Passed with >60%V boysPrimary onlyPrimary with upper primaryPrimary with Upper primary & sec/higher11 150 105 310 86 2 0 589.1 13.610 9 12 29 12 3 0 0 V girls 91.9 11.6Upper primary only0 0 5 2 2 0 0 0 VIII boys 85.7 6.6Upper primary with sec./higher secondary2 4 3 46 35 6 0 4 VIII girls 92.6 7.0Para-teachers8 271 165 162 42 0 1 0%Teachers recvd.Gender and caste distribution of teachers*Regular teachers Para-teachers SC teachers ST teachers in-service trainingSchool categoryAvg. No. of Tchs. Total Male Female No res Male Female No res Male Female Male Female Male FemalePrimary only1.7 1247 680 130 5 320 112 0 52 9 346 152 2.4 2.1Primary with upper prim.5.3 870 504 160 5 107 94 0 31 7 111 103 0.5 1.2Prim.with U.P.&Sec/H.S5.9 89 45 30 0 13 1 0 2 10 12 11 0.0 0.0Upper Primary only4.0 12 9 0 0 3 0 0 0 0 3 0 0.0U. Primary with Sec./H.S.7.8 101 80 16 4 1 0 0 3 0 4 8 1.2 0.0Enrolment by medium of instructions% Total Primary Upper Primary % Schools recvd. Incentives : Number of beneficiaries(Previous year)Grossness 5.2 11.9(Previous academic year)School T L MCategory Hindi Bengali Urdu Others English dev. grant grantPrimary Upper primary76516Boys Girls Boys GirlsP. onlyP + UPP+sec/hsU.P. onlyUP+sec340862608598131492655068418042526421196000JHARKHAND27101480003722274390090.995.866.7100.038.589.189.753.3100.023.1IncentiveTypeText booksUniformAttendanceStationery# = not applicable na = not available * Some totals may not match due to no response in classificatory data items2833196775915348192437881016357560133250631140250


