

Jharkhand - DISE
Jharkhand - DISE
Jharkhand - DISE

You also want an ePaper? Increase the reach of your titles
YUMPU automatically turns print PDFs into web optimized ePapers that Google loves.
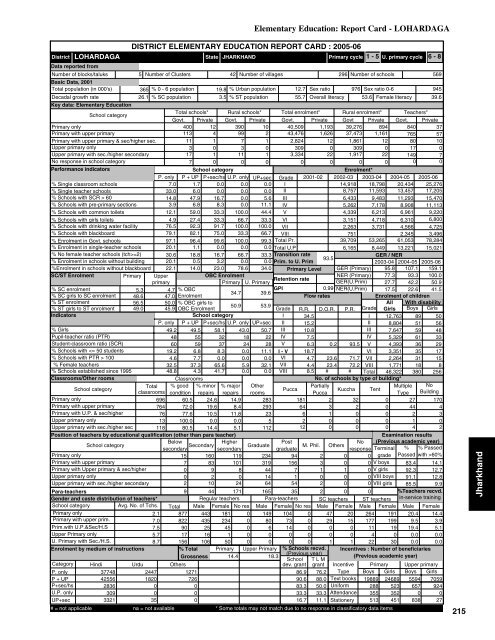
LOHARDAGADistrictData reported fromNumber of blocks/taluksBasic Data, 2001Total population (in 000's)Decadal growth rateDISTRICT ELEMENTARY EDUCATION REPORT CARD : 2005-06State5 Number of Clusters 42 Number of villages296 Number of schools569365 % 0 - 6 population 19.8 % Urban population 12.7 Sex ratio 976 Sex ratio 0-694526.1 % SC population 3.5 % ST population55.7 Overall literacy 53.6 Female literacy 39.6Primary cycle 1 - 5 U. primary cycle 6 - 8Key data: Elementary EducationSchool categoryTotal schools* Rural schools* Total enrolment* Rural enrolment* Teachers*Govt. Private Govt. Private Govt. Private Govt Private Govt. PrivatePrimary only400 12 390 10 40,509 1,193 39,276 894 840 37Primary with upper primary113 4 99 2 43,476 1,626 37,473 1,161 765 57Primary with upper primary & sec/higher sec.11 1 7 1 2,824 12 1,861 12 80 10Upper primary only3 0 3 0 309 0 309 0 17 0Upper primary with sec./higher secondary17 1 11 1 3,334 22 1,917 22 149 7No response in school category7 0 0 0 0 0 0 0 0 0Performance indicatorsSchool categoryEnrolment*P. only P + UP P+sec/hs U.P. only UP+sec Grade 2001-02 2002-03 2003-04 2004-05 2005-06% Single classroom schools7.0 1.7 0.0 0.0 0.0 I14,918 18,798 20,434 25,276% Single teacher schools33.0 6.0 0.0 0.0 0.0 II8,757 11,593 13,457 17,205% Schools with SCR > 6014.8 47.9 16.7 0.0 5.6 III6,433 9,483 11,293 15,470% Schools with pre-primary sections 3.9 6.8 8.3 0.0 11.1 IV5,262 7,178 8,908 11,113% Schools with common toilets 12.1 59.0 33.3 100.0 44.4 V4,339 6,213 6,961 9,220% Schools with girls toilets 4.9 27.4 33.3 66.7 33.3 VI3,151 4,718 6,310 6,800% Schools with drinking water facility 76.5 92.3 91.7 100.0 100.0 VII2,263 3,731 4,566 4,725% Schools with blackboard79.1 82.1 75.0 33.3 66.7 VIII 751 2,345 3,496% Enrolment in Govt. schools 97.1 96.4 99.6 100.0 99.3 Total Pr. 39,709 53,265 61,053 78,284% Enrolment in single-teacher schools 20.1 1.1 0.0 0.0 0.0 Total U.P6,165 8,449 13,221 15,021% No female teacher schools (tch>=2) 30.6 18.8 16.7 66.7 33.3 Transition rateGER / NER93.5% Enrolment in schools without building 20.1 0.5 3.2 0.0 0.0 Prim. to U. Prim2003-04 2004-05 2005-06%Enrolment in schools without blackboard 22.1 14.0 23.0 78.6 34.0 Primary Level GER (Primary) 95.8 107.1 159.1SC/ST EnrolmentPrimary UpperOBC EnrolmentNER (Primary) 77.3 93.3 100.0Retention rateprimaryPrimary U. PrimaryGER(U.Prim) 27.7 42.2 50.9% SC enrolment5.3 4.7 % OBCGPI0.99 NER(U.Prim) 17.5 22.6 41.534.7 39.6% SC girls to SC enrolment 48.6 47.0 EnrolmentFlow ratesEnrolment of children% ST enrolment56.5 50.0 % OBC girls toAll With disability50.9 53.9% ST girls to ST enrolment 49.0 45.9 OBC EnrolmentGrade R.R. D.O.R. P.R. Grade Girls Boys GirlsIndicatorsSchool categoryI 34.5I 12,763 89 50P. only P + UP P+sec/hs U.P. only UP+sec II 15.2II 8,804 51 56% Girls49.2 49.5 58.1 43.0 50.7 III 10.8III 7,647 59 48Pupil-teacher ratio (PTR)48 55 32 18 22 IV 7.5IV 5,329 61 33Student-classroom ratio (SCR)60 59 37 24 28 V 6.3 0.2 93.5 V 4,393 36 29% Schools with 1004.6 7.7 0.0 0.0 0.0 VI 4.7 23.6 71.7 VII 2,264 31 15% Female teachers32.5 37.3 65.6 5.9 32.1 VII 4.4 23.4 72.2 VIII 1,771 18 8% Schools established since 199548.8 4.3 41.7 0.0 0.0 VIII 8.5 # # Total 46,322 380 256Classrooms/Other roomsClassroomsNo. of schools by type of building*School categoryTotal % good % minor % major OtherPartiallyMultiple NoPuccaKuccha Tentclassrooms condition repairs repairs roomsPuccaType BuildingPrimary only696 60.5 24.6 14.9 283 181 2 32 0 27 170Primary with upper primary764 72.0 19.6 8.4 29364 3 2 0 44 4Primary with U.P. & sec/higher76 77.6 10.5 11.8 236 1 0 0 2 3Upper primary only13 100.0 0.0 0.052 0 0 0 1 0Upper primary with sec./higher sec 118 80.5 14.4 5.1 11212 0 0 0 4 2Position of teachers by educational qualification (other than para teacher)Examination resultsSchool category BelowHigherPost(Previous academic year)M. Phil.secondarysecondarygraduateNoresponse Terminal % % Passed15 160 119 234 94 2 0 0 grade Passed with >60%V boysPrimary onlyPrimary with upper primaryPrimary with Upper primary & sec/higher7 83 101 319 156 3 0 083.4 14.10 9 8 44 7 1 1 0 V girls 92.3 12.7Upper primary only0 2 0 14 1 0 0 0 VIII boys 91.1 12.8Upper primary with sec./higher secondary2 10 24 64 54 2 0 0 VIII girls 85.5 9.9Para-teachers9 44 171 165 35 2 0 0%Teachers recvd.Gender and caste distribution of teachers*Regular teachers Para-teachers SC teachers ST teachers in-service trainingSchool categoryAvg. No. of Tchs. Total Male Female No res Male Female No res Male Female Male Female Male FemalePrimary only2.1 877 443 181 0 149 104 0 47 20 264 191 20.4 14.4Primary with upper prim.7.0 822 435 234 0 80 73 0 29 15 177 199 9.5 3.9Prim.with U.P.&Sec/H.S7.5 90 25 45 0 6 14 0 0 0 11 19 19.4 5.1Upper Primary only5.7 17 16 1 0 0 0 0 0 0 4 0 0.0 0.0U. Primary with Sec./H.S.8.7 156 106 50 0 0 0 0 1 1 22 30 0.0 0.0Enrolment by medium of instructions% Total Primary Upper Primary % Schools recvd. Incentives : Number of beneficiaries(Previous year)Grossness 14.4 18.3(Previous academic year)School T L MCategory Hindi Urdu Othersdev. grant grantPrimary Upper primary37748Boys Girls Boys GirlsP. onlyP + UPP+sec/hsU.P. onlyUP+sec42556283630933212447182000351271726000JHARKHANDElementary Education: Report Card - LOHARDAGA86.990.683.333.316.776.288.050.033.311.1IncentiveTypeText booksUniformAttendanceStationery# = not applicable na = not available * Some totals may not match due to no response in classificatory data items1988928835551324689523352451559465708387059924027215<strong>Jharkhand</strong>


