Contract Region 11: Caringbah - Cronulla - Kurnell - Miranda
Contract Region 11: Caringbah - Cronulla - Kurnell - Miranda
Contract Region 11: Caringbah - Cronulla - Kurnell - Miranda

Create successful ePaper yourself
Turn your PDF publications into a flip-book with our unique Google optimized e-Paper software.
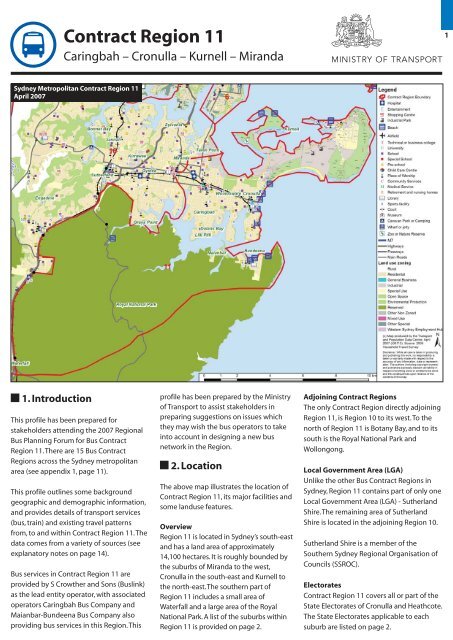
8. Journey to WorkSection 8 presents an analysis of the Journey to Work datacollected as part of the 2001 Census. The analysis presentedincludes the travel patterns of the workers living in <strong>Contract</strong><strong>Region</strong> <strong>11</strong>, as well as the travel patterns of people employed in<strong>Contract</strong> <strong>Region</strong> <strong>11</strong>. There is also some discussion of work travelpatterns for people both living and working in <strong>Region</strong> <strong>11</strong>.Destination of work trips for residents of <strong>Region</strong> <strong>11</strong>For the 31,700 workers living in <strong>Region</strong> <strong>11</strong>, 25% also worked in<strong>Region</strong> <strong>11</strong>, and 19% worked in the adjoining <strong>Region</strong> of 10. TheSydney CBD employed 8% of all workers living in <strong>Region</strong> <strong>11</strong>.The number of workers living in <strong>Region</strong> <strong>11</strong> employed in other<strong>Contract</strong> <strong>Region</strong>s noticeably decreases with distance, as shownin the following table.Workplace Destination forEmployees living in<strong>Contract</strong> <strong>Region</strong> <strong>11</strong>No. of workers% of workersWithin <strong>Region</strong> <strong>11</strong> 8,000 25.2% To <strong>Region</strong> 10 5,900 18.8% To <strong>Region</strong> 9 5,100 16.0% To <strong>Region</strong> 6 3,200 10.2% To Sydney CBD 2,600 8.1% To <strong>Region</strong> 5 1,000 3.1% To <strong>Region</strong> 13 900 2.8% To <strong>Region</strong> 7 700 2.3% To <strong>Region</strong> 8 400 1.2% To <strong>Region</strong> 3 300 0.9% To <strong>Region</strong> 4 200 0.7% To <strong>Region</strong> 1 100 0.4% To <strong>Region</strong> 2 100 0.4% To <strong>Region</strong> 15 100 0.2% To <strong>Region</strong> 12
10No. ofHouseholdVehiclesNoneOneTwo or moreNot statedTotalTrain54.5%22.4%9.8%17.7%15.3%Bus2.6%0.8%0.3%0.4%0.6%JTW Mode UsedCar Car Otherdriver passenger10.2%58.2%77.9%58.3%69.2%8.7%8.0%4.8%4.4%5.9%23.9%10.6%7.1%19.1%9.1%Total100.0%100.0%100.0%100.0%100.0%Travelling to work in <strong>Region</strong> <strong>11</strong>The travel patterns for all workers employed in <strong>Contract</strong> <strong>Region</strong><strong>11</strong>, compared to people both living and working in <strong>Region</strong> <strong>11</strong>,are presented in the following graph.% of EmployeesMode used by employees of <strong>Contract</strong> <strong>Region</strong> <strong>11</strong>for travelling to work Census Day 200180%70%60%50%40%30%20%10%0%All <strong>Contract</strong> <strong>Region</strong> <strong>11</strong> Employees Employees living & working in <strong>Contract</strong> <strong>Region</strong> <strong>11</strong>Train Bus Car driver Car passenger Other/unknownModeSource: JTW Table19.On Census Day 2001 75% of all people employed in <strong>Region</strong> <strong>11</strong>(includes residents and non-residents) travelled to work as a cardriver. For people both living and working in <strong>Region</strong> <strong>11</strong>, 68%drove themselves to work.Mode use for work trips to all <strong>Region</strong>s is shown in the followinggraph – it is ordered by the share of public transport trips .100%90%80%70%60%50%40%30%20%10%0%Journey to Work Mode Shareby Destination <strong>Contract</strong> <strong>Region</strong> 20012001Public Transport Car Other9 8 6 7 4 12 14 5 10 13 <strong>11</strong> 3 1 2 15Destination <strong>Contract</strong> <strong>Region</strong>Source: JTW Table19.Public transport use tended to be highest in the inner <strong>Contract</strong><strong>Region</strong>s, and lowest in the outer <strong>Region</strong>s. <strong>Region</strong> <strong>11</strong> is rankedeleventh of the 15 <strong>Region</strong>s in the use of public transport forcommuting to work.Employment industry & mode used to travel to work in <strong>Region</strong> <strong>11</strong>Public transport use is higher for people employed in office andcentre-related employment industries. Car use is higher forworkers employed in manufacturing. These patterns of modeshare reflect that retail and office type employment tends to belocated in centres which are better serviced by public transportthan more dispersed locations where manufacturingemployment tends to be located. The following table presentsmode share by industry of employment in <strong>Region</strong> <strong>11</strong>.EmploymentIndustries in CR<strong>11</strong>TrainBusCar Car Otherdriver passengerTotalManufacturing 4.1% 1.6% 80.0% 7.5% 6.8% 100.0%Retail Trade 8.1% 1.5% 66.6% 12.1% <strong>11</strong>.7% 100.0%Health & 4.5% 1.3% 80.1% 5.8% 8.3% 100.0%Community ServicesProperty & 5.0% 0.6% 81.9% 4.8% 7.7% 100.0%Business ServicesConstruction 3.4% 0.3% 72.5% 7.4% 16.4% 100.0%Education 2.5% 0.9% 85.2% 6.0% 5.5% 100.0%Accomm, Cafes, 8.9% 1.7% 57.3% 10.9% 21.2% 100.0%RestaurantsWholesale Trade 3.6% 1.9% 80.4% 6.0% 8.1% 100.0%Personal & Other 4.6% 1.7% 70.8% 9.5% 13.5% 100.0%ServicesTransport & Storage 7.1% 0.3% 67.2% 5.4% 20.1% 100.0%Finance & Insurance 6.1% 0.3% 81.6% 4.7% 7.3% 100.0%Cultural & 8.0% 1.7% 75.1% 5.3% 10.0% 100.0%Recreational ServicesGovernment 7.1% 1.2% 77.6% 5.9% 8.2% 100.0%Admin, DefenceCommunication 8.6% 1.0% 66.7% 2.9% 21.0% 100.0%ServicesOther 4.3% 2.2% 66.8% 13.4% 13.4% 100.0%Total 5.3% 1.2% 75.3% 7.8% 10.3% 100.0%9.Trips by Community TransportThe Ministry of Transport estimates that 10,000 CommunityTransport trips originated in <strong>Contract</strong> <strong>Region</strong> <strong>11</strong> in 2004. Most ofthese trips were provided by a bus (35%) or car (49%) belonging tothe Community Transport organisations operating in the <strong>Region</strong>.The main purposes for community transport trips were medicalappointments/visits (42%), followed by shopping trips (21%).Annual Trips originating in each <strong>Contract</strong> <strong>Region</strong> 2004<strong>Contract</strong><strong>Region</strong>No. Community TransportTrips Originating in<strong>Contract</strong> <strong>Region</strong>(annual trips 2004)*% Community TransportTrips Originating in<strong>Contract</strong> <strong>Region</strong>(annual trips 2004)*1 22,900 10.0%2 6,900 3.0%3 8,600 3.8%4 12,800 5.6%5 19,700 8.6%6 23,300 10.2%7 26,000 <strong>11</strong>.4%8 13,300 5.8%9 23,200 10.1%10 22,800 10.0%<strong>11</strong> 10,000 4.4%12 7,800 3.4%131415,4008,5006.7%3.7%15 7,300 3.2%Total 228,400 100.0%* Multiply by 2 to calculate the total number of one-way tripsincluding originating trips and return journeys.Source: Ministry of Transport 2005Purpose of Com m unity Transport TripOriginating in <strong>Contract</strong> <strong>Region</strong> <strong>11</strong>Social7%Day CareOther 9% * Medical includes GPs, Specialists,21% Hospital & Medical Appointments/VisitsShopping 21% Medical*42%
Appendix 1: Bus <strong>Contract</strong> <strong>Region</strong>s in Sydney<strong>11</strong>
12CentreAppendix 2: Major Shopping Centres in <strong>Contract</strong> <strong>Region</strong> <strong>11</strong><strong>Caringbah</strong>Marketplace<strong>Caringbah</strong>ShoppingVillage<strong>Cronulla</strong> Centre<strong>Cronulla</strong> PlazaWestfield<strong>Miranda</strong>FranklinsMajorTenantsWoolworthsFranklinsMyer, DJs,Target, BigW, Woolworths,Lincraft, Franklins,ToysR Us, Rebel Sport, Aldi,TBC, Best & Less4,4290066,59518<strong>11</strong>0343Major No ofTenantsm 2 Specialties1,170 15Specialtiesm 21,1971,2831,147035,774TotalRetailm 22,3675,7121,1470102,369OtherTenantsPaddies Bar &RestaurantGreater Union,Storerooms,Car WashOtherTenantsm 20020007,018OfficeTenantsm 200002,383TotalCentrem 22,3675,7121,3470<strong>11</strong>1,770OpenCarBays7012505624,500EnclosedCarBays0Parkside Plaza, Coles 3,<strong>11</strong>3 13 1,493 4,606 0 0 4,606 183 16 199 <strong>Miranda</strong>13002650TotalCar7025508274,500Pedestrianpa2,200,00013,100,000Source: Property Council of Australia – NSW/ACT Shopping Centre Directory (2005)
Appendix 3: Schools in <strong>Contract</strong> <strong>Region</strong> <strong>11</strong>Government SchoolsSchool Suburb Type EnrolmentsNon-Government SchoolsSchool Suburb Type EnrolmentsBundeena Public School Bundeena P 183 De La Salle College <strong>Caringbah</strong> <strong>Caringbah</strong> H 330Burraneer Bay Public School <strong>Cronulla</strong> P 628 De La Salle College <strong>Cronulla</strong> <strong>Cronulla</strong> H 350<strong>Caringbah</strong> High School <strong>Caringbah</strong> H 901 Our Lady of Fatima School <strong>Caringbah</strong> P n/a<strong>Caringbah</strong> North Public School <strong>Caringbah</strong> P 464 Our Lady of Mercy College Burraneer <strong>Cronulla</strong> H 435<strong>Caringbah</strong> Public School <strong>Caringbah</strong> P 233 St Aloysius Primary School <strong>Cronulla</strong> P n/a<strong>Cronulla</strong> High School <strong>Cronulla</strong> H 657 St Francis De Sales' Primary School Woolooware P 180<strong>Cronulla</strong> Public School <strong>Cronulla</strong> P <strong>11</strong>8<strong>Cronulla</strong> South Public School <strong>Cronulla</strong> P 279Sources School names -Endeavour Sports High School <strong>Caringbah</strong> H 909www2.boardofstudies.nsw.edu.au/links_schools/state_list.cfm?state=NSW<strong>Kurnell</strong> Public School <strong>Kurnell</strong> P 174(Accessed May 2006) & Enrolment information – www.isd.com.au (Accessed MayLaguna Street Public School <strong>Caringbah</strong> P 4032006) & "Your complete guide to secondary schooling in NSW"Lilli Pilli Public School Lilli Pilli P 443<strong>Miranda</strong> North Public School <strong>Miranda</strong> P 240KeyWaterfall Public School Waterfall P 36H - High School P - Primary n/a - Not availableWoolooware High School Woolooware H <strong>11</strong>08Woolooware Public School <strong>Cronulla</strong> P 341Source - NSW Department of Education & Training Directory 2006 (CD-Rom)13Notes:
14Appendix 4: Aged Care Facilities – Low Care Accommodation in <strong>Contract</strong> <strong>Region</strong> 15Name Suburb Residential lowcare places*Juliana VillageStella Maris Hostel* as at 30/06/05MIRANDACRONULLA4128Source: www.health.gov.au/internet/wcms/publishing.nsf/Content/DADD1CBAB872C833CA256FEF001F4E89/$File/nsw.xls (accessed May 2006)Information & CoverageThe area covered by this <strong>Contract</strong> <strong>Region</strong>, while following geographical features and some local government boundaries, is largely foradministrative purposes and is likely to cut across travel patterns and through some communities.Population, employment and travel information is coded to units (travel zones), some of which straddle the <strong>Contract</strong> <strong>Region</strong>’sboundaries. Other information might be coded to even larger units such as local government areas, which cut across boundaries.Therewill be some residents and employees of adjoining <strong>Contract</strong> <strong>Region</strong>s that will be affected by decisions relating to <strong>Contract</strong> <strong>Region</strong> <strong>11</strong>,because they live or work or go to school close to, but outside, the boundary.Information has been obtained from different sources, which are not necessarily completely consistent, but it provides usefulbackground information to generally assist the bus service planning process. However, care must be taken in the use of theinformation and readers are referred to the source of particular information of interest for further explanation of collection methodsand other possible limitations.Sources of InformationThe main sources of data in this publication are:• Australian Bureau of Statistics – 2001 Census of Population & Housing (Provided by Transport & Population Data Centre - NSWDepartment of Planning): population and demographic data• CityRail – A Compendium of CityRail Travel Statistics (April 2006):Train Station Passenger Counts• Federal Department of Health website: Aged Care data• NSW Department of Education & Training 2006 Directory (CD-Rom) – Government Schools data• NSW Board of Studies – Non Government Schools data• Property Council of Australia – NSW/ACT Shopping Centre Directory 2005• NSW Department of Planning – City of Cities: A plan for Sydney’s future (Dec 2005) – Centres• Transport & Population Data Centre (NSW Department of Planning) – Household Travel Survey, Journey to Work data, Facilities data,Geographic dataDisclaimerWhile all care is taken in producing and publishing this work, no responsibility is taken or warranty made with respect to accuracy ofany information, data or representation.The Ministry of Transport expressly disclaim all liability of anything done or omitted to bedone and the consequences upon the reliance of the contents of this information.Notes:
Notes:
Notes: