Chapter D Finite State Machines
Chapter D Finite State Machines
Chapter D Finite State Machines
- No tags were found...

Create successful ePaper yourself
Turn your PDF publications into a flip-book with our unique Google optimized e-Paper software.
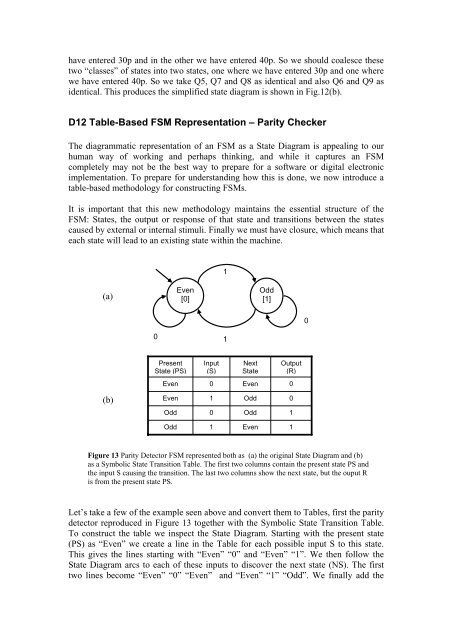
have entered 30p and in the other we have entered 40p. So we should coalesce thesetwo “classes” of states into two states, one where we have entered 30p and one wherewe have entered 40p. So we take Q5, Q7 and Q8 as identical and also Q6 and Q9 asidentical. This produces the simplified state diagram is shown in Fig.12(b).D12 Table-Based FSM Representation – Parity CheckerThe diagrammatic representation of an FSM as a <strong>State</strong> Diagram is appealing to ourhuman way of working and perhaps thinking, and while it captures an FSMcompletely may not be the best way to prepare for a software or digital electronicimplementation. To prepare for understanding how this is done, we now introduce atable-based methodology for constructing FSMs.It is important that this new methodology maintains the essential structure of theFSM: <strong>State</strong>s, the output or response of that state and transitions between the statescaused by external or internal stimuli. Finally we must have closure, which means thateach state will lead to an existing state within the machine.1(a)Even[0]Odd[1]001Present<strong>State</strong> (PS)Input(S)Next<strong>State</strong>Output(R)Even0Even0(b)Even1Odd0Odd0Odd1Odd1Even1Figure 13 Parity Detector FSM represente d both as (a) the original <strong>State</strong> Diagram and (b)as a Symbolic <strong>State</strong> Transition Table. The first two columns contain the present state PS andthe input S causing the transition. The last two columns show the next state, but the ouput Ris from the present state PS.Let’s take a few of the example seen above and convert them to Tables, first the paritydetector reproduced in Figure 13 together with the Symbolic <strong>State</strong> Transition Table.To construct the table we inspect the <strong>State</strong> Diagram. Starting with the present state(PS) as “Even” we create a line in the Table for each possible input S to this state.This gives the lines starting with “Even” “0” and “Even” “1”. We then follow the<strong>State</strong> Diagram arcs to each of these inputs to discover the next state (NS). The firsttwo lines become “Even” “0” “Even” and “Even” “1” “Odd”. We finally add the