Print Fluent Newsletter
Print Fluent Newsletter
Print Fluent Newsletter

Create successful ePaper yourself
Turn your PDF publications into a flip-book with our unique Google optimized e-Paper software.
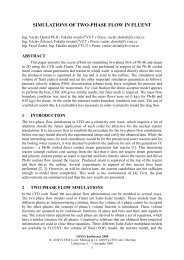
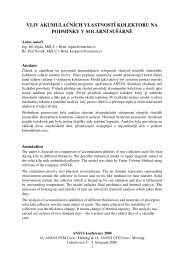
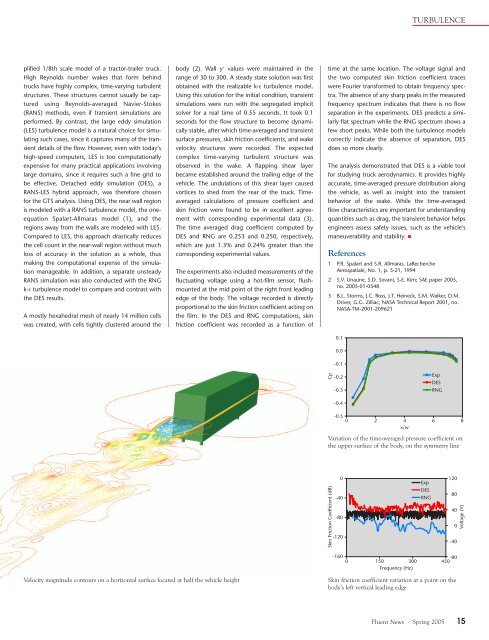
TURBULENCEplified 1/8th scale model of a tractor-trailer truck.High Reynolds number wakes that form behindtrucks have highly complex, time-varying turbulentstructures. These structures cannot usually be capturedusing Reynolds-averaged Navier-Stokes(RANS) methods, even if transient simulations areperformed. By contrast, the large eddy simulation(LES) turbulence model is a natural choice for simulatingsuch cases, since it captures many of the transientdetails of the flow. However, even with today’shigh-speed computers, LES is too computationallyexpensive for many practical applications involvinglarge domains, since it requires such a fine grid tobe effective. Detached eddy simulation (DES), aRANS-LES hybrid approach, was therefore chosenfor the GTS analysis. Using DES, the near wall regionis modeled with a RANS turbulence model, the oneequationSpalart-Allmaras model (1), and theregions away from the walls are modeled with LES.Compared to LES, this approach drastically reducesthe cell count in the near-wall region without muchloss of accuracy in the solution as a whole, thusmaking the computational expense of the simulationmanageable. In addition, a separate unsteadyRANS simulation was also conducted with the RNGk-ε turbulence model to compare and contrast withthe DES results.A mostly hexahedral mesh of nearly 14 million cellswas created, with cells tightly clustered around thebody (2). Wall y + values were maintained in therange of 30 to 300. A steady state solution was firstobtained with the realizable k-ε turbulence model.Using this solution for the initial condition, transientsimulations were run with the segregated implicitsolver for a real time of 0.55 seconds. It took 0.1seconds for the flow structure to become dynamicallystable, after which time-averaged and transientsurface pressures, skin friction coefficients, and wakevelocity structures were recorded. The expectedcomplex time-varying turbulent structure wasobserved in the wake. A flapping shear layerbecame established around the trailing edge of thevehicle. The undulations of this shear layer causedvortices to shed from the rear of the truck. Timeaveragedcalculations of pressure coefficient andskin friction were found to be in excellent agreementwith corresponding experimental data (3).The time averaged drag coefficient computed byDES and RNG are 0.253 and 0.250, respectively,which are just 1.3% and 0.24% greater than thecorresponding experimental values.The experiments also included measurements of thefluctuating voltage using a hot-film sensor, flushmountedat the mid point of the right front leadingedge of the body. The voltage recorded is directlyproportional to the skin friction coefficient acting onthe film. In the DES and RNG computations, skinfriction coefficient was recorded as a function oftime at the same location. The voltage signal andthe two computed skin friction coefficient traceswere Fourier transformed to obtain frequency spectra.The absence of any sharp peaks in the measuredfrequency spectrum indicates that there is no flowseparation in the experiments. DES predicts a similarlyflat spectrum while the RNG spectrum shows afew short peaks. While both the turbulence modelscorrectly indicate the absence of separation, DESdoes so more clearly.The analysis demonstrated that DES is a viable toolfor studying truck aerodynamics. It provides highlyaccurate, time-averaged pressure distribution alongthe vehicle, as well as insight into the transientbehavior of the wake. While the time-averagedflow characteristics are important for understandingquantities such as drag, the transient behavior helpsengineers assess safety issues, such as the vehicle’smaneuverability and stability. References1 P.R. Spalart and S.R. Allmaras, LaRechercheAerospatiale, No. 1, p. 5-21, 19942 S.V. Unaune, S.D. Sovani, S-E. Kim; SAE paper 2005,no. 2005-01-05483 B.L. Storms, J.C. Ross, J.T. Heineck, S.M. Walker, D.M.Driver, G.G. Zilliac; NASA Technical Report 2001, no.NASA-TM-2001-2096210.10.0-0.1Cp-0.2-0.3ExpDESRNG-0.4-0.50 24x/w6 8Variation of the time-averaged pressure coefficient onthe upper surface of the body, on the symmetry lineSkin Friction Coefficient (dB)0-40-80-120ExpDESRNG12080400-40Voltage (V)-1600 150300Frequency (Hz)-80450Velocity magnitude contours on a horizontal surface located at half the vehicle heightSkin friction coefficient variation at a point on thebody’s left vertical leading edge<strong>Fluent</strong> News · Spring 2005 15