Print Fluent Newsletter
Print Fluent Newsletter
Print Fluent Newsletter

Create successful ePaper yourself
Turn your PDF publications into a flip-book with our unique Google optimized e-Paper software.
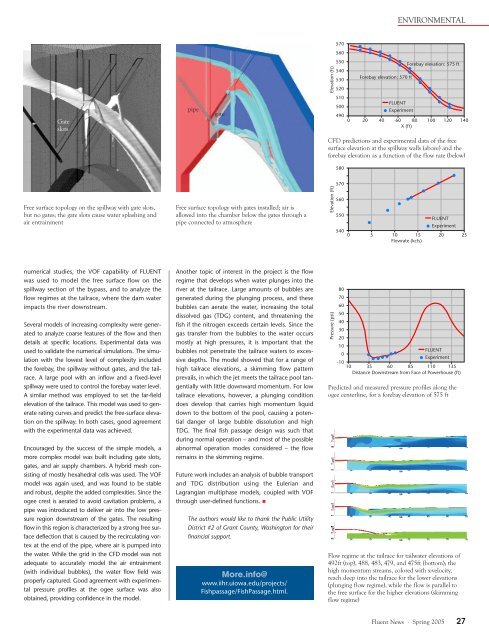
ENVIRONMENTALElevation (ft)Gateslotspipegate570560550Forebay elevation: 575 ft540Forebay elevation: 570 ft530520510FLUENT500Experiment4900 20 40 60 80 100 120 140X (ft)CFD predictions and experimental data of the freesurface elevation at the spillway walls (above) and theforebay elevation as a function of the flow rate (below)580Free surface topology on the spillway with gate slots,but no gates; the gate slots cause water splashing andair entrainmentFree surface topology with gates installed; air isallowed into the chamber below the gates through apipe connected to atmosphereElevation (ft)570560550540FLUENTExperiment0 5 10 15 20 25Flowrate (kcfs)numerical studies, the VOF capability of FLUENTwas used to model the free surface flow on thespillway section of the bypass, and to analyze theflow regimes at the tailrace, where the dam waterimpacts the river downstream.Several models of increasing complexity were generatedto analyze coarse features of the flow and thendetails at specific locations. Experimental data wasused to validate the numerical simulations. The simulationwith the lowest level of complexity includedthe forebay, the spillway without gates, and the tailrace.A large pool with an inflow and a fixed-levelspillway were used to control the forebay water level.A similar method was employed to set the far-fieldelevation of the tailrace. This model was used to generaterating curves and predict the free-surface elevationon the spillway. In both cases, good agreementwith the experimental data was achieved.Encouraged by the success of the simple models, amore complex model was built including gate slots,gates, and air supply chambers. A hybrid mesh consistingof mostly hexahedral cells was used. The VOFmodel was again used, and was found to be stableand robust, despite the added complexities. Since theogee crest is aerated to avoid cavitation problems, apipe was introduced to deliver air into the low pressureregion downstream of the gates. The resultingflow in this region is characterized by a strong free surfacedeflection that is caused by the recirculating vortexat the end of the pipe, where air is pumped intothe water. While the grid in the CFD model was notadequate to accurately model the air entrainment(with individual bubbles), the water flow field wasproperly captured. Good agreement with experimentalpressure profiles at the ogee surface was alsoobtained, providing confidence in the model.Another topic of interest in the project is the flowregime that develops when water plunges into theriver at the tailrace. Large amounts of bubbles aregenerated during the plunging process, and thesebubbles can aerate the water, increasing the totaldissolved gas (TDG) content, and threatening thefish if the nitrogen exceeds certain levels. Since thegas transfer from the bubbles to the water occursmostly at high pressures, it is important that thebubbles not penetrate the tailrace waters to excessivedepths. The model showed that for a range ofhigh tailrace elevations, a skimming flow patternprevails, in which the jet meets the tailrace pool tangentiallywith little downward momentum. For lowtailrace elevations, however, a plunging conditiondoes develop that carries high momentum liquiddown to the bottom of the pool, causing a potentialdanger of large bubble dissolution and highTDG. The final fish passage design was such thatduring normal operation – and most of the possibleabnormal operation modes considered – the flowremains in the skimming regime.Future work includes an analysis of bubble transportand TDG distribution using the Eulerian andLagrangian multiphase models, coupled with VOFthrough user-defined functions. The authors would like to thank the Public UtilityDistrict #2 of Grant County, Washington for theirfinancial support.More.info@www.iihr.uiowa.edu/projects/Fishpassage/FishPassage.html.Pressure (psi)8070605040302010FLUENT0Experiment-1010 35 60 85 110 135Distance Downstream from Face of Powerhouse (ft)Predicted and measured pressure profiles along theogee centerline, for a forebay elevation of 575 ftFlow regime at the tailrace for tailwater elevations of492ft (top), 488, 483, 479, and 475ft (bottom); thehigh momentum streams, colored with x-velocity,reach deep into the tailrace for the lower elevations(plunging flow regime), while the flow is parallel tothe free surface for the higher elevations (skimmingflow regime)<strong>Fluent</strong> News · Spring 2005 27