Mud Creek Watershed Restoration Plan - Henderson County Center
Mud Creek Watershed Restoration Plan - Henderson County Center
Mud Creek Watershed Restoration Plan - Henderson County Center

You also want an ePaper? Increase the reach of your titles
YUMPU automatically turns print PDFs into web optimized ePapers that Google loves.
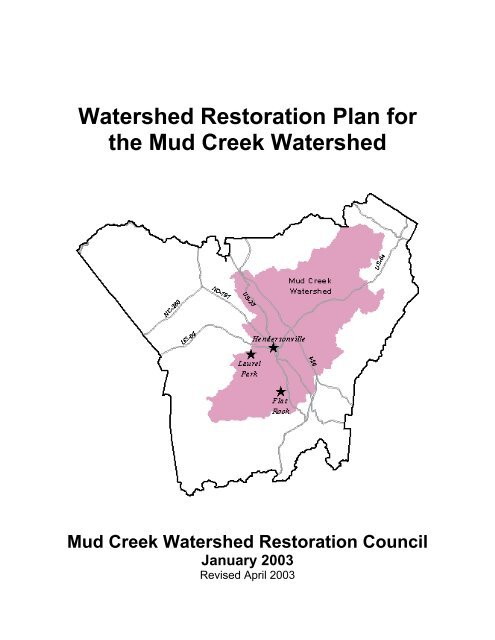
<strong>Watershed</strong> <strong>Restoration</strong> <strong>Plan</strong> forthe <strong>Mud</strong> <strong>Creek</strong> <strong>Watershed</strong><strong>Mud</strong> <strong>Creek</strong> <strong>Watershed</strong> <strong>Restoration</strong> CouncilJanuary 2003Revised April 2003
TABLE OF CONTENTSTable of Contents ........................................................................................................................... iList of Tables ................................................................................................................................. iiList of Figures................................................................................................................................ iiExecutive Summary..................................................................................................................... ivSection 1: Project Overview........................................................................................................ 11.1 Introduction......................................................................................................................... 11.2 The <strong>Mud</strong> <strong>Creek</strong> <strong>Watershed</strong> <strong>Restoration</strong> Council................................................................ 21.3 NC Division of Water Quality <strong>Watershed</strong> Assessment and <strong>Restoration</strong> Project................ 21.4 NC Wetlands <strong>Restoration</strong> Program Local <strong>Watershed</strong> <strong>Plan</strong>ning ......................................... 31.5 Tennessee Valley Authority Integrated Pollutant Source Identification ............................ 3Section 2: <strong>Mud</strong> <strong>Creek</strong> <strong>Watershed</strong> Characterization ................................................................ 42.1 Introduction......................................................................................................................... 42.2 Hydrology and Sub-<strong>Watershed</strong> Delineation ....................................................................... 42.3 Soils..................................................................................................................................... 62.4 Land Use/Land Cover in the <strong>Mud</strong> <strong>Creek</strong> <strong>Watershed</strong>.......................................................... 62.5 Water Quality and Stream Health....................................................................................... 92.5.1 General Conclusions of WARP Assessment.................................................................... 92.5.2 DWQ Use Support Ratings ........................................................................................... 102.5.3 DWQ’s <strong>Watershed</strong> Assessment and <strong>Restoration</strong> Project (WARP) ............................... 122.5.4 Volunteer Water Information Network ......................................................................... 152.5.5 Channel and Riparian Buffer Condition....................................................................... 162.6 Local Water Quality Initiatives......................................................................................... 192.6.1 Local Environmental Ordinances................................................................................. 192.6.2 Land Use <strong>Plan</strong>ning and Zoning .................................................................................... 202.6.3 State Stormwater Regulations....................................................................................... 212.6.4 Environmental and Conservation Organization (ECO) ............................................... 212.6.5 Volunteer Water Information Network ......................................................................... 222.6.6 Southside Development Initiative ................................................................................. 222.6.7 Apple Country Greenwy Commission........................................................................... 232.6.8 Carolina Mountain Land Conservancy ........................................................................ 232.6.9 French Broad <strong>Watershed</strong> Training <strong>Center</strong>................................................................... 24Section 3: Recommendations .................................................................................................... 253.1 Stormwater........................................................................................................................ 263.1.1 Overview ....................................................................................................................... 263.1.2 Strategies to minimize impacts of stormwater runoff from future development ........... 303.1.3 Strategies to reduce impacts of stormwater runoff from existing development............ 323.2 Agricultural Non Point Source Pollution.......................................................................... 353.2.1 Overview ....................................................................................................................... 35Table of ContentsPage i
3.2.2 Strategies to Control Agricultural Nonpoint Source Pollution .................................... 373.3 Habitat Degradation.......................................................................................................... 403.3.1 Overview ....................................................................................................................... 403.3.2 Strategies to Address Habitat Degradation.................................................................. 413.4 Upland Sources of Sedimentation..................................................................................... 443.4.1 Overview ....................................................................................................................... 443.4.2 Strategies to Address Upland Sources of Sedimentation.............................................. 46Section 4: Next Steps.................................................................................................................. 494.1 Present <strong>Watershed</strong> <strong>Restoration</strong> <strong>Plan</strong> to the Community................................................... 494.2 Formalize <strong>Watershed</strong> Council........................................................................................... 494.3 Hire <strong>Watershed</strong> Coordinator............................................................................................. 494.4 Prioritize Recommendations............................................................................................. 494.5 Set Measurable <strong>Watershed</strong> Improvement Goals............................................................... 494.6 Secure Grants to Implement Projects................................................................................ 50References.................................................................................................................................... 51Appendix A.................................................................................................................................. 52Appendix B .................................................................................................................................. 53LIST OF TABLESTable 2.1: Summary of area, stream miles and slope by subwatershed. ....................................... 5Table 2.2. Percentage of subwatershed area by land use/cover..................................................... 7Table 2.3: Channelization and Buffers in the <strong>Mud</strong> <strong>Creek</strong> watershed.......................................... 18Table 2.4: Summary of Zoning in the <strong>Mud</strong> <strong>Creek</strong> watershed...................................................... 21Table 3.1: Existing Stormwater Management Ordinances in the <strong>Mud</strong> <strong>Creek</strong> watershed............ 29Table 3.2: Estimated sediment loading rates in tons/acre for land uses in the <strong>Mud</strong> <strong>Creek</strong>watershed. ................................................................................................................... 45LIST OF FIGURESFigure 1.1: Map of the <strong>Mud</strong> <strong>Creek</strong> <strong>Watershed</strong>. ............................................................................ 1Figure 2.1: Streams in the <strong>Mud</strong> <strong>Creek</strong> <strong>Watershed</strong>........................................................................ 4Figure 2.2: Subwatersheds in the <strong>Mud</strong> <strong>Creek</strong> <strong>Watershed</strong>............................................................. 5Figure 2.3: Generalized Land Use/Land Cover Patterns in the <strong>Mud</strong> <strong>Creek</strong> <strong>Watershed</strong>............... 8Figure 2.4: Use Classifications for streams in the <strong>Mud</strong> <strong>Creek</strong> <strong>Watershed</strong> ................................. 10Figure 2.5: Use-support Ratings for streams in the <strong>Mud</strong> <strong>Creek</strong> <strong>Watershed</strong> ............................... 11Figure 2.6: WARP Biological Monitoring Sites......................................................................... 12Figure 2.7: Apple orchards and benthic macroinvertebrate communities inthe Clear <strong>Creek</strong> and Devils Fork Subwatersheds..................................................... 13Figure 2.8: Location of WARP water chemistry sampling sites. ............................................... 14Table of ContentsPage ii
Figure 2.9: VWIN monitoring sites in the <strong>Mud</strong> <strong>Creek</strong> <strong>Watershed</strong>............................................. 15Figure 2.10: Map of <strong>Henderson</strong>ville showing <strong>Mud</strong> <strong>Creek</strong> prior to channelization...................... 17Figure 3.1: Stream vulnerability rating based on percent impervious cover in the<strong>Mud</strong> <strong>Creek</strong> <strong>Watershed</strong> – by subwatershed................................................................ 27Figure 3.2: Existing wetlands and areas with hydric soils in the <strong>Mud</strong> <strong>Creek</strong> <strong>Watershed</strong>........... 28Figure 3.3: Flooding at <strong>Henderson</strong>ville’s Southside, just one of many areas of chronic floodingexacerbated by floodplain development and impervious cover............................... 29Figure 3.4: Agricultural land uses in the <strong>Mud</strong> <strong>Creek</strong> <strong>Watershed</strong>. .............................................. 35Figure 3.5: Cattle with direct access to <strong>Mud</strong> <strong>Creek</strong>.................................................................... 36Figure 3.6: Cattle access points to streams in the <strong>Mud</strong> <strong>Creek</strong> <strong>Watershed</strong>.................................. 36Figure 3.7: Eroding streambanks cause sediment to fill stream channels impacting aquatichabitat....................................................................................................................... 40Figure 3.8: Site of Clear <strong>Creek</strong> stream restoration project ......................................................... 42Figure 3.9: Runoff from gravel driveway in the upper <strong>Mud</strong> <strong>Creek</strong> watershed........................... 44Figure 3.10: Estimated annual sediment load from land uses in the <strong>Mud</strong> <strong>Creek</strong> watershed ....... 45Figure 3.11: Number of building permits issued for new residential units in <strong>Henderson</strong> <strong>County</strong>1996-2002 ................................................................................................................ 46Table of ContentsPage iii
EXECUTIVE SUMMARYFor the past three years, local stakeholders and state and federal resource managers have workedtogether to gather data and outline a plan to restore the <strong>Mud</strong> <strong>Creek</strong> watershed. This documentrepresents the culmination of efforts undertaken by these partners to evaluate all possible sourcesand causes of water quality degradation and recommend a comprehensive set of strategies foraddressing these problems.Section 1 presents a brief overview of the project. In 2000, Land of Sky Regional Council ofGovernments convened local stakeholders in the <strong>Mud</strong> <strong>Creek</strong> watershed to develop a plan foraddressing water quality problems in the watershed. At that same time, the Division of WaterQuality initiated an independent study to identify causes and sources of impairment in the <strong>Mud</strong><strong>Creek</strong> and two of its tributaries, Bat Fork and Clear <strong>Creek</strong>. These streams are on the NorthCarolina 303(d) List of Impaired Waterbodies. Concurrently, the NC Wetlands <strong>Restoration</strong>Program was interested in identifying potential stream and wetland restoration projects in the<strong>Mud</strong> <strong>Creek</strong> watershed and agreed to collect additional stream and watershed data through apartnership with the Tennessee Valley Authority to supplement efforts already underway in thewatershed.Section 2 summarizes current conditions in the <strong>Mud</strong> <strong>Creek</strong> watershed including land use,water quality, channel and buffer conditions, habitat and wetlands. The <strong>Mud</strong> <strong>Creek</strong> watershedis 113 mi 2 comprising approximately one-third of <strong>Henderson</strong> <strong>County</strong>’s land area. There arethree municipalities in the watershed: <strong>Henderson</strong>ville, Flat Rock and Laurel Park. Forty-fivepercent of the <strong>Mud</strong> <strong>Creek</strong> watershed is forested, 25 percent is residential, commercial orindustrial, and 23 percent is agricultural. The <strong>Mud</strong> <strong>Creek</strong> watershed has roughly 10%impervious cover, however, the percent of imperviousness varies greatly throughout thewatershed with some areas far exceeding the 10% threshold where declines in water quality andaquatic communities are noted. Without appropriate water quality protection measures,increasing urbanization in the watershed will further exacerbate existing water quality problems.The Volunteer Water Information Network rates many streams in the <strong>Mud</strong> <strong>Creek</strong> watershed asbelow average and poor due to nutrient enrichment, turbidity and high metals concentrations. Acomprehensive watershed assessment conducted by the NC Division of Water Quality (DWQ) in2000-2002 indicates that biological communities in the <strong>Mud</strong> <strong>Creek</strong> watershed are impacted by anumber of factors including toxicants from agriculture and urban sources, scour from highstormflow volumes, poor in-stream habitat, and a lack of tributaries with healthy biologicalcommunities. In addition, DWQ monitoring showed that several streams violated the statestandards for fecal coliform bacteria levels.Historic practices such as channelizing streams, clearing streamside vegetation and draining andfilling wetlands for agriculture and suburban development are prevalent across the watershed.Because of these practices, the quality and distribution of adequate riparian buffers in the <strong>Mud</strong><strong>Creek</strong> watershed are insufficient to protect water quality and promote good aquatic habitat. Inaddition, these practices exacerbate streambank erosion, increase sedimentation and increase thevolume and velocity of stormwater runoff.Pesticides from apple orchards and row crops likely degrade the biological communities ofstreams in the Clear <strong>Creek</strong> and Devils Fork area; both current and past use pesticides may play aExecutive SummaryPage iv
ole in stream degradation. Past use pesticides, such as DDT and chlordane, were widely used inagriculture and residential areas. In addition, row crop pesticides likely impact biologicalcommunities in upper <strong>Mud</strong> <strong>Creek</strong>.Nutrient enrichment is evident in the <strong>Mud</strong> <strong>Creek</strong> watershed and possible nutrient sources includecattle waste, straight pipes, failing septic systems and runoff from lawns, gardens, golf coursesand crop land. In urban streams, the combined factors of toxicants such as metals, organicpollutants, and pesticides and scouring energy from high stormflow volumes severely limitbiological communities. Increasing turbidity levels noted in streams in the <strong>Mud</strong> <strong>Creek</strong> watershedare probably the result of escalating land-disturbing activities.Section 3 outlines the management strategies recommended by the <strong>Mud</strong> <strong>Creek</strong> <strong>Watershed</strong><strong>Restoration</strong> Council to address these problems. These recommendations are grouped into fourcategories and the specific recommendations are presented in Table ES.1:• Stormwater: Strategies to address the volume, velocity, and quality of post-constructionrunoff from existing and future roads and commercial and residential development.• Nonpoint Source Pollution from Agricultural Activities: Strategies to reduce pesticides,nutrients, sediment and bacteria and other agriculture related non-point source pollution.• Habitat Degradation: Strategies to improve aquatic habitat needed by aquatic organismsto survive and reproduce in a stream. The recommendations address the causes of habitatdegradation including sedimentation, bank erosion, channelization, lack of riparianvegetation, loss of riffles or pools, loss of woody habitat and streambed scour (i.e., flowthat washes away habitat).• Upland Sources of Sedimentation: Strategies to reduce sediment pollution fromconstruction activities and unpaved roads and driveways.Section 4 outlines the next steps for the <strong>Mud</strong> <strong>Creek</strong> <strong>Watershed</strong> <strong>Restoration</strong> Council. Thesesteps include:• Present the <strong>Mud</strong> <strong>Creek</strong> <strong>Watershed</strong> <strong>Restoration</strong> <strong>Plan</strong> to the community.• Restructure the <strong>Mud</strong> <strong>Creek</strong> <strong>Watershed</strong> <strong>Restoration</strong> Council as a formal committee andseek appointments from the appropriate stakeholder groups.• Hire a <strong>Watershed</strong> Coordinator to work with stakeholders and agency partners toimplement the watershed plan.• Evaluate the management strategies and set long-term and short-term implementationpriorities.• Set measurable goals to track progress and document accomplishments.• Secure grants, as needed to implement education and restoration strategies.Executive SummaryPage v
Table ES.1: Proposed management strategies for addressing water quality and habitat concerns in the <strong>Mud</strong> <strong>Creek</strong> watershed.STORMWATERManagement Strategies• Develop and/or refine existing stormwater management ordinances and floodplaindevelopment ordinances.• Provide incentives to local residents to reduce stormwater runoff from existing and newdevelopment.• Review existing development ordinances and building codes for opportunities to minimizeimpervious surfaces.• Educate businesses and citizens about stormwater management issues and actions theycan take to reduce these impacts.• Consider establishing a stormwater utility to fund the stormwater program includingimprovements to the existing stormwater collection system.• Map existing stormwater collection systems to identify illicit connections and develop astrategy for redirecting these discharges to proper wastewater treatment facilities.• Implement a Stormwater BMP Retrofit Program to identify opportunities to reducestormwater impacts from existing development.• Promote pollution prevention and stormwater management by implementing BMPs ongovernment owned facilities including motor fleet maintenance areas, parks, and othersuitable sites.• Encourage local businesses to implement stormwater BMP retrofits by creating an awardprogram to cite local businesses’ accomplishmentsAG NON-POINT SOURCE POLLUTION• Promote innovative pest management practices to reduce the amount of pesticides appliedin the watershed and to reduce the likelihood for pesticides to enter streams.• Find research on pesticide drift management and work to develop new Ag Cost SharePractices to minimize pesticide drift.• Work with willing landowners to stabilize streams near orchards and row crops to minimizethe transport of historic pesticides.Lead Agency orOrganization 1 Funding 2Local GovernmentsLocal GovernmentsLocal GovernmentsLocal Governments,Council, CELocal GovernmentsNo costTax creditsNo costGrantsGrantsLocal Governments Local $$,GrantsLocal Governments,Council CELocal Governments,CouncilLocal Government,PEPS&WCD, CES&WCD, CES&WCDGrantsGrantsPrivatesectorACSPUnknownACSPExecutive Summary Page vi
Management StrategiesLead Agency orOrganization 1 Funding 2AG NON-POINT SOURCE POLLUTION continued….• Work with willing landowners to implement buffers and conventional conservation practicessuch as cover crops, no till, field borders, filter strips, on row crop land.• Initiate groundwater monitoring to determine if historic pesticides are moving from the soilsof ag fields to streams through the groundwater.• Work with willing landowners to implement animal waste practices such as livestockexclusion, feed/waste structures, stream crossing and buffer strips to protect water quality.HABITAT DEGRADATION• Restore 15,000 feet of the most critically eroding streams in the <strong>Mud</strong> <strong>Creek</strong> watershed toimprove habitat and water quality.S&WCDDWQS&WCDNCWRPACSPUnknownEQIP,ACSPNCWRP• Restore native vegetation along streams to stabilize streambanks and improve habitat. Local Governments Grants• Educate landowners about the importance of riparian buffers for streambank stabilization,water quality and habitat.• Evaluate the benefits of a buffer ordinance to protect lands adjacent to streams from futuredevelopment activities.Council, CELocal Governments• Permanently protect high priority wetlands and riparian buffers. Local Governments,CMLC, ACGCUPLAND SOURCES OF SEDIMENTATION• Consider the benefits of a local Sediment and Erosion Control Program to oversee localdevelopment activities.Local governmentsGrantsUnknownGrantsPermit Fees• Educate excavators and the public about how to control erosion. Local govts., CE Grants• Reduce the sediment pollution from unpaved roads, eroding road banks, and roadsideditches.Local governments,DOT, HOA1 Lead Agencies or Organizations are defined as follows: Council-<strong>Mud</strong> <strong>Creek</strong> <strong>Watershed</strong> <strong>Restoration</strong> Council; Local Governments – <strong>Henderson</strong> <strong>County</strong>,<strong>Henderson</strong>ville, Flat Rock, and Laurel Park; PEP-Partners for Economic Progress; S&WCD-<strong>Henderson</strong> Soil and Water Conservation District; CE-<strong>Henderson</strong><strong>County</strong> Cooperative Extension; DWQ-Division of Water Quality; NCWRP-North Carolina Wetlands <strong>Restoration</strong> Program; CMLC-Carolina Mountain LandConservancy; ACGC-Apple Country Greenways Commission; DOT-North Carolina Department of Transportation; HOA-Home Owners Associations.2 ACSP-Agriculture Cost Share Program; EQIP-Environmental Quality Incentives Program; Grants – could include EPA 319 Nonpoint Source grants, NC CleanWater Management Trust Fund Grants; NCWRP-Wetland and Stream <strong>Restoration</strong> Funds; DOT-Regional road maintenance funds.DOTExecutive Summary Page vii
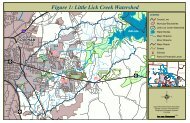
SECTION 1: PROJECT OVERVIEW1.1 Introduction<strong>Henderson</strong> <strong>County</strong> is growing at arapid rate and much of this growthis occurring in the <strong>Mud</strong> <strong>Creek</strong>watershed (Figure 1.1). Across thewatershed, developers areconverting apple orchards andpasture lands and clearing forestedhillsides for residential andcommercial developments. Waterquality problems associated withgrowth and development, as wellas agricultural practices, areevident in many streams in the<strong>Mud</strong> <strong>Creek</strong> watershed. <strong>Mud</strong> <strong>Creek</strong>and two of its tributaries, Clear<strong>Creek</strong> and Bat Fork, are currentlyon the state’s 303(d) List ofImpaired Waterbodies. TheVolunteer Water InformationNetwork (VWIN) operated by theUniversity of North Carolina atAsheville rates many streams inthe <strong>Mud</strong> <strong>Creek</strong> watershed as belowaverage and poor. In addition tocurrent landscape changes anduses, historic practices such asdraining and filling wetlands,Figure 1.1: Map of the <strong>Mud</strong> <strong>Creek</strong> <strong>Watershed</strong>.channelizing streams and clearing streamside vegetation further compromise the integrity ofthese natural systems and exacerbate the effects of growth and development on stream health andincrease the intensity and frequency of flooding.In late 1998, the Division of Water Quality (DWQ) awarded Land of Sky Regional Council ofGovernments (LOSRC) a grant to work with local stakeholders to develop a plan for addressingwater quality problems in the <strong>Mud</strong> <strong>Creek</strong> watershed. In 1999, DWQ received a grant from theNC Clean Water Management Trust Fund (CWMTF) to identify causes and sources of streamimpairment through intensive monitoring and analysis and to develop watershed managementstrategies for eleven impaired watersheds across the state. The <strong>Mud</strong> <strong>Creek</strong> watershed wasselected as one of the eleven watersheds in the <strong>Watershed</strong> Assessment and <strong>Restoration</strong> Project(WARP). Concurrently, the NC Wetlands <strong>Restoration</strong> Program (NCWRP) was interested indeveloping a local watershed plan for the <strong>Mud</strong> <strong>Creek</strong> watershed in order to identify potentialrestoration projects that the NC Department of Transportation (DOT) can implement to fulfillfuture compensatory mitigation requirements. NCWRP agreed to collect additional stream andwatershed data to supplement WARP and LOSRC efforts already underway in the watershedthrough a partnership with the Tennessee Valley Authority (TVA).Section 1: Project Overview Page 1FlatRock
Bat Fork. The overall goal of the project was to provide the foundation for future water qualityrestoration activities by: 1) identifying the most likely causes of biological impairment (such asdegraded habitat or specific pollutants); 2) identifying the major watershed activities and sourcesof pollution contributing to those causes (such as stormwater runoff from particular urban orrural areas, streambank erosion, or hydrologic modification); 3) outlining a watershed strategythat recommends restoration activities and best management practices (BMPs) to address theseproblems and improve the biological condition of the impaired streams.As part of this study, DWQ conducted extensive biological assessments in the <strong>Mud</strong> <strong>Creek</strong>watershed, sampled ambient and storm water quality and walked many miles of streams in thewatershed to assess stream habitat, morphology, and riparian zone condition. The study alsoevaluated watershed hydrologic conditions, land use, land management activities, and potentialpollution sources. WARP staff, located in Asheville, participated in <strong>Mud</strong> <strong>Creek</strong> Councilmeetings and worked closely with local resource management professionals to draw on theconcerns and experience of watershed residents, local governments and others in evaluating thenature of water quality problems and outlining potential solutions. Once complete, theassessment report describing conclusions on these issues will be available to the CWMTF,watershed stakeholders, and other interested parties through the DWQ website. Preliminary datafrom this report are summarized in Section 2.1.4 NC Wetlands <strong>Restoration</strong> Program Local <strong>Watershed</strong> <strong>Plan</strong>ningIn 2000, the NCWRP initiated a Local <strong>Watershed</strong> <strong>Plan</strong>ning program to conduct detailedrestoration planning in a limited number of Targeted Local <strong>Watershed</strong>s across the state. Theselocally-based plans include a comprehensive watershed assessment to identify causes andsources of nonpoint source impairment. The NCWRP will use these plans to identify wetlandand stream restoration projects to meet projected Department of Transportation compensatorymitigation requirements. Through this process, the NCWRP will work with local stakeholders toidentify and prioritize wetlands areas, stream reaches, riparian buffer areas and bestmanagement practices that will provide significant water quality improvement and otherenvironmental benefits to local watersheds. The NCWRP coordinates with local communitygroups, local governments, and others to develop and implement these plans. The NCWRPinitiated the local watershed planning process in the <strong>Mud</strong> <strong>Creek</strong> watershed to complement theefforts underway by the DWQ and <strong>Mud</strong> <strong>Creek</strong> <strong>Watershed</strong> <strong>Restoration</strong> Council.1.5 Tennessee Valley Authority Integrated Pollutant Source IdentificationIn 2000, the Tennessee Valley Authority developed a set of Integrated Pollutant SourceIdentification (IPSI) tools to help DWQ, the NCWRP and the <strong>Mud</strong> <strong>Creek</strong> <strong>Watershed</strong> Councilidentify and prioritize water quality improvement and protection measures in the <strong>Mud</strong> <strong>Creek</strong>watershed. The IPSI consists of a geographical database of watershed features such as landcover, estimates of impervious land cover, streams, soils, slope, and information about potentialnonpoint sources of pollution including streambank erosion sites, livestock operations, andunpaved roads. The TVA IPSI data and methods are summarized in the report <strong>Mud</strong> <strong>Creek</strong><strong>Watershed</strong> Nonpoint Source Pollution Inventory and Pollutant Load Estimates (TVA,2001). A subset of the TVA IPSI data are summarized in Section 2. The complete reportsummarizing the IPSI data for the <strong>Mud</strong> <strong>Creek</strong> watershed is available athttp://h2o.enr.state.nc.us/wrp/pdf/lwp/mud_creek_lwp_ipsi.pdf.Section 1: Project Overview Page 3
SECTION 2: MUD CREEK WATERSHED CHARACTERIZATION2.1 IntroductionThis section summarizes current watershed conditions in the <strong>Mud</strong> <strong>Creek</strong> watershed includingland use, water quality, channel and buffer conditions, habitat and wetlands. The objective ofthis analysis is to characterize existing watershed conditions and identify existing and potentialsources of water quality degradation. The Tennessee Valley Authority’s (TVA) IntegratedPollutant Source Identification (IPSI) for the <strong>Mud</strong> <strong>Creek</strong> watershed served as an importantsource of data on land use/cover, imperviousness, and stream channel and riparian conditions.The IPSI is a geographic database and pollutant loading model based on interpretation of lowaltitudecolor infrared aerial photographs taken in March 2001 (TVA, 2001). In addition, theCouncil also relied heavily on water quality and habitat assessment data gathered by WARP andwater quality monitoring data collected by VWIN.2.2 Hydrology and Sub-<strong>Watershed</strong> DelineationThe <strong>Mud</strong> <strong>Creek</strong> watershedis 113 mi 2 , comprisingapproximately one-thirdof <strong>Henderson</strong> <strong>County</strong>’sland area. <strong>Mud</strong> <strong>Creek</strong>begins in southwest<strong>Henderson</strong> <strong>County</strong> andflows east and norththrough <strong>Henderson</strong>villeto the French Broad River(Figure 2.1). Thewatershed is bounded tothe east and south by theTennessee Valley Divide,to the north by a steepmountain range and to thewest by a lower divide.<strong>Henderson</strong>ville receivesan average of 56 inches ofrainfall annually. WesternNorth Carolina has beenin a drought since mid-1998, and rainfall at<strong>Henderson</strong>ville has been84%, 75%, and 76% ofthe annual average foryears 1999, 2000, and2001, respectively.Figure 2.1: Streams in the <strong>Mud</strong><strong>Creek</strong> <strong>Watershed</strong>.Section 2: <strong>Watershed</strong> Characterization Page 4
The size of the watershed and variability of stream types make it difficult to generalizewatershed conditions. To deal with these issues, the watershed was divided into fivesubwatersheds based upon topography, hydrology and land-use considerations. Thesubwatershed boundaries are shown on Figure 2.2.Table 2.1: Summary of area, stream miles and slope by subwatershed.Subwatershed Name Drainage area Stream Miles Average SlopeClear <strong>Creek</strong> 44.5 sq. miles 136 16%Bat Fork 8.6 sq. miles 57 6%Devils Fork 16.4 sq. miles 34 5%Upper <strong>Mud</strong> <strong>Creek</strong> 20.5 sq. miles 61 17%Lower <strong>Mud</strong> <strong>Creek</strong> 22.8 sq. miles 80 11%Total 112.8 sq. miles 368 14%Figure 2.2: Subwatershedsin the <strong>Mud</strong> <strong>Creek</strong><strong>Watershed</strong>.Section 2: <strong>Watershed</strong> Characterization Page 5
2.3 SoilsThree general soil associations comprise the majority of the <strong>Mud</strong> <strong>Creek</strong> watershed soil types—(1) the Codurus-Toxaway-Rosman association, which are floodplain soils and consist of welldrained to very poorly drained soils that have loamy and sandy subsoils, (2) the Hayesville-Bradson association, which are soils on ridges and stream terraces and consist of gently slopingto moderately steep, well drained soils that have loamy and clayey subsoil, and (3) the Evard-Edneyville-Ashe association, which are soils occurring on mountain ridge tops and side slopesand consist of sloping to very steep, well drained and somewhat excessively drained soils thathave loamy subsoils (USDA, 1980).Hydric soils figure prominently in floodplain areas, especially in the Bat Fork, upper <strong>Mud</strong> <strong>Creek</strong>,the southern part of lower <strong>Mud</strong> <strong>Creek</strong>, and Devils Fork subwatersheds. Four percent of soils (4.1mi 2 ) in the watershed are hydric, and another seven percent (8.3 mi 2 ) have hydric inclusions.Many of these soils are actively drained for agriculture, and a small proportion has wetlandvegetation.2.4 Land Use/Land Cover in the <strong>Mud</strong> <strong>Creek</strong> <strong>Watershed</strong>Land use patterns can have a profound effect on water quality and stream hydrology. To assessland use patterns in the <strong>Mud</strong> <strong>Creek</strong> watershed we evaluated land use and land cover datagenerated by TVA from aerial photographs taken in March 2001. TVA’s Integrated PollutantSource Identification (IPSI) determined that 45 percent of the <strong>Mud</strong> <strong>Creek</strong> watershed is forested,25 percent is residential, commercial or industrial, and 23 percent is agricultural. Although thepredominant land cover in the <strong>Mud</strong> <strong>Creek</strong> watershed is still forest cover, the watershed isexperiencing rapid growth and development due to increasing popularity as a retirementcommunity. On the whole, agriculture is declining in <strong>Henderson</strong> <strong>County</strong>. There was a loss of25% of farmland between 1987 and 1997, and much of this land is being converted to residentialland. Agricultural commodities are changing, as well, with sod farms, and plasticulturevegetables replacing the traditional vegetable farms, orchards, corn, and dairies.Most of the forested land is along the northern and southern ridges that border the watershed,and, accordingly, the Clear <strong>Creek</strong> and upper and lower <strong>Mud</strong> <strong>Creek</strong> subwatersheds have 39-60percent of their land use in forest. However, these areas are desirable for homesites, and newdevelopment is occurring in these steeper areas. The southern ridge of the Bat Forksubwatershed, for example, is a patchwork of homesites surrounding the Kenmure golf course.Agriculture is a significant portion of the watershed, accounting for more than a fifth of eachsubwatershed except those of upper and lower <strong>Mud</strong> <strong>Creek</strong>. Apple orchards are prominent in thevalleys and on gentle slopes of the Clear <strong>Creek</strong> and Devils Fork subwatersheds and the Dunn<strong>Creek</strong> area of the Bat Fork subwatershed. Pasture, often for beef cattle, is sited along streamvalleys and accounts for at least nine percent of land use/cover in all subwatersheds. It isparticularly notable along the mainstems of Clear and <strong>Mud</strong> <strong>Creek</strong>s, but also occurs along manytributaries. Row crops are usually in flat floodplain areas, and corn and market vegetables (e.g.,squash, beans, tomatoes, and peppers) are common.Section 2: <strong>Watershed</strong> Characterization Page 6
Figure 2.3: Generalized Land Use/Land Coverpatterns in the <strong>Mud</strong> <strong>Creek</strong> watershed.Section 2: <strong>Watershed</strong> Characterization Page 8
2.5 Water Quality and Stream HealthThe primary goal of the <strong>Mud</strong> <strong>Creek</strong> <strong>Watershed</strong> <strong>Restoration</strong> Council is to improve and protectwater quality throughout the <strong>Mud</strong> <strong>Creek</strong> watershed. To accomplish this goal, the <strong>Mud</strong> <strong>Creek</strong>Council must understand the current condition of water quality and overall stream health in thewatershed, how these conditions have changed over time and what might be causing thesechanges. The following section describes existing water quality and habitat data for the <strong>Mud</strong><strong>Creek</strong> watershed and provides some general conclusions about these data. The data used for thischaracterization include DWQ basinwide monitoring data, WARP <strong>Mud</strong> <strong>Creek</strong> data and VWINmonitoring data. The purpose of this summary is to characterize water quality problems andstream health issues in the <strong>Mud</strong> <strong>Creek</strong> watershed based on these technical information sourcesand is not intended to provide detailed analysis of this information or to discuss sampling anddata methodologies.2.5.1 General Conclusions of WARP AssessmentWARP used the data summarized in the following sections to determine causes and sources ofbiological impairment for Bat Fork, Clear <strong>Creek</strong>, Devils Fork and <strong>Mud</strong> <strong>Creek</strong>. Therecommendations listed in Section 3 of this document are designed in large part to address theproblems that the WARP study has illuminated. WARP concluded that a number of factorsimpact water quality and stream health in the <strong>Mud</strong> <strong>Creek</strong> watershed:• Pesticides: Based on the data available, pesticides are likely the primary factor causingtoxic impacts to benthic macroinvertebrate communities in apple growing areas(including Clear <strong>Creek</strong> and Devils Fork). Both current use pesticides used on apples androw crops and past use pesticides used on both agricultural and residential land may playa role in stream degradation. Toxic impacts were also noted in upper <strong>Mud</strong> <strong>Creek</strong> andtomato/pepper pesticides were pinpointed as a most likely source of toxicity.• Habitat Degradation: Poor in-stream habitat for biological communities was awidespread problem in the watershed, but most notable in <strong>Mud</strong> <strong>Creek</strong> and Bat Fork.Lack of woody riparian vegetation, extensive channelization, and sedimentation (fromboth in-stream and upland sources) are key factors responsible for habitat degradation.• Stormwater: In urban streams, the combined factors of toxicants (e.g., metals, organicpollutants, and pesticides) and scouring energy from high stormflow volumes severelylimit biological communities.• Nonpoint Source Pollution: Nutrient enrichment was a notable problem in Clear <strong>Creek</strong>and Devils Fork. Nutrient sources include cattle with stream access and possibly straightpipes and failing septic systems.• Cumulative Impacts: Combined impacts of toxicants from agriculture and urbansources, scour from high stormflow volumes, poor in-stream habitat, and a lack oftributaries with healthy biological communities are responsible for chronically impairedbiological communities in lower <strong>Mud</strong> <strong>Creek</strong>.Section 2: <strong>Watershed</strong> Characterization Page 9
WARP focused on 303(d) listed streams (Bat Fork, Clear <strong>Creek</strong>, and <strong>Mud</strong> <strong>Creek</strong>). They did notintensively study many smaller streams in the watershed. However, the issues identified aboveare likely important for many streams in the <strong>Mud</strong> <strong>Creek</strong> watershed.2.5.2 DWQ Use Support RatingsIn 1997, DWQ assessed streams in the <strong>Mud</strong> <strong>Creek</strong> watershed as part of the basinwide planningprocess for the French Broad River Basin and determined that <strong>Mud</strong> <strong>Creek</strong>, Bat Fork and Clear<strong>Creek</strong> do not support their use classifications for Class C waters. The use classifications forstreams in the <strong>Mud</strong> <strong>Creek</strong> watershed are shown in Figure 2.4. Class C waters are protected forsecondary recreation, fishing, and aquatic life. Class C is the minimum protection class forfreshwaters. Class B waters are protected for primary recreation including frequent, organizedswimming. Water quality standards applicable to Class C apply to Class B waters in addition tomore stringent standards for bacterial pollution. “Tr” is a supplemental classification designed toprotect freshwaters for natural trout propagation and the survival of stocked trout, it does notdenote the presence of trout in a stream. Trout water (Tr) sections of Class B and C waters retainall respective water quality standards with the addition of more stringent standards for dissolvedoxygen, temperature, turbidity and chlorine.Figure 2.4: Use Classifications forstreams in the <strong>Mud</strong> <strong>Creek</strong> <strong>Watershed</strong>Section 2: <strong>Watershed</strong> Characterization Page 10
To determine the biological health of streams, DWQ evaluates the composition and diversity ofstream benthic macroinvertebrate communities every five years. These communities can provideimportant information about water quality stressors such as excessive nutrients, toxicants, andsediment pollution. In addition, macroinvertebrates and fish communities respond to the qualityof in-stream habitat, which is influenced by factors such as sedimentation. Thus, biologicalcommunities are reflections of stream integrity as a whole.Figure 2.5 shows the use-support rating assigned by DWQ for streams in the <strong>Mud</strong> <strong>Creek</strong>watershed and the location of the five biological monitoring sites that DWQ sampled in 1997.Streams rated as either Not Supporting or Partially Supporting are considered impaired by theDWQ. <strong>Mud</strong> <strong>Creek</strong>, Bat Fork and Clear <strong>Creek</strong> are listed on the state’s 303(d) List of ImpairedWaterbodies as Biologically Impaired Waters with no identified cause of impairment. One goalof the DWQ <strong>Watershed</strong> Assessment and <strong>Restoration</strong> Project (WARP) is to determine the causeof impairment of these streams. A summary of the data collected as part of the WARP study ispresented in Section 2.5.3. A complete summary of the DWQ Use Support Ratings and StreamUse Classifications for the French Broad River Basin, including the <strong>Mud</strong> <strong>Creek</strong> watershed isavailable at http://h2o.enr.state.nc.us/basinwide/french/frenchbroad_wq_management_plan.htm.Figure 2.5: Use-support Ratings forstreams in the <strong>Mud</strong> <strong>Creek</strong> <strong>Watershed</strong>.Section 2: <strong>Watershed</strong> Characterization Page 11
2.5.3 DWQ’s <strong>Watershed</strong> Assessment and <strong>Restoration</strong> Project (WARP)In 2000, WARP launched a comprehensive assessment of the <strong>Mud</strong> <strong>Creek</strong> watershed to: 1)determine the most likely causes of biological impairment; 2) identify the major watershedactivities and pollution sources; and 3) outline a general watershed strategy that recommendsrestoration activities and best management practices (BMPs) to address the identified problems.As part of this assessment, WARP conducted a wide range of data collection activities, includingbenthic macroinvertebrate and water quality sampling, which are summarized in this section. Adetailed description of all their data collection methods as well as an analysis of their findings ispresented in the report titled Biological Impairment in the <strong>Mud</strong> <strong>Creek</strong> <strong>Watershed</strong> (DWQ, 2003).Biological Sampling: WARP conducted biological sampling at 23 sites in the <strong>Mud</strong> <strong>Creek</strong>watershed and two reference sites outside the watershed between July 2000 and October 2001(Figure 2.6). WARP used benthic macroinvertebrate communities to characterize steam health.WARP evaluated a number of community characteristics, including diversity, pollution toleranceof the community as a whole, and species composition, to determine community health and thetypes of pollution impacting the streams. In addition to gathering data at known problem sites inthe watershed, WARP also collected samples at reference sites to establish benchmarks forhealthy biological communities and conducted habitat assessments at all sites to determine if thelack of habitat might also be a potential source of stress for these communities. Habitat scoresconsidered channel modifications, in-stream habitat (such as leafpacks, sticks, large woodydebris and rocks), sedimentation, riparian zone integrity, and riffle and pool frequency.WARP found that thehealthiest communities are inheadwater streams withadequate habitat that drainforested areas of thewatershed—Laurel Fork,upper Cox <strong>Creek</strong> and Harper<strong>Creek</strong> in the Clear <strong>Creek</strong>subwatershed and upper <strong>Mud</strong><strong>Creek</strong> above Walnut CoveRoad. Degraded benthiccommunities were found atalmost all other sample sites.Figure 2.6: WARP BiologicalMonitoring SitesDegraded biologicalcommunities were reportedfrom the urban portions of thewatershed, including DevilsFork at US 64 and <strong>Mud</strong> <strong>Creek</strong>at 7 th Avenue (in<strong>Henderson</strong>ville). Habitatscores were very low in theseurban areas and likelycontributed to communitySection 2: <strong>Watershed</strong> Characterization Page 12
degradation. In addition, the WARP study suggested that the high velocity and volume ofstormwater runoff generated by urban development scour stream channels, removing key habitatsuch as leafpacks and woody debris.Many of the biological sampling sites showed biological communities exposed to periodic toxicstress, most notably the sites downstream from large areas of apple orchards and row crops.Suspecting that pesticides might be impacting communities in lower Clear <strong>Creek</strong> and DevilsFork, WARP sampled these sites before, during and after the growing season. Figure 2.7illustrates the benthic community status at the biological sampling sites in the Clear <strong>Creek</strong> andDevils Fork subwatersheds and their proximity to orchards and row crops.A number of impacts other than toxicity likely influence the benthic communities at some sites.Benthic community analysis for Clear <strong>Creek</strong> at Mills Gap Road and both sites on Devils Forkshowed signs of organic enrichment or high nutrients. WARP also determined that in upper <strong>Mud</strong><strong>Creek</strong> and in many areas throughout the watershed, excess sedimentation exacerbates many ofthe primary causes of impairment.Figure 2.7: Apple orchards, row crops, andbenthic macroinvertebrate communities in theClear <strong>Creek</strong> and Devils Fork Subwatersheds.Section 2: <strong>Watershed</strong> Characterization Page 13
Chemical Water Quality Sampling: In addition to biological sampling, WARP also conductedextensive chemical water quality sampling to characterize water quality conditions in thewatershed and to evaluate whether chemical and physical conditions might be negativelyaffecting benthic communities. WARP established five sampling stations at the downstreamends of the subwatersheds and evaluated these sites monthly for a standard set of parametersincluding pH, dissolved oxygen, temperature, metals, turbidity, and nutrients. Samples werecollected during both baseflow and stormflow periods. WARP also collected grab samples at anumber of sites in the watershed with known biological impairment. The purpose of the grabsamples was to assess potential chemical stressors such as pesticides, hydrocarbons and volatileorganic pollutants. Figure 2. 9 illustrates the location of WARP water quality sampling sitesacross the <strong>Mud</strong> <strong>Creek</strong> watershed.WARP chemical water qualitymonitoring data indicated thatmany streams in the <strong>Mud</strong><strong>Creek</strong> watershed includingupper and lower <strong>Mud</strong> <strong>Creek</strong>,Clear <strong>Creek</strong>, Devils Fork, andBat Fork have higher nutrientand specific conductancelevels than expected forunpolluted streams in themountains. However, theselevels were not high enough toaffect biological communitiesor exceed NC’s standard oraction levels. Dissolvedoxygen levels in these streamswere adequate for aquatic life.In upper <strong>Mud</strong> <strong>Creek</strong> and BatFork, fecal coliform bacterialevels were above the NCstandards of 200colonies/100mL. Althoughfecal coliform does not affectbiological communities, it canindicate the presence of virusesand pathogens that pose a riskto human health.Figure 2.8: Location of WARPwater chemistry sampling sites.Water samples taken during storms in the Clear <strong>Creek</strong> watershed had levels of insecticides thatare above ecological screening benchmarks and may cause sub-lethal impacts to aquatic insects.Bed sediment samples collected from upper <strong>Mud</strong> <strong>Creek</strong> and Clear <strong>Creek</strong> provided evidence ofboth current and past use pesticide inputs. WARP identified pesticides as a cause of biologicalimpairment in these streams.Section 2: <strong>Watershed</strong> Characterization Page 14
WARP also evaluated selected metals concentrations in the watershed including cadmium,copper, lead, silver and zinc. Median metal values for baseflow samples collected by WARPwere generally below NC’s standards or benchmark levels. However, some stormflow samplesexceeded the benchmark levels for cadmium, copper, lead and/or zinc. Bioassay results fromthese samples indicated that these metal levels were not acutely toxic; however, results from aDevils Fork sample taken below a large commercial area showed acute toxicity, likely due tohigh copper, lead, and zinc concentrations. For a more detailed discussion of the WARPmonitoring protocol, sampling results and analysis, see the report titled Biological Impairment inthe <strong>Mud</strong> <strong>Creek</strong> <strong>Watershed</strong>, 2003.2.5.4 Volunteer Water Information NetworkThe Volunteer Water Information Network (VWIN) monitors 33 sites in <strong>Henderson</strong> <strong>County</strong>monthly for a wide range of water quality parameters including sediment, water clarity, pH,alkalinity, conductivity, heavy metals, and nutrients. Nine of these sites are located in the <strong>Mud</strong><strong>Creek</strong> watershed (Figure 2.9). VWIN has monitored five of these sites monthly for nine yearsand the other three for over three years. This information is valuable in assessing current waterquality conditions and trends in the <strong>Mud</strong> <strong>Creek</strong> watershed.As shown in Figure 2.9, noneof the sites monitored byVWIN in the <strong>Mud</strong> <strong>Creek</strong>watershed rate excellent, butthree rate good. The remainingsites are either average (3),below average (2) or poor (1).To determine these ratings,VWIN compares nutrient,metals, and sediment values atthese sites to a regionalaverage for Western NorthCarolina. The regional averageis a composite score developedfrom VWIN monitoring effortsin <strong>Henderson</strong> <strong>County</strong> as wellas other western counties.Figure 2.9: Water Quality rating for VWINmonitoring sites in the <strong>Mud</strong> <strong>Creek</strong> <strong>Watershed</strong>.Section 2: <strong>Watershed</strong> Characterization Page 15
Good Sites: Consistent with the WARP study, the most upstream sites show fewer water qualityproblems than sites located in the more developed areas of the watershed. However, even at thegood sites, VWIN noted that nutrient concentrations at the Berea Church Road site have beenunusually high at times and that turbidity, conductivity, lead, and all three nutrient levels at Clear<strong>Creek</strong> at Apple Valley Road are increasing over time. VWIN concludes that the increasingturbidity levels are probably the result of escalating land disturbing activities.Average Sites: VWIN rates three sites in the <strong>Mud</strong> <strong>Creek</strong> watershed, Brittain <strong>Creek</strong>, Bat Fork<strong>Creek</strong>, and <strong>Mud</strong> <strong>Creek</strong> at 7th Avenue as average. VWIN data indicate that conductivity levelsand heavy metals concentrations in Brittain <strong>Creek</strong> have been high at times and construction sitesmay be the greatest contributor of sediment to the creek during rains. The site on <strong>Mud</strong> <strong>Creek</strong> at7th Avenue shows high concentrations of zinc probably due to road runoff and elevated nutrientconcentrations that may be coming from upstream sources. Diverting wastewater effluent fromthe GE plant to the <strong>Henderson</strong>ville wastewater treatment plant has helped to improve waterquality in Bat Fork, however nutrients and conductivity levels continue to be abnormally high.VWIN suggests that livestock may be the main source of nutrients to Bat Fork.Below Average Sites: VWIN rates Devil's Fork and Clear <strong>Creek</strong> at Nix Road (the downstreamsite on Clear <strong>Creek</strong>) below average. The nutrient and conductivity levels measured at Devil'sFork suggest that agriculture may be the most important source of pollutants to this stream. Bothof these streams have a heavy build-up of sediment in the downstream areas indicating thaterosion and runoff, including sediment pollution from land disturbing activities, have probablybeen impacting these streams for a long time.Poor Sites: <strong>Mud</strong> <strong>Creek</strong> at North Rugby Road is one of three sites in <strong>Henderson</strong> <strong>County</strong> thatrates poor. This site has consistently rated poor throughout the nine years of analysis. Nutrientconcentrations are much higher than average and water clarity is consistently poor. Nutrientconcentrations increase when stream flow decreases indicating a point-source for thesepollutants. Clear <strong>Creek</strong> shows serious problems with sedimentation and VWIN indicates thatland disturbing activities are probably a significant factor.2.5.5 Channel and Riparian Buffer ConditionChannel and buffer condition are important indicators of stream habitat and watershed health.Severely eroded streams produce significant quantities of sediment that are carried and depositeddownstream where they smother aquatic habitat. In some cases, channels become so deep andwide that the stream can no longer access the flood plain during a significant storm eventincreasing the likelihood of flooding downstream areas. WARP walked many miles of stream inthe <strong>Mud</strong> <strong>Creek</strong> watershed to document channel and riparian buffer condition, however this is avery time intensive effort and they were not able to observe every stream in the watershed. Aspart of the IPSI, TVA also evaluated channel and buffer conditions using aerial photography.These data are useful for documenting areas of the watershed with eroding streambanks andinadequate riparian buffers as well as streams channels that have been altered from their naturalstate.Section 2: <strong>Watershed</strong> Characterization Page 16
Channelized Streams: Channelization, or the straightening of streams, was a common practicein the <strong>Mud</strong> <strong>Creek</strong> watershed to improve drainage and increase valuable floodplain areas forfarming. This practice destroys stream habitat by eliminating riffles and pools and meanderbends. The practice also dramatically affects the watershed hydrology by deepening channels,lowering the water table and increasing the stress on streambanks during storm events. Overtime, channelized streams can become very deep and overly wide with almost verticalstreambanks that can collapse sending large quantities of sediment directly into the stream. If thestreams become very incised, they will no longer over top their banks during storm eventsincreasing the volume and velocity of stormwater to downstream areas.Historical topographic and parcelmaps reveal that large-scalechannelization of <strong>Mud</strong> <strong>Creek</strong>occurred between 1840 and 1890(Figure 2.10). Many tributaries to<strong>Mud</strong> <strong>Creek</strong>, including Bat Forkand Devils Fork, were alsochannelized. Major floods of1916, 1940, and 1964 caused muchconcern, leading to a number ofstream channelization anddredging projects aimed atminimizing flooding problems.Figure 2.10: Map of <strong>Henderson</strong>ville showing <strong>Mud</strong><strong>Creek</strong> prior to channelization.Table 2.3 illustrates the percentageof stream miles by subwatersheddelineated as channelized by theTVA IPSI. Over 50% of thenatural channels and aquatichabitat of Bat Fork and DevilsFork have been significantlyaltered by this practice. Biologicalmonitoring data collected byWARP in these areas suggests thatloss of habitat in these areas could be impacting the benthic communities in these subwatersheds.Eroding Streambanks: Although severe streambank erosion may be limited to short streamreaches, the sediment pollution from these eroding banks can have impacts throughout thewatershed. The sources of excess sedimentation noted in stream channels throughout the <strong>Mud</strong><strong>Creek</strong> watershed are often not readily apparent because the sediment is from erodingstreambanks, and it is then transported and deposited downstream. Table 2.3 illustrates thepercentage of streambank miles that are eroding in each subwatershed as determined by the TVAIPSI from aerial photography. Field assessments conducted by WARP staff suggest that theseestimates are conservative probably due to the limitations of determining eroding banks fromaerial photos. Although the TVA IPSI data indicate that only 18% of the streams in the Clear<strong>Creek</strong> subwatershed are eroding, a more detailed analysis of these data show that the impact ofSection 2: <strong>Watershed</strong> Characterization Page 17
eroding streambanks is more significant in some areas of the watershed. In the Lewis <strong>Creek</strong> and<strong>Henderson</strong> <strong>Creek</strong> drainages, 37% and 25% of the streams are severely eroding. There are manypotential factors that exacerbate streambank erosion including channelization, a lack of riparianvegetation to stabilize banks and cattle with direct access to streams. Locating eroding streamsbanks is a first step to addressing this problem; understanding the factors that contribute to theproblem requires a more detailed analysis.SubwatershedTable 2.3: Channelization and Buffers in the <strong>Mud</strong> <strong>Creek</strong> watershedPercentage of Subwatershed Stream MilesChannelizedstreamsErodingStreambanks*Adequate Buffers onBoth Banks*Bat Fork 56% 6% 15%Clear <strong>Creek</strong> 28% 18% 11%Devils Fork 55% 18% 2%Upper <strong>Mud</strong> <strong>Creek</strong> 18% 12% 12%Lower <strong>Mud</strong> <strong>Creek</strong> 28% 13% 9%Total <strong>Watershed</strong> 33% 14% 11%*Determined for a subset of streams (44% of total) that have a larger drainage area;adequate buffers are those with >= 30 ft of woody vegetation with >= 66% crown cover.Riparian Buffer Condition: As shown in Table 2.4, very few of the larger streams in the <strong>Mud</strong><strong>Creek</strong> watershed have adequate riparian buffers. Riparian buffers have many importantwatershed functions. The deep roots of riparian vegetation help to stabilize streambanks andreduce erosion. Overhanging tree limbs shade streams and keep waters cool in the summer toprotect fish and other aquatic life. Adequately sized riparian buffers can also filter pollutantssuch as nutrients and sediment pollution that runs off adjacent fields and parking lots. Riparianbuffers also provide a protected corridor for wildlife migration. For all these reasons, riparianbuffer condition is an important indicator of stream health.TVA IPSI data provide information about the width and vegetation type and condition of riparianbuffers for all streams deemed perennial. These “perennial” streams are a subset of streams(only 44% of the total stream miles identified by the IPSI) that have larger drainage areas and arean underestimate of true perennial stream miles. For this report, adequate buffers weredetermined as those with woody vegetation with at least 66% crown cover and a width of >30 ft.In general, adequate buffers are present along upper sections of the tributaries that drain theforested northern ridge. In the lower gradient areas that are primarily in agriculture, there aresmall stream sections that have adequate buffers in small forested patches. Based on thisassessment, the current quality and distribution of adequate riparian buffers in the <strong>Mud</strong> <strong>Creek</strong>watershed is too limited to protect water quality and promote good aquatic habitat.Section 2: <strong>Watershed</strong> Characterization Page 18
2.6 Local Water Quality Initiatives2.6.1 Local Environmental OrdinancesA set of state and local regulatory programs impact development and water quality protection inthe <strong>Mud</strong> <strong>Creek</strong> watershed, the most important of which are described below.<strong>Henderson</strong> <strong>County</strong> Ordinances• Subdivision Ordinance and the Manufactured Home Park Ordinance: These ordinancesrequire that stormwater drainage facilities be constructed to minimize erosion andsedimentation, minimize flooding, and avoid excessive discharge; however,specifications for post-development stormwater discharge volume and rate are notaddressed. The Subdivision Ordinance requires that structures built upon lots withinnewly platted subdivisions must remain 30 feet from the edge of any blue line streams (asindicated on USGS 1:24,000 Topographic Maps). However, the ordinance does notrequire that the area within this setback remain vegetated or permeable to water.• Water Supply <strong>Watershed</strong> Protection Ordinance: This ordinance delineates the uses anddevelopment of land and structures in water supply watersheds within <strong>Henderson</strong> <strong>County</strong>in order to maintain the high quality of surface water; however, no streams in the <strong>Mud</strong><strong>Creek</strong> watershed fall within this ordinance.• Farmland Preservation: This ordinance encourages the voluntary preservation andprotection of farmland from non-farm development.<strong>Henderson</strong>ville Ordinances• Floodway and floodway fringe development. Development is limited in the floodway andfloodway fringe in order to minimize public and private losses due to flood conditions. Itprovides guidance to control the alteration of natural floodplains, stream channels, andnatural protective barriers involved in the accumulation of flood waters, including filling,grading, dredging, or other development which may increase erosion or flood damage.Redevelopment in the floodway and fringe is permissible provided there is no loss offlood storage and the project utilizes BMPs to reduce post-redevelopment stormwater rateif feasible.• Stormwater management. Any development that includes impervious surfaces greater orequal to 0.5 acres must submit a stormwater management plan with stormwater controls.Post-development runoff rate must not exceed the pre-development rate.• Natural Resources Protection Ordinance. This ordinance contains a stream bufferprotection standard that requires protection of a 50 foot buffer on both sides of blue linestreams identified on the current USGS quadrangle maps. Existing uses of the bufferzone are allowed. The 50 foot buffer is divided into two zones—a 30 foot area ofundisturbed vegetation adjacent to the channel followed by a 20 foot belt of eithermanaged or unmanaged vegetation.Section 2: <strong>Watershed</strong> Characterization Page 19
Flat Rock Ordinances• Subdivision buffer requirement. This requires protection of a 50 foot set back onperennial streams, lakes, and wetlands as they appear on USGS topographic maps; thesetback is divided into two areas—a 25 foot zone of natural vegetation adjacent to thechannel followed by a 25 foot belt of either managed or natural vegetation. Perennialstreams not on a USGS topo, require a 10 foot buffer of natural vegetation.• Floodplain ordinance. No structures, with some exceptions, or fill are allowed in the 100year floodplain.• Stormwater management. Both subdivisions and other types of commercial andresidential developments are required to construct stormwater drainage facilities toprevent downstream erosion/sedimentation and follow existing natural drainage. Wherefeasible, stormwater discharge points must discharge through vegetated areas. Inaddition, commercial and residential developments (excluding subdivisions) are requiredto have stormwater controls to insure that post-development stormwater runoff rates donot exceed pre-development rates.2.6.2 Land Use <strong>Plan</strong>ning and ZoningLocal governments use zoning and land use planning to guide growth, ensure adequateinfrastructure and services and to protect environmental resources. Local zoning ordinances area good indicator for how an area, like the <strong>Mud</strong> <strong>Creek</strong> watershed, might grow and develop andhow this growth might impact water quality. Table 2.5 summarizes the current zoning in the<strong>Mud</strong> <strong>Creek</strong> watershed. The zoning categories used in Table 2.5 generalize some 63 distinctzoning classifications of the five governmental entities with zoning authority in the <strong>Mud</strong> <strong>Creek</strong>watershed.The “traditional” zoning districts, such as residential, commercial and industrial, account formore than 43% of the total <strong>Mud</strong> <strong>Creek</strong> watershed. Each of these zoning districts containselements regulating lot size, structure size, and property line setbacks. To the extent that landuse affects water quality, each of these districts can have considerable positive and negativeimplications for water quality. Most districts regulate the size of the lot, thus affecting densityand potentially the degree of urban runoff. However, none of the districts regulate the amount ofimpervious surface or require permanent measures to control storm water runoff. Over 78% ofthe watershed falls within the zoning jurisdiction of <strong>Henderson</strong> <strong>County</strong>, with over 54% of thewatershed falling within the <strong>County</strong>’s Open Use Zoning District. Through issuance of a specialuse permit, open use zoning allows for many land uses, such as mining and extraction operationsand junkyards, that could pose a threat to water quality. Given the flexibility inherent in OpenUse Zoning, it is difficult to project the potential impacts to water quality from futuredevelopment in the watershed.Section 2: <strong>Watershed</strong> Characterization Page 20
Table 2.4: Summary of Zoning in the <strong>Mud</strong> <strong>Creek</strong> watershed.Generalized ZoningCategoryAcres PerCategoryPercentage of<strong>Watershed</strong> inZoning CategoryCommercial 3,295 5%Industrial 1,138 2%ResidentialHigh Density 1,006 1%Medium Density 10,929 15%Low Density 15,045 21%Open Use Zoning 39,071 54%Open Water 43
ECO has coordinated the VWIN program in <strong>Henderson</strong> <strong>County</strong> in conjunction with EQI formore than a decade, providing trained volunteers to sample 33 sites on 28 streams each month(see paragraph 2.6.5). Monthly sample data and the VWIN annual report are distributedby ECO to elected officials in <strong>Henderson</strong> <strong>County</strong> and the public. Where significant problems arenoted, ECO makes every effort to follow up with landowners or proper authorities to rectify andimprove sample results.A biological monitoring program in <strong>Henderson</strong> <strong>County</strong> streams, begun by ECO in 2001, isconducted semi-annually on seven sites in the <strong>Mud</strong> <strong>Creek</strong> watershed. The data gathered by thetrained volunteers on these and other sites will be included in annual VWIN reports beginningwith the 2001 report.An annual community-wide stream cleaning project -- NC Big Sweep – is also coordinated in<strong>Henderson</strong> <strong>County</strong> by ECO. On the third Saturday in September each year, many volunteerspitch in to clean debris and trash from local waterways as part of the statewide litter removalprogram. For several years, the project in <strong>Henderson</strong> <strong>County</strong> has focused oncleaning <strong>Mud</strong> <strong>Creek</strong> and its major tributaries.In addition, ECO presents regular public programs on water quality issues, especially focusingon ways to reduce sedimentation and ways for homeowners to have wildlife-friendly yards andgardens without using fertilizers, pesticides, and herbicides. ECO sponsors forums andworkshops on a number of water quality topics throughout the year.2.6.5 Volunteer Water Information Network (VWIN)VWIN is a water quality monitoring program run by citizens and the Environmental QualityInstitute (EQI) at the University of North Carolina at Asheville. Volunteers collect samples atnine locations in the <strong>Mud</strong> <strong>Creek</strong> watershed monthly. Samples are sent to EQI for analysis oftwelve parameters, including nutrients, metals, and turbidity. VWIN monitors over 200 streamand lake sites monthly throughout Western North Carolina. Local volunteers collect samples atspecified sites on a given day each month, and samples are delivered to EQI for analysis. VWINprepares an annual report for each area at the end of the monitoring year. The annual reportincludes comparisons of each site and each area with all sites analyzed in the mountain region.Local governments and organizations can use this information to compare similar situations andbetter recognize regional issues and develop regional solutions. Trend analysis is also carriedout on sites that have been monitored over a period of years. This provides information onchanging water quality over time and season.2.6.6 Southside Development InitiativeIn the summer of 2002 the City of <strong>Henderson</strong>ville engaged The Lawrence Group, town plannersand architects, to prepare a master plan for the City’s Southside, a 195-acre area centered on theintersection of U.S. Highways 25 and 176. Most of the area lies within the 100-year flood plainof <strong>Mud</strong> <strong>Creek</strong>; however, it was heavily developed prior to the City’s participation in the FederalEmergency Management Agency (FEMA) program. <strong>Mud</strong> <strong>Creek</strong> itself bisects the Southside,crossing under U.S. 25 just north of its intersection with U.S. 176.Section 2: <strong>Watershed</strong> Characterization Page 22
The Lawrence Group facilitated a week-long design charette in September, soliciting input froma wide range of “stakeholders”. The end-product of that process is a document called the<strong>Henderson</strong>ville Southside Development Initiative (SDI) which provides a vision for the futureredevelopment of this area. The SDI <strong>Plan</strong> is intended to provide a clear framework for theredevelopment of the Southside through a series of incremental, private and public developmentdecisions.Included within the Southside study area are two large tracts totaling 26.5 acres which, withinthe last year, the City has acquired with assistance from the North Carolina Wetlands <strong>Restoration</strong>Program (WRP). The <strong>Plan</strong> noted the importance of these parcels to the Southside DevelopmentInitiative and encouraged the City to continue to work with WRP to develop wetlands restorationprograms and to assist with flood mitigation. The City has entered into a memorandum ofunderstanding with WRP for the accomplishment of these restoration projects.2.6.7 Apple Country GreenwaysThe Apple Country Greenway Commission is a governmental organization created by aninterlocal agreement between all five <strong>Henderson</strong> <strong>County</strong> local governments. In 2001, theCommission completed a greenway masterplan for <strong>Henderson</strong> <strong>County</strong>. The Oklawaha Trailproject, adjacent to <strong>Mud</strong> <strong>Creek</strong>, is already underway. Greenways located in riparian areas canhelp to improve habitat and water quality by protecting riparian areas from development.Greenways can also raise public awareness about water quality and stream condition. One goalof the Apple Country Greenway Commission is to design a plan that preserves, promotes andenhances environmental assets. To accomplish this goal, they laid out a number of objectivesthat are very consistent with the goals of the <strong>Mud</strong> <strong>Creek</strong> <strong>Watershed</strong> <strong>Restoration</strong> Council. Theseinclude:• Encourage localities to include greenways as a flood reduction strategy in their stormwaterregulations.• Develop a countywide strategy for protecting natural stream corridors and other open space,plus a mitigation program for addressing resources that have been adversely altered by landdevelopment.• Use areas adjacent to greenways as natural areas that protect, maintain, or restore naturalvegetation and aquatic and wildlife habitats.2.6.8 Carolina Mountain Land ConservancyThe Carolina Mountain Land Conservancy (CMLC) is a nonprofit organization that works todirectly protect the natural diversity and beauty of western North Carolina by preservingsignificant natural lands and scenic areas. Founded in 1994, CMLC has helped protect morethan 8,600 acres of land in <strong>Henderson</strong>, Transylvania and neighboring counties.CMLC is pursuing funds to acquire voluntary donated conservation easements on key propertiesin the <strong>Mud</strong> <strong>Creek</strong> watershed. CMLC intends to work in concert with the <strong>Mud</strong> <strong>Creek</strong> <strong>Watershed</strong><strong>Restoration</strong> Council’s efforts by preserving creeks and streams with existing high quality buffersand intact forests critical to maintaining watershed quality in the future. CMLC identified fourSection 2: <strong>Watershed</strong> Characterization Page 23
areas as the most significant areas for protection in terms of water quality preservation andnatural heritage protection in the <strong>Mud</strong> <strong>Creek</strong> watershed. These areas are described below.Bearwallow Highlands: The Bearwallow Highlands, a rugged series of peaks and ridges, formthe northwestern boundary of the <strong>Mud</strong> <strong>Creek</strong> watershed. Bearwallow Mountain is the tallestpeak in <strong>Henderson</strong> <strong>County</strong> outside the Pisgah National Forest. This area represents an importantpart of the natural and cultural heritage of the region.Floodplain/Agricultural: The <strong>Mud</strong> <strong>Creek</strong> and Clear <strong>Creek</strong> valleys have a long-standing historyof productive agricultural use. In particular, the orchards of northeast <strong>Henderson</strong> <strong>County</strong> alongthe Clear <strong>Creek</strong> and its tributaries have historically brought the county the distinction of thebeing the largest apple producer in North Carolina.West <strong>Henderson</strong> Camps: Western <strong>Henderson</strong> <strong>County</strong> has for many years been home to acluster of summer camps, and retreat and conference centers. Children and families from aroundand beyond the state retain fond associations of a summertime experience amid the naturalbeauty of this area.Flat Rock Natural Heritage: The wetlands of the French Broad and <strong>Mud</strong> <strong>Creek</strong> systemsexhibit more community diversity than those of any other region of western North Carolina.Their broad floodplains, oxbows, backwaters, and bogs provide habitat for numerous plantspecies that are often uncommon or non-existent in other mountain counties.2.6.9 French Broad River Training <strong>Center</strong>The NCSU Cooperative Extension (CE) is also playing a significant role in developing BMPdemonstration projects, educating the public and landowners, and conducting training sessionsfor professionals in the region. A stormwater wetland was installed at a new container nursery inthe Clear <strong>Creek</strong> watershed. This project was funded by the CE’s Mountain Nurseries – Keepingthe French Broad Clean Project. The CE’s Upper French Broad River Riparian <strong>Restoration</strong> andProtection Project is working with willing landowners to restore riparian buffers along the Riverand its tributaries in <strong>Henderson</strong> and Transylvania counties. The Training <strong>Center</strong> has conductedregional training sessions on watershed and floodplain management, stormwater and erosioncontrol, low impact development, conservation easements and riparian buffer restoration.Section 2: <strong>Watershed</strong> Characterization Page 24
SECTION 3: RECOMMENDATIONSBased on the <strong>Watershed</strong> Assessment and <strong>Restoration</strong> Project’s (WARP) water qualitymonitoring and habitat assessments, Tennessee Valley Authority’s (TVA) IPSI data, andVolunteer Water Information Network (VWIN) data, the <strong>Mud</strong> <strong>Creek</strong> <strong>Watershed</strong> Council hasdetermined that the following issues pose the greatest threat to water quality and stream health inthe <strong>Mud</strong> <strong>Creek</strong> watershed and should be addressed by the watershed plan:• Stormwater: Post-construction runoff from roads and commercial and residentialdevelopment. The primary issues related to stormwater result from volume, velocity, andquality. Recommendations need to consider stormwater resulting from existing developmentbut also how to address stormwater from future development.• Nonpoint Source Pollution from Agricultural Activities: Pesticides, nutrients, sediment andbacteria and other agriculture related non-point source pollution.• Habitat Degradation: Removal of habitat needed by aquatic organisms to survive andreproduce in a stream. Causes of habitat degradation can include sedimentation, bankerosion, channelization, lack of riparian vegetation, loss of riffles or pools, loss of woodyhabitat and streambed scour.• Upland Sources of Sedimentation: Sediment from construction activities, unpaved roads anddriveways, forestry, mining and development.This section provides a general overview of each of these major issue areas and providesrecommended actions to address these problems.Section 3: Recommendations Page 25
3.1 Stormwater3.1.1 OverviewThe conversion of farmland, forests and wetlands to rooftops, roads, and parking lots creates alayer of impervious cover in the watershed that prevents precipitation from infiltrating the soiland recharging the groundwater. In natural systems, less than a third of rainfall runs off of thelandscape. Most of the rainfall is absorbed by wetlands or percolates to ground water aquifersand is slowly released to streams and lakes. In watersheds with a large amount of imperviouscover, much of the rainfall is converted to stormwater runoff and is diverted quickly to streamsvia stormwater systems, including ditches. Stormwater runoff from roads and commercial andresidential development impacts stream habitat by scouring the streambed and banks. Over time,these high velocity streamflows destabilize the streambanks causing them to collapse depositinglarge amounts of sediment into the stream channel. In addition, stormwater runoff also carriestoxins, such as metals and organic pollutants, from parking lots and other paved surfaces directlyto the streams.The towns of <strong>Henderson</strong>ville, Flat Rock, part of Laurel Park and surrounding developed areasdrain to <strong>Mud</strong> <strong>Creek</strong>, Devils Fork, Bat Fork, and many of their tributaries. Stormwater is directedto the creeks, carrying with it pollutants from parking lots, roads, roofs, and other impervioussurfaces. Activities near streams by residential landowners are also a source of non-point sourcepollution. Homes that are sited along the streams produce runoff from roofs, driveways, andlawns which are a source of nutrients, fecal contamination (from pets), and other pollutants.There is a large network of roads through the <strong>Mud</strong> <strong>Creek</strong> watershed, including Interstate 26, US64, US 25, and US 176. Roads serve as conduits of stormwater which carries metals andhydrocarbons built up on the road surfaces.As the percentage of impervious cover in the watershed increases, so do the volume and velocityof stormwater runoff, and this can negatively impact stream health. WARP data concluded thatstormflow scour of stream bed substrate is a significant issue for urban sections of <strong>Mud</strong> <strong>Creek</strong>and its urban tributaries. Impervious cover is a good indicator to determine if a watershed is atrisk from stormwater impacts. These impacts can include: increased flooding, unstable streamchannels, increased streambank erosion, loss of instream habitat, and a decline in water quality.The <strong>Center</strong> for <strong>Watershed</strong> Protection (CWP, 2001) presents three vulnerability categories basedon impervious cover:(1) Sensitive stream. 0-10 % impervious cover. Stable stream channel, good habitat, diversebiological communities.(2) Impacted stream. 11-25% impervious cover. Stream channels erode and widen, banksunstable. Habitat declines. Sensitive biota disappear.(3) Severely impacted stream. >26% impervious cover. Stream channel highly unstable.Habitat very degraded. Only pollution tolerant biota present.Based on data compiled through the Integrated Pollutant Source Identification project conductedby the Tennessee Valley Authority, the <strong>Mud</strong> <strong>Creek</strong> watershed has roughly 10 percent imperviouscover. However, the percent of imperviousness varies greatly throughout the watershed. Figure3.1 illustrates that drainages in the <strong>Henderson</strong>ville and Laurel Park area approach or exceed theseverely impacted stream category, including Wash <strong>Creek</strong> (32%), Brittain <strong>Creek</strong> (23%), anddrainages along the <strong>Mud</strong> <strong>Creek</strong> mainstem (22%, 43%, 27%) and Bat Fork (36%). Clear <strong>Creek</strong>Section 3: Recommendations Page 26
and upper <strong>Mud</strong> <strong>Creek</strong> drainages have relatively low imperviousness, reflecting the lower amountof development in these primarily forested and agricultural areas.Figure 3.1: Stream vulnerability rating based onpercent impervious cover in the <strong>Mud</strong> <strong>Creek</strong><strong>Watershed</strong> – by subwatershed.Section 3: Recommendations Page 27
In addition to impervious cover, the presence of functional wetlands is another indicator forassessing the risk of water quality degradation from stormwater impacts. Functional wetlandsact as both sponges and filters during storm events. When wetlands are drained to accommodateagricultural activities or development, these functions are lost or impaired—resulting indecreased recharge, increased flooding, degraded water quality and increased stormwater flows.Hydric soils are one indicator for the presence or historical presence of wetlands.An analysis of the IPSI data reveals over four square miles of hydric soils in the <strong>Mud</strong> <strong>Creek</strong>watershed and over eight square miles of soils with hydric inclusions (Figure 3.2). The IPSI dataalso show that only 0.9 sq. miles of the watershed currently support wetland vegetation,suggesting a significant loss of functional wetlands in the <strong>Mud</strong> <strong>Creek</strong> watershed and an increasedlikelihood of stream quality impacts due to stormwater volume and velocity. In May 2002, TheCity of <strong>Henderson</strong>ville and WRP entered into a Memorandum of Understanding to purchase andrestore 26 acres of degraded wetlands adjacent to <strong>Mud</strong> <strong>Creek</strong> in <strong>Henderson</strong>ville’s Southside.Projects like these, designed to restore lost wetland and floodplain functions, are critical steps toreducing stormwater velocities and volumes.Figure 3.2: Existing wetlands and areas withhydric soils in the <strong>Mud</strong> <strong>Creek</strong> <strong>Watershed</strong>.Section 3: Recommendations Page 28
Flooding has been a persistent issue in <strong>Henderson</strong> <strong>County</strong>, especially within the <strong>Mud</strong> <strong>Creek</strong>watershed. Wide fertile floodplains that once served to store flood waters were drained anddiked to allow farming. Commercial and residential development has occurred in the floodplain,as well leaving it susceptible to flooding. <strong>Mud</strong> <strong>Creek</strong> and its tributaries with wide floodplainswere very sinuous streams, often lined by wetlands. Unfortunately, most of these wetlands nolonger function as floodwater storage areas.Figure 3.3: Flooding at <strong>Henderson</strong>ville’sSouthside, just one of many areas of chronicflooding exacerbated by floodplaindevelopment and impervious cover.The <strong>Mud</strong> <strong>Creek</strong> watershed is rapidly developing and changing from a rural watershed to anurban landscape. Since 1990, the population of <strong>Henderson</strong> <strong>County</strong> has grown over 28 percentand is one of the fastest growing counties in North Carolina. Population growth is projected at45 percent over the next twenty years with the fastest growth in the county occurring in the <strong>Mud</strong><strong>Creek</strong> watershed (CCP Demographics, 2002). Many local governments have adoptedstormwater controls, floodplain restrictions and buffer protection policies as shown by Table 3.1.However, future development will further degrade water quality unless more direct actions aretaken to minimize the stormwater runoff from new development and mitigate the impacts ofstormwater runoff from existing development. Preventing further stream degradation fromfuture development should be the highest priority for all local governments and landowners,followed by addressing current impacts from existing impervious surfaces.Table 3.1: Existing Stormwater Management Ordinances in the <strong>Mud</strong> <strong>Creek</strong> watershed.FloodplainRestrictionsStormwaterControlsBufferProtection<strong>Henderson</strong>ville X X X<strong>Henderson</strong> <strong>County</strong>XFlat Rock X X XLaurel ParkSection 3: Recommendations Page 29
Local governments in <strong>Henderson</strong> <strong>County</strong> including <strong>Henderson</strong>ville, Flat Rock and Laurel Park,are subject to requirements of the National Pollutant Discharge Elimination System (NPDES)Phase II Stormwater Program. Phase II of the NPDES stormwater program requires smallmunicipal separate storm sewer systems (MS4s) to obtain an NPDES permit. A small MS4 is acity, town, county, association or other public body that owns or operates a stormwater collectionsystem. Regulated small MS4s automatically designated by the Environmental ProtectionAgency must apply for a permit by March 2003 and are required to develop and implement acomprehensive stormwater management program that includes 6 minimum measures:1) Public education and outreach on stormwater impacts.2) Public involvement/participation.3) Illicit discharge detection and elimination.4) Construction site stormwater runoff control.5) Post-construction stormwater management for new development and redevelopment.6) Pollution prevention/good housekeeping for municipal operations.Although the Phase II requirements will help to address many of the water quality problemsassociated with stormwater in urban areas, they are unlikely to solve the stormwater velocity andvolume problems in watersheds such as <strong>Mud</strong> <strong>Creek</strong> that already have a high percentage ofimpervious cover. The following ordinance revisions recommended by the <strong>Mud</strong> <strong>Creek</strong><strong>Watershed</strong> <strong>Restoration</strong> Council are consistent with the Phase II requirement for controlling postconstructionrunoff; however, in some cases, the changes recommended by the Council exceedthe requirements of the Phase II program. To truly address the stormwater problem, localgovernments in the <strong>Mud</strong> <strong>Creek</strong> watershed will need to think beyond compliance with the PhaseII stormwater program and take proactive steps to minimize impervious cover and controlstormwater from new developments, redevelopments, and to retrofit old developments.3.1.2 Strategies to minimize impacts of stormwater runoff from future developmentLocal governments in the <strong>Mud</strong> <strong>Creek</strong> watershed should consider minimizing futurestormwater impacts by developing and/or refining existing stormwater managementordinances and floodplain development ordinances.The <strong>Mud</strong> <strong>Creek</strong> Council studied existing stormwater ordinances in light of the Phase IIrequirements for local governments in the <strong>Mud</strong> <strong>Creek</strong> watershed and determined that thefollowing modifications would help these governments achieve maximum stormwater reductionsfrom new development:All local stormwater ordinances should specify maintenance requirements for structuralstormwater Best Management Practices (BMPs). Ordinances should also specify that designpractices that reduce impervious cover and maintain stream-side areas in natural vegetationand floodplain or use vegetated swales to convey stormwater are preferred to structuralpractices for stormwater control.All local governments in the <strong>Mud</strong> <strong>Creek</strong> watershed should implement inspection programs toensure compliance with stormwater ordinances, including proper installation andmaintenance of structural BMPs.Section 3: Recommendations Page 30
Flat Rock: Consider extending post-construction runoff rate controls to subdivisions inaddition to the standards established for other types of developments, including non-majorcommercial development. Flat Rock should also amend their buffer ordinance to requirediffuse flow through buffers.Laurel Park: Consider developing local ordinances that address stormwater impacts from alltypes of development, including development that occurs outside of designated water supplywatersheds. Laurel Park should also consider developing an ordinance to prohibit or limitdevelopment of floodplains.<strong>Henderson</strong> <strong>County</strong>: Consider developing a stormwater ordinance to address commercialdevelopment and revising existing stormwater ordinances to ensure that the post-constructionrunoff rate not exceed predevelopment runoff rate. <strong>Henderson</strong> <strong>County</strong> should also considerdeveloping a floodplain protection ordinance to limit development within floodplains.To minimize post-construction run-off, local ordinances could state that post-development runoffrates shall not exceed predevelopment runoff rates. Alternatively, local ordinances could have acertain threshold for compliance (i.e. particular percent impervious cover), at which timecontrols would be required so that the post runoff rate does not exceed the predevelopmentrunoff rate. This option could be implemented via the review of building permits or zoningpermits so that local staff would calculate the percent of impervious cover in the watershed anddetermine if the threshold value for protecting water quality had been exceeded. The localgovernments could raise fees for building/zoning permits to cover staff costs for plan review andpost-construction site inspections.Local governments should provide incentives to local residents to minimize existing andfuture stormwater impacts by reducing stormwater runoff. In addition to regulatoryprograms for stormwater management, local governments could implement an incentive basedprogram for controlling stormwater runoff from future and existing development. Incentivescould include tax breaks and regulatory flexibility, such as modified density requirements, fornew development. Under this approach, landowners could benefit from lower taxes on theirproperty for protecting stream buffers, constructing stormwater wetlands, limiting the amount ofimpervious cover, or routing roof runoff to infiltration areas. <strong>Henderson</strong> <strong>County</strong> currentlyassesses agricultural property at a lower value and could modify the existing assessment processto allow a similar structure for conservation and water quality end-uses. Current zoningordinances could be revised to allow developers who protect floodplain areas or limit imperviouscover in floodplain areas to construct higher density developments.Local governments in the <strong>Mud</strong> <strong>Creek</strong> watershed should review existing developmentordinances and building codes for opportunities to minimize impervious surfaces. Theseopportunities may include reduced parking requirements, more versatility in the types of materialused for parking lots (could allow porous pavement for occasional use areas, especially in areaswith soils that infiltrate quickly), narrower street widths in residential areas, eliminating curbs, orreducing the footprint of buildings. Local governments should also review existing landscapingand open space requirements in order to see how those areas can be used to manage runoff.Modifications to local ordinances may help local governments achieve compliance with Phase IISection 3: Recommendations Page 31
stormwater requirements for pollution prevention and post-construction stormwatermanagement.Local governments in the <strong>Mud</strong> <strong>Creek</strong> watershed should educate businesses and citizensabout stormwater management issues and actions they can take to reduce these impacts.Contractors and Developers: Require licensed contractors/developers to attend workshopsabout environmental/conservation site design. These workshops could focus on “Elements ofGood Design” (e.g., roof runoff routed to yard, setback from stream, porous driveways,narrower streets). Local governments could also provide a BMP design manual, specific tothe mountains, stressing the preference for non-structural BMPs such as forested setbacksand vegetated swales, minimization of impervious surfaces, and site design for topographicconstraints. The local governments should obtain assistance from the NC State UniversitySchool of Design, NCSU Biological and Agricultural Engineering, or the <strong>Center</strong> for<strong>Watershed</strong> Protection in designing requirements, providing classes and developing the BMPmanual. Grant funds may be available through the Clean Water Management Trust Fund, theEPA 319 Program, or through a 205(j) Grant to develop these materials. The program couldalso be subsidized through fees collected from workshop participants. Local governmentscould work through a regional organization such as the Land of Sky Regional Council toadminister this program across a multi-county area. As an incentive, local governmentscould expedite building permits for workshop participants or building permit applicantsincorporating good design principles into their development plans. These workshops wouldalso help local governments meet Phase II stormwater requirements for publiceducation/outreach.Citizens: Distribute brochures developed by the State for Phase II compliance regardingthings landowners and buyers can do to limit impervious surfaces, manage stormwater andminimize water quality toxicity via landscape application of chemicals. Local governmentscan provide brochures to local realtors, real estate attorneys, bank loan departments, andhealth departments for general public distribution. Local governments can also attach thebrochure to local building-related permit applications, home loan applications, closingmaterials and septic tank permit applications. Local governments can get Phase IIcompliance credit for public education/outreach for distributing these brochures.3.1.3 Strategies to reduce impacts of stormwater runoff from existing developmentLocal governments in the <strong>Mud</strong> <strong>Creek</strong> watershed and surrounding watersheds shouldconsider establishing a stormwater utility to fund improvements to existing stormwatercollection system. The federal Phase II Stormwater Regulation is an unfunded mandate foraffected local governments. In addition, there is a need for increased funding to improvestormwater drainage infrastructure and stormwater management programs at the local level.Many local governments across the state (Charlotte, Durham, Greensboro, Cumberland <strong>County</strong>)have established stormwater utilities to manage and fund their local stormwater programs.Stormwater utilities typically charge user fees based on the amount of impervious surfacecontained on a given property since impervious surface area has an effect on the volume ofstormwater runoff created by that property. The assessed value of the property used in theproperty tax calculations is not necessarily a good indicator of the contribution of runoff.Stormwater user fees represent a more equitable means of generating revenue for stormwaterSection 3: Recommendations Page 32
management improvements. Residential stormwater fees are typically $2 to $3 per single-familyresidence per month and are collected through the water billing process.Local governments in the <strong>Mud</strong> <strong>Creek</strong> watershed should map existing stormwater collectionsystems to identify illicit connections and develop a strategy for redirecting thesedischarges to proper wastewater treatment facilities. The City of <strong>Henderson</strong>ville has hired anengineering consultant to map its stormwater collection system. Although this is a costlyproposal, local governments subject to Phase II will be required to do this work and thisinformation is critical to identifying opportunities for system expansion, upgrades and for waterquality monitoring.Local governments should seek grant funds to implement a Stormwater BMP RetrofitProgram to identify opportunities to reduce stormwater impacts from existingdevelopment. There are many structural stormwater management techniques for capturing andtreating stormwater. Selecting the appropriate location for these measures is critical and oftenchallenging. Before local governments can begin to address this problem, they will need toestablish the goals for the retrofit program as this will help to determine which techniques aremost suitable. In the <strong>Mud</strong> <strong>Creek</strong> watershed, many streams in the urbanized areas show signs ofstress from high velocity flows related to stormwater runoff. One goal for stormwater retrofitscould be to reduce the velocity of stormwater flows and the resulting streambed scour andstreambank erosion. Another goal could be to reduce the occurrence of flooding in<strong>Henderson</strong>ville by increasing stormwater retention through wetland restoration or structuralBMPs. Subwatersheds with the greatest percentage of impervious cover, currently experiencingrecurrent flooding or showing signs of water quality impairment due to stormwater pollutantsshould be given priority for stormwater retrofits.Given the technical expertise required to conduct a stormwater retrofit study, local governmentsshould seek grant funds through the Clean Water Management Trust Fund or 319 Program tohire an engineering consultant for this analysis. It may be possible to combine stormwaterprojects with other ongoing projects including the future Apple Country Greenway projects andthe Southside Development Initiative.Local governments in the <strong>Mud</strong> <strong>Creek</strong> watershed should seek grant funds to promotepollution prevention and stormwater management by implementing BMPs on governmentowned facilities including motor fleet maintenance areas, parks, and other suitable sites.These projects would not only help to address the stormwater problems in the <strong>Mud</strong> <strong>Creek</strong>watershed, but would also function as demonstration projects that the local governments coulduse to educate local businesses about stormwater management practices. There may be grantfunds available through the Section 319 Program or the Clean Water Management Trust Fund tofund innovative stormwater projects. Local governments should conduct a comprehensiveassessment of their facilities to determine if these facilities are sources of pollutants or if on-sitestormwater retrofits or controls are possible.Local governments should encourage local businesses to implement stormwater BMPretrofits by creating an award program to cite local businesses’ accomplishments. A“<strong>Watershed</strong> Steward” award would not only provide local business with great public relationsbenefits, but would also help to address stormwater and nonpoint source pollution problems inthe <strong>Mud</strong> <strong>Creek</strong> watershed. Awards could be distributed for facilities that demonstrate the bestSection 3: Recommendations Page 33
approach to stormwater management. Awards could be given by business categories includingService Stations, Home Building/Construction, Manufacturing, Retail Complex and Golf Course.The Local Governments could work with the Chamber of Commerce or another localorganization such as the Partners for Economic Progress to administer the awards.The Local Governments could also establish a similar program to encourage individualhomeowners to implement stormwater BMP retrofits. The local governments could provide abrochure of information specific to homeowners outlining possible retrofits, such as redirectingroof and gutter runoff to yards, cisterns or rain gardens. Local government staff or a specialvolunteer committee could run the award program.Section 3: Recommendations Page 34
3.2 Agricultural Non Point Source Pollution3.2.1 OverviewAgricultural production is a major land use in the <strong>Mud</strong> <strong>Creek</strong> watershed, especially in the fertilefloodplains of <strong>Mud</strong> <strong>Creek</strong>, Clear <strong>Creek</strong> and Devils Fork (Figure 3.4). Approximately 23 percentof the <strong>Mud</strong> <strong>Creek</strong> watershed is used for cropland and pasture. In an effort to maximizeproduction, property owners have cleared much of the land, sometimes leaving a thin strip oftrees adjacent to the streams. In the absence of a forested buffer, pollutants including sediment,pesticides and nutrients can move directly from the land to the streams. In some areas whereforested buffers do exist, there are breaks to allow runoff from fields and orchards to draindirectly to streams.Water quality monitoring conducted by WARP suggests that the biological communities in manystreams draining agricultural areas of the watershed are impacted by pesticide runoff fromadjacent orchards and row crops most notably in the upper <strong>Mud</strong> <strong>Creek</strong>, Clear <strong>Creek</strong> and DevilsFork subwatersheds (NC Division of Water Quality, 2003).Figure 3.4: Agricultural land uses inthe <strong>Mud</strong> <strong>Creek</strong> <strong>Watershed</strong>.Section 3: Recommendations Page 35
In addition, fecal bacteria from cattle and horses that have direct access to streams can alsopollute streams. The IPSI study identified 87 beef cattle operations in the <strong>Mud</strong> <strong>Creek</strong> watershed;54% of those operations were adjacent to streams. Most of these operations are fairly small andnot subject to North Carolina waste management permitting requirements. According to theIPSI, cattle have actual or probable (stream in an active pasture but no exclusion fence observed)access to 11.2 miles of stream (Figure 3.6). Cattle with direct access to streams can alsodestabilize streambanks increasing the likelihood for streambank erosion and increased sedimentdelivery to streams.Figure 3.5: Cattle with directaccess to <strong>Mud</strong> <strong>Creek</strong> tributary.Although a large portion of the <strong>Mud</strong> <strong>Creek</strong>watershed is transitioning from a primarilyforested and agricultural landscape to amore urbanized setting, agriculture sourceof pollution such as pesticides and soilerosion must be addressed to improve waterquality.Figure 3.6: Cattle access points to streamsin the <strong>Mud</strong> <strong>Creek</strong> <strong>Watershed</strong>.Section 3: Recommendations Page 36
3.2.2 Strategies to Control Agricultural Nonpoint Source PollutionThe <strong>Henderson</strong> Soil and Water Conservation District (SWCD) and Cooperative Extensionshould continue to promote innovative pest management practices in the <strong>Mud</strong> <strong>Creek</strong>watershed to reduce the amount of pesticides applied in the watershed and to reduce thelikelihood for pesticides to enter streams. There are a number of best management practices(BMPs) currently approved by the Agriculture Cost Share Program to achieve this goal.Through Ag Cost Share, farmers can receive 75% of the cost for implementing the BMPs.Unfortunately, <strong>Henderson</strong> <strong>County</strong> only receives between $75,000-$100,000 per year from the AgCost Share Program which is not enough to address the current need for agriculture BMPs in the<strong>County</strong>. The <strong>County</strong> will need to investigate other funding sources such as a Clean WaterManagement Trust Fund grant or other federal grant programs to fully implement this strategy.AgriChemical Mixing Facilities: Many farmers currently mix pesticides next to streams.The SWCD can work with apple farmers in the Clear <strong>Creek</strong> and Devils Fork watershedsto replace pesticide mixing areas along the streams with state of the art AgriChemicalmixing facilities located above the floodplain. There are already about 20 AgriChemicalMixing Facilities in the <strong>Mud</strong> <strong>Creek</strong> watershed. The first priority is to address thoseclosest to streams or upstream from streams with documented water quality impairmentdue to pesticides.Agrichemical Mixing Facilities are a fairly expensive BMP to implement costing $20,000per facility and <strong>Henderson</strong> <strong>County</strong> can currently only fund 2-3 of these facilities per yearusing Ag Cost Share funds. Many farmers are currently on the waiting list to implementthis BMP, but due to bad apple crops are waiting to implement this practice until theapple market improves. To expedite the implementation of this BMP in the watershed,the <strong>County</strong> should seek a grant to fund 10 Agrichemical Mixing Facilities per year for thenext four years. The grant should also provide greater than 75% cost share to reduce thefinancial barrier for those farmers currently on the waiting list but hesitant to implementthis BMP due to poor apple crops. In addition to apple growers, tomato and pepperfarmers also need agrichemical mixing facilities. Since there are many small tomato andpepper fields in the watershed, a less expensive system should be developed for thesefarmers. Ideally this system should be located away from the stream and capture spilledchemicals. The <strong>Henderson</strong> <strong>County</strong> Cooperative Extension should work through NC StateUniversity to develop such a practice.Integrated Pest Management (IPM): Many apple farmers in the <strong>Mud</strong> <strong>Creek</strong> watershedcurrently use scouts to monitor the need for pesticide application. The scouts set traps todetermine when insects pose a risk to the apple crop. By applying pesticides only whenrecommended by the scouts rather than on a predetermined schedule, farmers use 30%less pesticides saving them money and reducing the likelihood for pesticides to runoffinto streams. This practice costs approximately $30/acre and is approved for Ag CostShare Funds. There are approximately 4,000 acres of orchards in the <strong>Mud</strong> <strong>Creek</strong>watershed and currently 40% of these use IPM to reduce pesticide applications. It wouldcost $120,000 per year to ensure that all orchards in the <strong>Mud</strong> <strong>Creek</strong> watershed use IPM toreduce pesticide use.Section 3: Recommendations Page 37
Backflow prevention for irrigation systems: Many farmers inject fertilizers or pesticidesinto their irrigation system to distribute chemicals across their fields. Unless the dosingpumps, which control the amount of chemicals injected into the irrigation system, arefitted with a backflow prevention device, the chemicals can backwash into the streamswhen the pumps are turned off. A back flow prevention device costs approximately$1000-$3000 depending on the farmers irrigation system. Farmers applying pesticidesthrough an irrigation system that pumps water directly from a stream should be requiredto install one of these devices. Until the State requires this practice, the <strong>County</strong> shouldcontinue to fund this practice through the Ag Cost Share Program.Removal of abandoned apple orchards: Although <strong>Henderson</strong> <strong>County</strong> has a long applegrowing tradition; many growers are abandoning their orchards for more profitableventures. Abandoned orchards are a breeding ground for pests that can migrate toadjacent orchards requiring growers to apply more pesticides. By removing abandonedorchards, the <strong>County</strong> can remove a potential source of insects thereby reducing theamount of pesticides applied to viable orchards. This practices costs $400/acre. Thereare approximately 1,000 acres of abandoned orchards in the <strong>Mud</strong> <strong>Creek</strong> watershed.<strong>Henderson</strong> <strong>County</strong> should work with landowners to voluntarily remove all abandonedorchards by 2005 and then remove newly abandoned orchards within 1 year ofabandonment.<strong>Henderson</strong> Soil and Water Conservation District (District) and <strong>Henderson</strong> <strong>County</strong>Cooperative Extension should develop new Agriculture Cost Share Practices to minimizepesticide drift and reduce pesticide use. The District is a leader in developing Ag Cost SharePractices to address pesticide management. The District should explore new technologies, suchas charged sprayers, that growers can use to reduce pesticide drift. The District should alsoencourage the use of riparian buffers along streams bordering apple orchards to help addresswater quality impacts from the arial drift of pesticides and promote organic apple farming as away to eliminate the risk of water quality degradation from pesticide contamination. Farmersmay need both technical and financial assistance to transition to organic methods. It takes threeyears to meet organic farming standards and during that time the District may need to provideincentive payments to growers through the Ag Cost Share Program.Cooperative Extensionshould assist with this effort by hosting a symposium on pesticide drift management targeted atissues specific to the apple industry.The <strong>Henderson</strong> Soil and Water Conservation District should work with landowners tostabilize streams near orchards to minimize the transport of historic pesticides. The TVAIPSI data indicate that there are over 30,000 feet of eroding streambanks adjacent to active andabandoned orchards concentrated in the Clear <strong>Creek</strong>, Lewis Fork, <strong>Henderson</strong> <strong>Creek</strong> and DevilsFork watersheds. Although there is funding available through the Ag Cost Share Program andthe Environmental Quality Incentives Program (EQIP) to stabilize streambanks, this practice isnot in great demand. Landowners need an incentive to participate. As an incentive, the <strong>County</strong>could pay 100% of the cost for this work if the landowners abandon their orchards and stabilizethe streambanks at the same time. The <strong>County</strong> should seek a grant for $100,000 to cover the25% cost share requirement traditionally paid by the landowners to stabilize 10,000 feet of theeroding banks adjacent to active and abandoned orchards.Section 3: Recommendations Page 38
The <strong>Henderson</strong> <strong>County</strong> Soil and Water Conservation District (District) should work withlandowners to implement effective riparian buffers and conventional conservationpractices such as cover crops, no till, field borders, filter strips, on crop land. The TVAIPSI data indicate that there are over 2000 acres of land (
3.3 Habitat Degradation3.3.1 OverviewOne of the major causes of water quality impairment in the <strong>Mud</strong> <strong>Creek</strong> watershed, as determinedby the recently completed WARP watershed assessment, is habitat degradation. Habitatdegradation, as defined by the Division of Water Quality, is the loss of habitat needed bymacroinvertebrates and fish to survive and reproduce in a stream. Habitat degradation caninclude sedimentation, lack of riparian vegetation, loss of riffles or pools and loss of woody andleaf habitat. The habitat surveys conducted as part of the WARP watershed assessment indicatethat channelization, sedimentation, minimal riparian vegetation, and streambank erosion andstreambed scour resulting from high volumes of stormwater runoff are all causes of habitatdegradation in the <strong>Mud</strong> <strong>Creek</strong> watershed.The TVA IPSI data indicate that 33 percent of the streams in the <strong>Mud</strong> <strong>Creek</strong> watershed arechannelized, approximately 14 percent of the streambanks are severely eroding, and less than11% percent of the larger streams in the watershed have adequate riparian buffers. Fieldassessments conducted by DWQ suggest that these estimates may be conservative due to thelimitations of determining these stream features, especially eroding streambanks, from aerialphotographs.Figure 3.7: Eroding streambanks cause sediment to fillstream channels impacting aquatic habitat.Section 3: Recommendations Page 40
3.3.2 Strategies to Address Habitat DegradationImproving habitat for macroinvertebrates is not an explicit goal of the <strong>Mud</strong> <strong>Creek</strong> watershed<strong>Restoration</strong> Council. However, the Division of Water Quality uses benthic organisms as anindicator of stream health, and the Council recognizes that it must address this issue to improvethe use support ratings currently assigned to the <strong>Mud</strong> <strong>Creek</strong> watershed. For this reason, theCouncil recommends the following strategies to address this problem:The North Carolina Wetlands <strong>Restoration</strong> Program (NCWRP) should work withlandowners and local governments to restore 15,000 feet of the most critically erodingstreams in the <strong>Mud</strong> <strong>Creek</strong> watershed to improve habitat and water quality. Full-scalestream restoration is an expensive undertaking (approximately $125/foot in a rural setting and$200/foot in an urban setting) and should be reserved for the most critical stream instabilityproblems. Generally, projects should be longer than 1,500 feet to achieve economies of scale.The purpose of stream restoration is to restore the natural pattern (the stream meanders),dimension (the width of the channel, height of the banks and floodplain, angle of the banks) andprofile (riffles and pools) of the stream using natural channel design techniques. All streamrestoration designs are based on a stable reference stream to ensure the long-term success of theproject.There are many benefits to implementing stream restoration projects. The projects will stabilizethe streambanks reducing a significant source of sediment in the <strong>Mud</strong> <strong>Creek</strong> watershed. Theprojects will restore the natural riffle and pool sequence to the stream-- improving habitat formacroinvertebrates and fish. The projects will also restore the natural vegetation along thestreambanks and flood plain to keep the banks from eroding, to shade the stream and keep it coolfor fish and to provide a source of woody debris for instream habitat.The NCWRP has selected the <strong>Mud</strong> <strong>Creek</strong> watershed as a high priority area for streamrestoration. The NCWRP intends to implement over 15,000 feet of stream restoration in thewatershed and will work with the Council to identify sites that are consistent with the <strong>Mud</strong> <strong>Creek</strong><strong>Watershed</strong> <strong>Restoration</strong> <strong>Plan</strong>. Although funding is available to complete these projects, theNCWRP will need to identify good projects and willing landowners on both sides of the stream.Using the IPSI data and WARP habitat assessments, the NCWRP will identify and pursueprojects in those subwatershed determined as most in need of stream restoration to improvewater quality and address habitat degradation. To delineate those areas, the NCWRP willconsider subwatersheds with severely eroding streambanks, incised channels, channelizedstreams and inadequate riparian buffers. In addition, those areas identified through WARP fieldassessment as high priority areas for stream restoration will receive priority for funding. TheWARP study recommended stream and riparian restoration for Upper <strong>Mud</strong> <strong>Creek</strong> and Bat Fork.In addition, the study also recommended floodplain acquistion and enhancement in the urbanareas of <strong>Mud</strong> <strong>Creek</strong>, lower Devils Fork and Johnson Drainage Ditch. The NCWRP proposes toidentify stream restoration projects in the high priority subwatersheds by May 2003. TheNCWRP will present the proposed project sites to the <strong>Mud</strong> <strong>Creek</strong> Council to ensure that theprojects are consistent with the Council’s goals for the watershed.In addition to identifying good restoration projects, the NCWRP must also identify landownerswilling to participate in the restoration projects. Many landowners participate in a streamrestoration project because they lack the resources to address their severe erosion problemsSection 3: Recommendations Page 41
themselves and are losing valuable pasture land or crop land as their streams widen and theunstable banks erode – “lose it now or lose it later”. In other cases, structures on the propertymay be at risk due to eroding streambanks. Some landowners may want to improve theaesthetics of their stream or improve wildlife habitat for long-term enjoyment of their property.Landowners must convey a permanentconservation easement on any projectfunded by the NCWRP. Generally, theeasement extends between 25-50 ft fromthe top of the stream banks on both sidesof the stream. The landowner can donatethe easement or NCWRP can purchase theeasement. If the easement is donated, thelandowner may be eligible for a tax creditin addition to other site improvements suchas cattle exclusion and watering systems.Figure 3.8: Site of NCWRP’s Clear <strong>Creek</strong>Stream <strong>Restoration</strong> Project.The NCWRP recognizes that landownerparticipation is a critical component of asuccessful stream restoration project. TheNCWRP is currently implementing astream restoration project in the <strong>Mud</strong><strong>Creek</strong> watershed on Clear <strong>Creek</strong>. TheNCWRP hopes these projects will providelocal landowners with a betterunderstanding of stream restoration. Oncepotential projects sites are identified, theNCWRP will contact landowners todetermine their interest in streamrestoration.Local governments should work with landowners to restore native woody vegetation alongstreams to stabilize streambanks and improve habitat. Full-scale stream restoration is notalways a cost-effective solution to addressing site-specific streambank erosion problems. Inmany cases, these site specific problems can be managed by stabilizing streambanks withvegetation to reduce sedimentation. Buffer restoration costs on average $650-900 per acre andthere are a number of programs in place such as EQIP and Ag Cost Share that provide funding tohelp landowners address this problem. These programs are administered by the <strong>Henderson</strong> Soiland Water Conservation District and the NC Cooperative Extension Service.The IPSI data indicate that over 11% of all riparian buffers of perennial streams in the <strong>Mud</strong><strong>Creek</strong> watershed are inadequate. As is the case with stream restoration projects, there is muchneed for buffer restoration, but little landowner interest to implement this best managementpractice. Local governments will need to identify private landowners interested in bufferrestoration through outreach efforts that could include workshops or newsletter articles.Implementing a buffer restoration project in a city or county park in conjunction with thevolunteer group might also help to bring this issue to the public’s attention.Section 3: Recommendations Page 42
The <strong>Mud</strong> <strong>Creek</strong> <strong>Watershed</strong> <strong>Restoration</strong> Council should educate landowners about theimportance of riparian buffers for streambank stabilization, water quality and habitat.Changing public perception about riparian buffers is a critical objective for the <strong>Mud</strong> <strong>Creek</strong><strong>Watershed</strong> <strong>Restoration</strong> Council. To accomplish this goal, the Council needs to identify keytarget groups including golf courses, farmers, local government maintenance workers,cemeteries, utilities, and homeowners groups and develop a communications strategy for theseaudiences. Outreach materials might include a Powerpoint presentation, website, or factsheet.Local governments should evaluate the benefits of a buffer ordinance to protect landsadjacent to streams from future development activities. In <strong>Henderson</strong> <strong>County</strong>, like manyareas across the state, efforts to protect riparian buffers through both local ordinances and stateregulations have generated both strong public support and criticism. Although the policy issuessurrounding riparian buffers are contentious, the importance of riparian buffers to promoting andprotecting aquatic habitat is well documented. The <strong>Mud</strong> <strong>Creek</strong> <strong>Watershed</strong> <strong>Restoration</strong> Councilrecognizes the importance of riparian buffers to watershed protection and supports acomprehensive approach to riparian buffer management that includes voluntary approaches aswell as regulatory approaches-- if that is what is necessary to improve the quality and function ofriparian buffers in the watershed. The feasibility study will assist decisions-makers and <strong>Mud</strong><strong>Creek</strong> stakeholders in delineating the costs and benefits of regulatory measures to protectriparian buffers and allow the community to engage in a meaningful and fact-based dialogue onthis issue. To accomplish this objective, the feasibility study should address the followingquestions:• What is the current land use in proposed buffer areas?• What is the potential economic impact of this rule?• What are the potential environmental benefits?Local governments in the <strong>Mud</strong> <strong>Creek</strong> watershed should work with the Carolina MountainLand Conservancy and the Apple Country Greenway Commission to permanently protecthigh priority wetlands and riparian buffers in the watershed. Although many streams,riparian areas and upland areas in the <strong>Mud</strong> <strong>Creek</strong> watershed have been degraded by developmentand agriculture, there are still many high quality streams and wetland areas worthy of long-termprotection. The Natural Heritage Program has identified a number of Significant NaturalHeritage Areas in the <strong>Mud</strong> <strong>Creek</strong> watershed including Oklawaha Bog, Bat Fork Bog, King <strong>Creek</strong>Bog, Pinnacle Mountain, Glassy Mountain and Bead and Lace Falls. Many areas of theheadwaters of the <strong>Mud</strong> <strong>Creek</strong> watershed remain forested and undeveloped. The CarolinaMountain Land Conservancy can work with landowners in the <strong>Mud</strong> <strong>Creek</strong> watershed to protectthese areas by negotiating permanent conservation easements and fee simple acquisition on theseproperties. The Clean Water Management Trust Fund and the Natural Heritage Trust Fund aretwo potential sources of funding for this purpose. The state also offers Conservation Tax Creditsto encourage landowners to donate conservation easements to land trusts and state programs.The Carolina Mountain Land Conservancy has already identified four priority areas forprotection in the <strong>Mud</strong> <strong>Creek</strong> watershed. These areas are described in Section 2.6.6.Section 3: Recommendations Page 43
3.4 Upland Sources of Sedimentation3.4.1 OverviewSediment pollution from construction activities, unpaved roads, forestry, mining, and landdevelopment is a significant water quality problem in the <strong>Mud</strong> <strong>Creek</strong> watershed. Sedimentpollution impacts stream habitat by smothering benthic organisms and filling fish spawningareas. Phosphorus, metals, pesticides and other pollutants readily adsorb to sediment particlesand are carried into streams from upland sources during storm events. Sediment can also fillfarm ponds and lakes, reducing storage capacity. Many farmers pump water directly fromstreams to irrigate crops; suspended sediment can clog water filters and ruin water pumps,increasing costs to farmers.In 1973, the state adopted the NC Sedimentation Pollution Control Act to control erosion andsedimentation from road building and development activities. Agriculture and forestry activitiesare exempt from this act; however, forestry operations are required to meet performancestandards and implement best management practices to control sediment pollution. WARP andVWIN data for the <strong>Mud</strong> <strong>Creek</strong> watershed indicate excess sedimentation in areas downstreamfrom land disturbed for development. This suggests that existing regulations designed tominimize sediment pollution from are inadequate to protect water quality.In the <strong>Mud</strong> <strong>Creek</strong> watershed, home and road development, established home sites with erodingslopes, unpaved roads and driveways, dam failure, and eroding road banks are potential sourcesof sediment pollution. The TVA IPSI sediment loading model, which estimates the amount ofsediment pollution from various land uses in the watershed, suggests that residentialdevelopment (which includes residential properties under construction) and unpaved roadsaccount for over half of the upland sources of sediment pollution in the <strong>Mud</strong> <strong>Creek</strong> watershed(Figure 3.9).Although sediment loads should be considered in determining which strategies will be mosteffective in reducing sediment pollution, the loading rate should also be considered. As shownin Table 3.2, residential development may account for the greatest sediment loads in thewatershed, but the loading per acre is much greater from construction sites and eroding roads.Management strategies to address sediment pollution should target not only the greatest sources,but also the sources with the greatest loading rates.Figure 3.9: Runoff froma gravel driveway in the<strong>Mud</strong> <strong>Creek</strong> watershedSection 3: Recommendations Page 44
Figure 3.10: Percent contribution of total annual sedimentload from upland sources in the <strong>Mud</strong> <strong>Creek</strong> watershed.Eroding Roads18%Clear-Cut, Mining,Disturbed Areas2%Shrub, Scrub, Forest4%Residential43%Agriculture10%Commercial20% Industrial1%Transportation,ElectricalTransmission2%Table 3.2: Estimated sediment loading rates in tons/acre/year for land uses in the <strong>Mud</strong> <strong>Creek</strong>watershed.Land UseLoading Rate(Tons/Acre)Land UseLoading Rate(Tons/Acre)ResidentialCropland• High Density 5.1 • High Residue 1.9• Low Density 8.1 • Low Residue 5.4• Under Construction 105.5 PastureCommercial • Good 0.1• High Impervious 4.5 • Heavily Overgrazed 12.4• Low Impervious 2.2 Orchards 0.6• Under Construction 173.1 Forest 0.2Industrial 7.1 Clearcut 2.4Transportation 17.6 Mining 13.6Electric Transmission 10.6 Disturbed Area 131.8Section 3: Recommendations Page 45
3.4.2 Strategies to Address Upland Sources of SedimentationAddressing upland sources of sediment pollution requires a comprehensive approach to target thegreatest potential sources of sediment pollution. The <strong>Mud</strong> <strong>Creek</strong> <strong>Watershed</strong> Councilrecommends the following strategies to reduce the impact of upland sources of sedimentpollution on water quality and habitat.Local governments should consider the benefits of a local Sediment and Erosion ControlProgram to oversee local development activities. Controlling sediment pollution fromconstruction activities must be a major component of any plan to address sediment pollution inan urbanizing watershed like <strong>Mud</strong> <strong>Creek</strong>. As shown in Table 3.1, the sediment loading rate forresidential construction sites is up to 20 times greater than the loading rate from existingdevelopment. Although the acreage of construction sites may be small relative to the acreage ofexisting development, there is a tremendous potential for these sites to contribute great quantitiesof sediment pollution to streams during storm events. WARP staff noted excess sedimentation inareas downstream from land disturbed for development. Local governments in the <strong>Mud</strong> <strong>Creek</strong>watershed should consider adopting their own local programs because the existing StateSediment and Erosion Control (S&EC) regulations are inadequate to address the uniqueenvironment of Western North Carolina. The Act does not adequately address the numeroussmall building sites (less than one disturbed acre) on steep slopes that collectively contributelarge sums of sediment into county streams.Since 1996, the number of building permits issued for new residential units in <strong>Henderson</strong> <strong>County</strong>has steadily increased (Figure 3.11). Although not all of these units are located in the <strong>Mud</strong><strong>Creek</strong> watershed, this area is one of the fastest growing regions of the <strong>County</strong>. The State’sSediment and Erosion Control Program, operated by the Division of Land Quality, currently hasonly one inspector assigned to <strong>Henderson</strong> <strong>County</strong>. This person must review and enforce between60-80 sediment and erosion control plans each year. Most of the larger developers andcontractors operating in <strong>Henderson</strong> <strong>County</strong> are familiar with the state’s S&EC requirements andcompliance is generally acceptable. However, developers of many smaller sites, which fallbelow the state’s one acre threshold for oversight, do not properly install best managementpractices to minimize sediment pollution. It is possible they are unaware of the requirementsaltogether. A local S&EC program could focus more time on smaller development sites – thesites that may pose the greatest risk to water quality.1000Figure 3.11: Number of building permits issued for newresidential units in <strong>Henderson</strong> <strong>County</strong> 1996-2002New Residential Units9008007006005001996 1997 1998 1999 2000 2001 2002YearSection 3: Recommendations Page 46
Increasing development in the <strong>Mud</strong> <strong>Creek</strong> watershed, especially in the steeper hilltops areas, willonly exacerbate the problem of sedimentation unless actions are taken to educate developersabout the importance of sediment and erosion control practices and provide increased oversightof construction activities. Local governments can build on their existing permitting andinspections program and adopt program requirements that address local concerns. For example,they could require developers to attend a pre-construction erosion control planning meeting as acondition of securing a building permit, revegetate bare earth within 15 working days and useinfiltration galleries for development on steep slopes to reduce runoff velocities. Building codeenforcement staff could withhold the Certificate of Occupancy until the developer establishespost construction vegetation – one of the most important practices for controlling sedimentpollution from a disturbed area. Local governments can encourage neighbors to watch out forviolations, especially following storm events and can train building inspectors to reportviolations to the local Erosion Control officers.Many local governments across the state have adopted local sedimentation and erosion controlordinances and administer local oversight programs. In western North Carolina, Avery,Buncombe, Haywood, Jackson, Macon and Swain counties, as well as the City of Asheville, allhave local sediment and erosion control programs. A local program has the benefits of betteraccess for developers to technical assistance, quicker plan reviews and permits, more frequentinspections, better follow-up on citizen complaints and more stringent or tailored rules specific tothat area’s unique environmental concerns. Most local governments fund their programs throughpermit fees collected for plan review. Fees are generally based on the size of the project, butcould also be structured as an incentive to minimize land disturbance in highly sensitive areassuch as steep slopes or areas with highly erodible soils.Local governments should educate excavators and the public about how to control erosion.The NC Division of Land Resources (DLR) provides a number of training programs to educatecontractors, students and the public about sediment pollution. The Clear Water ContractorsProgram is designed specifically for operators and contractors conducting earth moving activitieson a daily basis. The DLR also offers seminars to familiarize design professionals who developerosion and sedimentation control plans with erosion and sedimentation control principles andpractices. To increase local access to and participation in these programs, local governmentsshould co-sponsor these events with the DLR to ensure that these programs are offered atconvenient times and locations for local land development professionals.The DLR also offers programs to educate students about erosion and sediment pollutionincluding classroom and special event presentations. The DLR has also developed the ErosionPatrol curriculum for 3rd grade students and sponsors the “<strong>Mud</strong>dy Water” essay contest for highschool students. In addition to these state sponsored education programs, many local nonprofitorganizations including the Haywood Waterways Association, Western North CarolinaTomorrow and the Upper Broad River <strong>Watershed</strong> Protection Program have developedinformative brochures addressing sediment pollution. Local governments should modify theseprograms as needed to address local sediment pollution concerns including sediment pollutionfrom unpaved roads and eroding roadbanks and construction activities on steep slopes.Local governments should seek grant funds to develop a brochure outlining local sedimentationand erosion control issues. The <strong>County</strong> should distribute these brochures to health and buildinginspection departments, realtors, and other businesses working with development professionals.Section 3: Recommendations Page 47
The <strong>Mud</strong> <strong>Creek</strong> <strong>Watershed</strong> <strong>Restoration</strong> Council should develop a slide presentation that it candeliver at meetings of realtors, homebuilders, civic clubs and other interested groups. The<strong>County</strong> should also consider offering an award to “green graders” and “green developers” forfirms that demonstrate exceptional sediment and erosion control practices.Local governments should work with the Department of Transportation, municipalities,and property owner associations to reduce the sediment pollution from unpaved roads,eroding road banks, and roadside ditches. According to the TVA IPSI, there are over 1000miles of roads in the <strong>Mud</strong> <strong>Creek</strong> watershed and 34% (272 miles) of these roads are unpaved.Many of these unpaved roads are directly adjacent to streams or cross over streams and provide adirect pathway for sediment pollution to enter streams during storm events. To address thisproblem, local governments should prioritize unpaved roads in the <strong>Mud</strong> <strong>Creek</strong> watershed todetermine which roads pose the greatest risk to water quality and encourage DOT to pave theseroads. Proximity to water, slope, and length are all factors that should be considered indetermining which roads pose the greatest potential threat to water quality.In addition to unpaved roads, eroding road banks are also a significant source of sedimentpollution. TVA IPSI estimates that 15% of road banks along unpaved roads are erodingcompared to only 3.5% of road banks along paved roads. Eroding road banks often result fromroads cut into steep slopes. Local governments should work with DOT to vegetate and maintaineroding shoulders, ditches, and side slopes. Where needed, DOT should also install and maintainsediment catch basins to reduce sediment runoff from roads and eroding road banks. To reducesediment pollution from future roads, local governments should adopt more stringent designstandards for unpaved roads requiring builders to pave all roads over 15% grade and within 25feet of a water body.Section 3: Recommendations Page 48
SECTION 4: NEXT STEPS4.1 Present <strong>Watershed</strong> <strong>Restoration</strong> <strong>Plan</strong> to the CommunityThe Council’s first task is to present the <strong>Watershed</strong> <strong>Restoration</strong> <strong>Plan</strong>’s findings andrecommendations to the community by updating the project fact sheet and conductingpresentations to community groups. These actions will increase public awareness of the keywatershed issues and recommended strategies and develop support and partnerships for theimplementation of strategies.4.2 Formalize <strong>Watershed</strong> CouncilThe <strong>Mud</strong> <strong>Creek</strong> <strong>Watershed</strong> <strong>Restoration</strong> Council was formed in the Spring of 2000 to study thewatershed and develop this watershed management strategy. Council members include localgovernment officials from the three municipalities and <strong>Henderson</strong> county, state and federalagency officials and business, environmental and community group representatives. Now thatthe planning phase of the project is complete, the Council may wish to reorganize to implementthe plan. This may include establishing a more formal structure (assigned positions) and seekingformal appointments from the appropriate stakeholder groups. One option is to establish theCouncil as a formal advisory committee to the <strong>Henderson</strong> <strong>County</strong> Commission.4.3 Hire <strong>Watershed</strong> CoordinatorThe Council has secured funds from the Tennessee Valley Authority and additional funds areexpected from the NC Division of Water Quality to hire a full-time <strong>Mud</strong> <strong>Creek</strong> <strong>Watershed</strong>Coordinator. This Coordinator will staff the Council, coordinate with all stakeholders andagency partners, conduct public educational activities, work with willing landowners on waterquality initiatives and assist local governments in the watershed with water quality managementissues and projects as requested. Initial funding will support the position for up to two years.The Coordinator will need to seek additional funding for personnel and project costs throughgrants and donations. Possible funding sources include the NC Clean Water Management TrustFund, Federal Clean Water Act Section 319 Program, NC Wetland <strong>Restoration</strong> Program, privatefoundations corporations and many other potential sources.4.4 Prioritize RecommendationsThis management plan includes many recommended strategies. The Council should examineeach strategy in more detail, seek input from various interest groups and watershed citizens andprioritize the strategies for both short and long term implementation. One consideration is theavailability of funding to implement projects.4.5 Set Measurable <strong>Watershed</strong> Improvement GoalsThe Council should set measurable goals to track progress under the implementation phase anddelineate timelines, potential implementers and funding sources for each strategy.Section 4: Next Steps Page 49
4.6 Secure Grants to Implement ProjectsSome strategies can be implemented with little or not additional funding, however, others willrequires grants and other outside sources of funding. The Coordinator will be responsible forpreparing grant applications or assisting other organizations as appropriate in securing funds.Section 4: Next Steps Page 50
REFERENCES<strong>Center</strong> for <strong>Watershed</strong> Protection. 2001. <strong>Watershed</strong> Vulnerability Analysis. Technical Release.CCP Demographics. 2002. <strong>Henderson</strong> <strong>County</strong> 2000 and Projected 2020 Population Density byTownship.<strong>Henderson</strong> <strong>County</strong> Inspection Department. Activity Reports 1996-2002.Mass, Richard P., S.C. Patch, M.J. Westphal, E.A. Cook, C.C. Maurer and C.J. Walker. 2000.Water Quality in the Mountains: <strong>Henderson</strong> <strong>County</strong> Volunteer Water Information Network YearSeven Report.NC Division of Water Quality. 2003. Biological Impairment in the <strong>Mud</strong> <strong>Creek</strong> <strong>Watershed</strong>.NC Division of Water Quality. 2000. French Broad River Basinwide Water Quality <strong>Plan</strong>.Tennessee Valley Authority. 2001. <strong>Mud</strong> <strong>Creek</strong> <strong>Watershed</strong> Nonpoint Source Pollution Inventoryand Pollution Estimates.References Page 51
APPENDIX A<strong>Mud</strong> <strong>Creek</strong> <strong>Watershed</strong> <strong>Restoration</strong> CouncilActive Members as of December 2002Fred Niehoff – City of <strong>Henderson</strong>ville MayorMary Jo Padgett – City of <strong>Henderson</strong>ville Mayor Pro Tem and ECOMike Egan – City of <strong>Henderson</strong>ville AttorneyRenee Kumor – Riverlink ChairmanDick Jones – Laurel Park Town CommissionerJudy Boleman – Flat Rock Town CouncilwomanGrady Hawkins – <strong>Henderson</strong> <strong>County</strong> CommissionerDon Ward – <strong>Henderson</strong> <strong>County</strong> CommissionerNippy Page – <strong>Henderson</strong> <strong>County</strong> <strong>Plan</strong>ning DepartmentJosh Freeman – <strong>Henderson</strong> <strong>County</strong> <strong>Plan</strong>ning DepartmentFielding Lucas – <strong>Henderson</strong> Co. Environmental Advisory CommitteeLarry Rogers – Partners for Economic ProgressBob Williford – <strong>Henderson</strong>ville Chamber of CommerceGus Campano – Glade HoldingsStan Summerfield/Rob Marcotte – Kimberly ClarkStephanie Pursley – <strong>Henderson</strong>ville Board of RealtorsVan Estes – <strong>Henderson</strong>ville Board of RealtorsPaul Taylor, Jr. – Homebuilders of <strong>Henderson</strong>villeRick Merrill – Apple Country Greenway Commission and Designing Our FutureBob Carter – Natural Resources Conservation ServiceTom Burnett – <strong>Henderson</strong> <strong>County</strong> Soil and Water Conservation DistrictJonathan Wallin – <strong>Henderson</strong> Co. SWCDDrew Brannon – <strong>Henderson</strong> Co. SWCD & FarmerCliff Ruth – NCSU - <strong>Henderson</strong> Co. Cooperative Extension ServiceJon Calabria – NCSU French Broad River Training <strong>Center</strong>Marilyn Westphal – UNCA Environmental Quality InstituteBurline Pullin – Tennessee Valley AuthorityKristin Cozza – NC Wetland <strong>Restoration</strong> ProgramAndrea Leslie - NC Division of Water QualityMike McDonald – NC Division of Water QualityLaurie Moorhead – NC Division of Water QualityKieran Roe – Carolina Mountain Land ConservancyReggie Hall – Carolina Mountain Land ConservancyEd Ingle – NC Department of TransportationBill Eaker – Land of Sky Regional CouncilAppendix A: <strong>Mud</strong> <strong>Creek</strong> <strong>Watershed</strong> <strong>Restoration</strong> Council Members Page 52
Technical SubcommitteeAPPENDIX B<strong>Mud</strong> <strong>Creek</strong> <strong>Watershed</strong> Council Accomplishments• Initiated an Integrated Pollution Source Identification (IPSI) project completed by TVAin September 2001) (Appendix B)• Initiated subwatershed windshield surveys• Reviewed DWQ and IPSI dataEducation Subcommittee• Organized a “Know Your <strong>Watershed</strong>” educational program which was held on April 3,2001• Acquired educational watershed maps from TVA to distribute to schools in the watershedby Education Subcommittee members• Submitted notices of Council and educational meetings to various media (radio,newspaper)• Assisted with stream cleanups• Organized initial public educational meetings• Developed a project fact sheet for watershed residents and business owners• (The fact sheet was created as a tool to help introduce and explain the <strong>Mud</strong> <strong>Creek</strong><strong>Watershed</strong> <strong>Restoration</strong> Project to the community).• Organized a week of activities entitled “<strong>Mud</strong> Fest” which resulted in an award from theNC Department of Environment and Natural Resources for the “involvement of electedofficials in an educational plan to promote stream protection and public awareness… forthe mission of conservation”Implementation Subcommittee• Began development of a “toolbox” of technical and financial assistance programsavailable to landowners• Began development of a “kickoff” best management practice (BMP) demonstrationproject• Organized a riparian buffer educational tour for local elected officials and keygovernment staff held on April 27, 2001• Developed draft watershed management strategies for consideration by the full CouncilAppendix B: <strong>Watershed</strong> Council Accomplishments Page 53
Appendix B: <strong>Watershed</strong> Council Accomplishments Page 54