PKF Hotel Market Demand and Financial Analysis - DIA Business ...
PKF Hotel Market Demand and Financial Analysis - DIA Business ...
PKF Hotel Market Demand and Financial Analysis - DIA Business ...

Create successful ePaper yourself
Turn your PDF publications into a flip-book with our unique Google optimized e-Paper software.
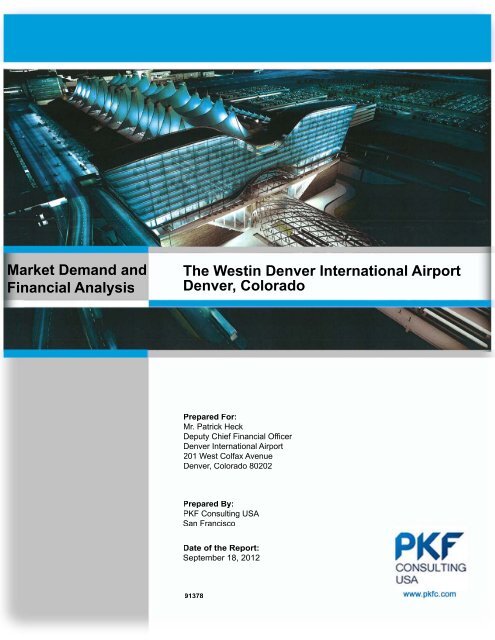
September 18, 2012Mr. Patrick HeckDeputy Chief <strong>Financial</strong> OfficerDenver International Airport201 West Colfax AvenueDenver, Colorado 80202Re: The Westin Denver International Airport – Denver, ColoradoDear Mr. Heck:Pursuant to your request, we have conducted a study of the potential marketdem<strong>and</strong> <strong>and</strong> developed a statement of the estimated annual operating results for aproposed 519-room Westin hotel (the “Subject”) to be located at the south terminalof the Denver International Airport (“<strong>DIA</strong>”) in Denver, Colorado. Throughout thisanalysis, we formally refer to the Subject as The Westin Denver InternationalAirport.The development of the Subject hotel is expected to be financed through theissuance of tax-exempt bonds coupled with some form of publicsubsidies/guarantees/loans. This report has been prepared for use by the DenverInternational Airport <strong>and</strong> its financial advisors in determining the estimated annualoperating results of the proposed Subject. The conclusions set forth in this reportare based on an analysis for supply <strong>and</strong> dem<strong>and</strong> for the transient lodging market inthe Denver-Aurora market area as of August 8, 2012, the completion date of ourfieldwork <strong>and</strong> primary market research.As in all studies of this type, the estimated results assume competent <strong>and</strong> efficientmarketing <strong>and</strong> operational management, <strong>and</strong> presume no significant change in thestatus of the competitive lodging industry from that as set forth in this report. Theterms of this engagement are such that we have no obligation to revise this reportto reflect events or conditions which occur subsequent to the date of completion ofour fieldwork; however, we are available to discuss the necessity for revision inview of changes in the economy or market factors which have a material effect onthe project.Since our projections of the market performance of the hotel are based onestimations <strong>and</strong> assumptions, which are subject to uncertainty <strong>and</strong> variation, we donot represent them as results that will actually be achieved; however, our<strong>PKF</strong> Consulting USA | 50 California Street, 19 th Floor | San Francisco, CA 94111TEL: 415 788 3102 | FAX: 415 433 7844 | www.pkfc.com
The Westin Denver International AirportDenver International Airportprojections have been conscientiously prepared on the basis of informationobtained during the course of this assignment <strong>and</strong> in our capacity as professionalanalysts in both the real estate <strong>and</strong> lodging industries.This report is subject to the Certification <strong>and</strong> Statement of Assumptions <strong>and</strong> LimitingConditions presented in the Addenda. The report is also subject to the followingthree special assumptions.For the purpose of this analysis, we have assumed an opening date ofAugust 1, 2015.We underst<strong>and</strong> that the Subject will be affiliated with <strong>and</strong> operated byStarwood <strong>Hotel</strong>s <strong>and</strong> Resorts. For the purpose of this analysis, we haveprojected management fees in line with those stipulated in the QualifiedManagement Agreement (“QMA”) between the City <strong>and</strong> County ofDenver on behalf of its Department of Aviation <strong>and</strong> Westin <strong>DIA</strong> Operator,LLC.The Subject is a component of a larger $500 million development at <strong>DIA</strong>.Due to the fact that the Subject will be owned by the City <strong>and</strong> County ofDenver <strong>and</strong> <strong>DIA</strong>, there are certain elements of the project that we haveexcluded from our projections of revenues <strong>and</strong> expenses includingparking, property taxes, <strong>and</strong> restaurant lease income. These elementswill be explained in further detail throughout this report.<strong>PKF</strong> Consulting USA (“<strong>PKF</strong> Consulting”) appreciates this opportunity to be ofservice to you. Should you have any questions, or if we can be of furtherassistance, please do not hesitate to contact us.Yours sincerely,<strong>PKF</strong> Consulting USABy: Christopher A. Kraus, MAISenior Vice Presidentchris.kraus@pkfc.com | 406.582.8189- 2 -
The Westin Denver International AirportDenver International AirportBy: Catherine E. BolstadVice Presidentcatherine.bolstad@pkfc.com | 415.288.7834- 3 -
The Westin Denver International AirportTable of ContentsSECTION IEXECUTIVE SUMMARYA. INTRODUCTION ...................................................................................... I- 11. Overview of Study ......................................................................... I- 12. Proposed <strong>Hotel</strong> Financing Structure .............................................. I- 1a. Financing Structure ............................................................. I- 1b. Qualified Management Agreement (QMA).......................... I- 23. Important Dates ............................................................................. I- 24. Development Timeline ................................................................... I- 35. Scope <strong>and</strong> Methodology ................................................................ I- 3B. SUMMARY OF CONCLUSIONS .............................................................. I- 4SECTION IIAREA REVIEWAREA REVIEWA. INTRODUCTION ..................................................................................... II- 1B. AREA REVIEW ....................................................................................... II- 11. State of Colorado .......................................................................... II- 22. Denver Metropolitan Statistical Area ............................................ II- 6C. ECONOMIC AND DEMOGRAPHIC CHARACTERISTICS ..................... II- 61. Introduction ................................................................................... II- 62. Population ..................................................................................... II- 63. Employment .................................................................................. II- 74. Commercial Office <strong>Market</strong> ............................................................ II- 85. Transportation .............................................................................. II- 96. Denver International Airport .......................................................... II-117. Colorado Convention Center ........................................................ II-148. Tourism ......................................................................................... II-15D. AREA SUMMARY ................................................................................... II-16SECTION IIIPROPERTY DESCRIPTIONPROPERTY DESCRIPTIONA. INTRODUCTION .................................................................................... III- 1B. SITE DESCRIPTION .............................................................................. III- 11. Location, Access, <strong>and</strong> Visibility .................................................... III- 1C. PLANNED IMPROVEMENTS DESCRIPTION ....................................... III- 41. Property Description <strong>and</strong> Configuration ....................................... III- 52. Guestrooms ................................................................................. III- 63. Food <strong>and</strong> Beverage ..................................................................... III- 74. Meeting Space ............................................................................. III- 75. Public Areas ................................................................................ III- 86. Parking ........................................................................................ III- 8
The Westin Denver International AirportTable of ContentsD. MANAGEMENT AND AFFILIATION ...................................................... III- 91. Management Agreement ............................................................. III- 9E. DEVELOPMENT COSTS ....................................................................... III- 9F. CONCLUSION ....................................................................................... III- 9SECTION IVHOTEL MARKET ANALYSISHOTEL MARKET ANALYSISA. INTRODUCTION .................................................................................... IV- 1B. NATIONAL MARKET OVERVIEW ......................................................... IV- 1C. DENVER LODGING MARKET ............................................................... IV- 21. Overview ...................................................................................... IV- 22. Historical <strong>and</strong> Projected Performance ......................................... IV- 3D. COMPETITIVE LODGING MARKET ANALYSIS ................................... IV- 51. Competitive Airport Lodging <strong>Market</strong> ............................................. IV- 5a. Historical Performance of the Competitive Airport Lodging<strong>Market</strong> ............................................................................... IV-142. Competitive Downtown Lodging <strong>Market</strong> ...................................... IV-15a. Historical Performance of the Competitive Downtown Lodging<strong>Market</strong> ............................................................................... IV-263. The Combined Historical Performance of the Primary <strong>and</strong> SecondaryCompetitive Lodging <strong>Market</strong> ........................................................ IV-274. Additions to Supply ...................................................................... IV-29E. PROJECTED PERFORMANCE OF THE COMPETITIVE MARKET ...... IV-33F. IN-TERMINAL LODGING MARKET OVERVIEW ................................... IV-341. Historical Performance of the In-Terminal <strong>Hotel</strong>s ........................ IV-36G. PROJECTED PERFORMANCE OF THE PROPOSED SUBJECT ........ IV-371. Occupancy ................................................................................... IV-372. Projected Average Daily Room Rate ........................................... IV-41SECTION VSTATEMENT OF ESTIMATED ANNUAL OPERATING RESULTSSTATEMENT OF ESTIMATED ANNUAL OPERATING RESULTSA. INTRODUCTION ..................................................................................... V- 1B. BASIS FOR CASH FLOW PROJECTIONS ............................................ V- 2C. STABILIZED YEAR ESTIMATE .............................................................. V- 81. Departmental Revenues <strong>and</strong> Expenses ....................................... V- 8a. Rooms Revenue <strong>and</strong> Expense .......................................... V- 8b. Food <strong>and</strong> Beverage Revenue <strong>and</strong> Expense ...................... V- 9c. Other Operated Departments Revenue <strong>and</strong> Expense ....... V-11d. Rentals <strong>and</strong> Other Income ................................................. V-132. Undistributed Operating Expenses ............................................... V-14a. Administrative <strong>and</strong> General ................................................ V-15b. <strong>Market</strong>ing ........................................................................... V-15
The Westin Denver International AirportTable of Contentsc. Property Operations <strong>and</strong> Maintenance .............................. V-16d. Utility Costs ........................................................................ V-173. Management Fees <strong>and</strong> Fixed Charges ........................................ V-18a. Management Fees ............................................................. V-18b. Real Estate <strong>and</strong> Property Taxes ........................................ V-19c. Insurance ........................................................................... V-19d. Reserves for Replacements ............................................... V-20D. STABILIZED YEAR OPERATING RESULTS.......................................... V-22E. ESTIMATED ANNUAL OPERATING RESULTS FOR THE HOLDINGPERIOD .................................................................................................. V-241. Holding Period ........................................................................... V-242. Inflation ...................................................................................... V-243. ADR <strong>and</strong> Occupancy during the Holding Period ........................ V-254. Operating Revenues <strong>and</strong> Expenses during the Holding Period . V-265. Estimated Annual Operating Results during the Holding Period V-26ADDENDAA. CERTIFICATION OF THE CONSULTANTSB. STATEMENT OF ASSUMPTIONS AND LIMITING CONDITIONSC. QUALIFICATIONS OF THE CONSULTANTSD. COPY OF THE ENGAGEMENT LETTERE. SENSITIVITY ANALYSIS
SECTION IEXECUTIVE SUMMARY
The Westin Denver International AirportExecutive SummaryA. INTRODUCTION1. Overview of Study<strong>PKF</strong> Consulting has been retained by the Denver International Airport to conduct astudy of the potential market dem<strong>and</strong> <strong>and</strong> to prepare a ten-year statement of theestimated annual operating results for a proposed 519-room Westin hotel to belocated at the south terminal of the Denver International Airport in Denver,Colorado.2. Proposed <strong>Hotel</strong> Financing StructureThe development of a 519-room Westin hotel is currently underway at the southterminal of the Denver International Airport, a project that is controlled by theDenver International Airport. The hotel project is expected to be funded through anissuance of tax-exempt bonds. Presented in the following paragraphs is a briefdescription of the financing structure <strong>and</strong> a discussion of the Qualified ManagementAgreement (“QMA”).a. Financing StructureThe proposed Subject is currently planned to be funded by a part of Airport SystemsRevenue Bonds Series 2012 A <strong>and</strong> Series 2012 B.b. Qualified Management Agreement (“QMA”)We have been provided with a Qualified Management Agreement dated April 11,2011. The QMA is by <strong>and</strong> between the City <strong>and</strong> County of Denver, Colorado for<strong>and</strong> on behalf of its Department of Aviation, a Colorado municipal corporation (the“Owner”) <strong>and</strong> Westin <strong>DIA</strong> Operator, LLC, a Delaware limited liability companyauthorized to do business in the State of Colorado (“<strong>Hotel</strong> Manager”). The term ofthis agreement is 15 years, commencing on the opening date. The QMA stipulatesa base management fee, subordinate management fee, <strong>and</strong> subordinate reserve forcapital expenditures. A more detailed discussion of these fees is presented inSections III <strong>and</strong> V of this report.3. Important DatesThis analysis has been prepared based on the assumption that the proposed hotelwill be completed <strong>and</strong> open for business on August 1, 2015. Christopher A. Kraus,MAI, <strong>and</strong> Catherine E. Bolstad have inspected the Subject site on numerousoccasions in conjunction with this assignment, as well as previous assignmentscompleted for the <strong>DIA</strong> for this project in 2009, 2010, <strong>and</strong> 2011. Our fieldwork forthis particular assignment was conducted in July 2012 <strong>and</strong> this report was written inJuly <strong>and</strong> August 2012.I-2
The Westin Denver International AirportExecutive Summary4. Development TimelineThe proposed Subject is projected to open <strong>and</strong> be available for occupancy onAugust 1, 2015. Presented below is a development timeline for the overall projectprovided to us by Piper Jaffray.5. Scope <strong>and</strong> MethodologyIn conducting the study, we:Inspected the proposed Subject site <strong>and</strong> assessed the characteristics of the siteon factors such as accessibility, visibility, <strong>and</strong> location relative to dem<strong>and</strong>generators on the marketability, <strong>and</strong> likely market mix of the project;Researched <strong>and</strong> analyzed current economic <strong>and</strong> demographic trends in thegreater Denver MSA to determine the impact on future lodging dem<strong>and</strong> in themarket;I-3
The Westin Denver International AirportExecutive SummaryIdentified the competitive lodging supply located in the local market area <strong>and</strong>interviewed managers of many of these competitive hotels. We also reviewedthe historical performance levels for each of the hotels in the identifiedcompetitive supply;Estimated the anticipated growth in dem<strong>and</strong> for, <strong>and</strong> supply of, lodgingaccommodations in the competitive market area;Prepared a ten-year forecast of future lodging dem<strong>and</strong>, market segmentation<strong>and</strong> occupancy rate for the identified competitive market;Developed a forecast of the likely occupancy levels <strong>and</strong> average daily roomrates (“ADR”) the Subject could reasonably achieve over its first ten years ofoperation (2015 to 2024); <strong>and</strong>,Developed a statement of estimated annual operating results of revenues,expenses, <strong>and</strong> the net operating income before the deduction of interest,amortization, <strong>and</strong> depreciation for the first ten years of operation for theproposed Subject. We based our analysis upon our review of the financialoperating performance of six comparable in-terminal hotels located throughoutNorth America, five comparable Westin hotels located throughout the U.S., <strong>and</strong>on our own general knowledge of the operating performance of upper upscale,full-service hotels in the Denver region.Several sources were used in compiling the background information <strong>and</strong> preparingthe analyses contained in this report. These resources included Trends in the <strong>Hotel</strong>Industry, published by <strong>PKF</strong> Consulting USA; <strong>Hotel</strong> Horizons®, published by <strong>PKF</strong>Hospitality Research; data on the local lodging market gathered through directinterviews with managers of the competitive properties; data provided by sources inthe lodging chains with which competitive properties are affiliated; <strong>and</strong>, economicdata on the region from various local governmental <strong>and</strong> planning entities.B. SUMMARY OF CONCLUSIONSBased on the work program outlined above, we have developed an estimate of thepotential future operating performance of the proposed 519-room Westin. Theresults of our research <strong>and</strong> analyses are summarized in the following statements. The Denver MSA has experienced expansion in many sectors <strong>and</strong> continuesto attract commercial business. Economic indicators such as population <strong>and</strong>employment growth, commercial office space absorption, <strong>and</strong> increasedairport passenger traffic all reflect the steady growth of the Denver MSA.Despite the recent economic downturn, Denver continues to benefit from itsdesignation as the hub for the U.S., <strong>and</strong> <strong>DIA</strong> currently receives one of theI-4
The Westin Denver International AirportExecutive Summaryhighest levels of passenger volume across airports nationwide, which isanticipated to benefit the proposed Subject in the future. The proposed Subject will benefit from its affiliation with Starwood <strong>Hotel</strong>s <strong>and</strong>Resorts as an upper upscale Westin hotel. The proposed Subject willrepresent the only full-service Starwood hotel in the Denver InternationalAirport lodging market.The hotels that form the overall identified competitive market achievedoccupancy levels in the low 60s to low 70s from 2007 to 2011. Growth inaverage daily room rate (ADR) of 5.5 percent was achieved in 2008 beforeADR declined 10.8 percent in 2009 as a result of the economic downturn. In2010 <strong>and</strong> 2011, the competitive market achieved ADR growth of 4.2 percentper annum. <strong>Dem<strong>and</strong></strong> increased through YTD June 2012 while ADRremained relatively unchanged. Presented in the following table is thehistorical <strong>and</strong> projected performance of the identified competitive market.Competitive <strong>Hotel</strong> <strong>Market</strong>Historical <strong>and</strong> Projected Growth in Supply <strong>and</strong><strong>Dem<strong>and</strong></strong>2012 to 2019YearTotalSupply 1Total<strong>Dem<strong>and</strong></strong> 2<strong>Market</strong>Occupancy2007 1,794,340 1,263,201 70%2008 1,868,070 1,313,504 70%2009 1,892,525 1,210,102 64%2010 1,948,735 1,351,501 69%2011 2,161,165 1,535,193 71%2012 2,161,165 1,564,300 72%2013 2,161,165 1,556,100 72%2014 2,245,480 1,571,900 70%2015 2,324,320 1,627,100 70%2016 2,434,915 1,704,400 70%2017 2,434,915 1,704,500 70%2018 2,434,915 1,704,500 70%2019 2,434,915 1,704,400 70%CAGR 1.7% 1.2% -Note: CAGR (Compound Annual Growth Rate 2012 to2019)1 Total Supply equals annual room nights available2 Total dem<strong>and</strong> equals annual room nights occupiedSource: <strong>PKF</strong> Consulting USA The Subject will be positioned as an upper upscale hotel that will caterprimarily to the transient <strong>and</strong> group market segments. Specifically, weI-5
The Westin Denver International AirportExecutive Summaryestimate the Subject will have a market mix comprised of 60 percenttransient dem<strong>and</strong>, 30 percent group dem<strong>and</strong>, <strong>and</strong> 10 percent contract/crewdem<strong>and</strong>. The proposed Subject is estimated to achieve above its fair share of marketdem<strong>and</strong> beginning in the second full year of operation. We estimate that theWestin will achieve a stabilized occupancy of 74 percent in the third full yearof operation with an average rate of $180 expressed in 2012 value dollars.The following table reflects the estimated occupancy, market penetration,<strong>and</strong> average daily rate (“ADR”) for the Subject’s first five years of operationbeginning August 1, 2015.Estimated Occupancy, <strong>Market</strong> Penetration, <strong>and</strong> ADRCalendar Years 2015 to 2019Year Occupancy<strong>Market</strong>Penetration ADR2015¹ 68% 94% $2092016 72% 100% $2242017 74% 106% $2312018 74% 106% $2382019 74% 106% $245¹ 2015 represents a stub year beginning August 1, 2015 <strong>and</strong>ending December 31, 2015Source: <strong>PKF</strong> Consulting USABased on the projected occupancy <strong>and</strong> ADR for the proposed Subject, <strong>and</strong>our estimates of other operating revenues <strong>and</strong> expenses, we have projectedthe net operating income for the proposed Westin for a ten-year holdingperiod beginning August 1, 2015. The following table summarizes theresults of our analysis.I-6
The Westin Denver International AirportExecutive SummarySummary of Estimated Annual Operating ResultsTotal Net Operating Ratio toYear Revenue Income 1 Total Revenues2015² $16,495,000 $5,839,000 35.4%2016 44,367,000 17,314,000 39.0%2017 47,008,000 17,997,000 38.3%2018 48,427,000 17,178,000 35.5%2019 49,860,000 17,046,000 34.2%2020 51,307,000 16,485,000 32.1%2021 52,909,000 16,503,000 31.2%2022 54,523,000 17,022,000 31.2%2023 56,154,000 16,972,000 30.2%2024 57,799,000 17,447,000 30.2%1 Income before the deduction of depreciation, interest,amortization, <strong>and</strong> income taxes, but after the deduction of areserve for capital replacement, a subordinate management fee,<strong>and</strong> a subordinate reserve for capital expenditures. This incomeexcludes the deduction of property taxes.² 2015 represents a stub year beginning August 1, 2015 <strong>and</strong>ending December 31, 2015I-7
SECTION IIAREA AND NEIGHBORHOOD REVIEW
The Westin Denver International AirportArea ReviewA. INTRODUCTIONFor the financial feasibility <strong>and</strong> analysis of a hotel <strong>and</strong> related developments, theprojected earnings stream is often influenced by factors that can be broadlycategorized as economic, governmental, social, <strong>and</strong> environmental. It is, therefore,necessary to evaluate the dynamics of these factors within a market to underst<strong>and</strong>their effect on the financial feasibility of such projects.The proposed Westin will be located at the south terminal of the DenverInternational Airport. Presented in the following paragraphs is a brief discussion ofeconomic <strong>and</strong> social factors affecting the Subject.B. AREA REVIEWIn analyzing the Subject, it is necessary to underst<strong>and</strong> the current state of the U.S.economy. The United States fell into the worst recession since the 1930s beginningin December 2007. The downturn was exacerbated by the financial crisis that tookhold of markets in September 2008. The U.S. economy was essentially in declineuntil approximately August 2009 when experts claim that the recession likely ended.Over this period, employers eliminated approximately eight million jobs, the largestdrop in any post-World War II economic downturn. Credit was largely unavailableas banks worldwide recorded approximately $1.6 trillion of losses <strong>and</strong> write-downssince the start of 2007.Following the official end of the recession in August 2009, U.S. Gross DomesticProfit (“GDP”) posted an annually adjusted gain of approximately 3.8 percent in thefourth quarter of 2009; however, the annual GDP declined by (3.5) percent for all of2009. The real GDP then increased by an annualized rate of 3.0 percent in 2010.However, with the unexpected slowdown in the economy, GDP increased by onlyan annualized gain of 1.8 percent in 2011. According to Moody’s Analytics, GDP isforecast to increase by 2.6 percent in 2012 <strong>and</strong> by 3.3 percent in 2013.The unemployment rate for the U.S. rose to 8.2 percent in June 2012 unchangedfrom the prior month, due in part to weak national job growth. Unemployment levelsabove eight percent remain an area of concern for the recovery of the U.S.economy.An additional area of significant concern is the federal government’s fiscal policy.The federal deficit has increased from approximately $459 billion in 2008 to $1.3trillion in fiscal year 2011. With this looming deficit, much of the focus inWashington is centered on the balance between increasing revenues by raisingtaxes <strong>and</strong> cutting costs by reducing the size <strong>and</strong> cost of government <strong>and</strong> entitlementprograms such as Social Security <strong>and</strong> Medicare. In early August 2011, last-minutelegislation was signed into law by the President to raise the debt ceiling <strong>and</strong> reducethe Federal deficit. However, as a result of the political turmoil surrounding thisII-1
The Westin Denver International AirportArea Reviewdecision <strong>and</strong> ongoing fiscal concern for the U.S., St<strong>and</strong>ard <strong>and</strong> Poor’s (“S&P”)downgraded their AAA+ credit rating for the U.S. to AA+ resulting in escalating fearsof the U.S. slipping back into recession <strong>and</strong> negatively impacting the global financialmarkets.Coinciding with the sluggish recovery of the U.S. economy are the growingconcerns over the “Euro Zone” as the countries of Greece, Spain, <strong>and</strong> Italy strugglewith significant debt crises. As of the date of this report, many professionaleconomists are concerned about the threat of a second global slowdown.It should be noted that global economic forecasting is beyond the scope of thisassignment. While there are numerous factors, both economic <strong>and</strong> geopolitical,that could continue to stall a global <strong>and</strong> national recovery or further induce a doubledip recession, for the purpose of this analysis we have assumed that countriesaround the world will take the necessary steps to avoid a second recession, <strong>and</strong>have therefore based our analysis on an ongoing gradual recovery of the nationaleconomy over the forecast period.In addition to underst<strong>and</strong>ing the issues affecting the U.S. economy, it is alsonecessary to review the dynamics of the local market. Presented in the followingparagraphs is a brief overview of the local socio-economic factors directly orindirectly impacting the performance of the proposed Subject.1. State of ColoradoColorado is the eighth largest State in the U.S. with a total l<strong>and</strong> area ofapproximately 104,485 square miles. The State encompasses most of theSouthern Rocky Mountains, the northeastern portion of the Colorado Plateau, <strong>and</strong>the western edge of the Great Plains. It is nicknamed the “Centennial State”because it was admitted to the Union as the 38th state in 1876, the centennial yearof the United States Declaration of Independence. Colorado is bordered to thenorth by Wyoming <strong>and</strong> Nebraska, to the east by Nebraska <strong>and</strong> Kansas, to the southby Oklahoma <strong>and</strong> New Mexico, <strong>and</strong> to the West by Utah. The states of Colorado,New Mexico, Arizona, <strong>and</strong> Utah meet at one common point known as the FourCorners. Colorado is one of only three states with no natural borders.Colorado is well known for its vivid l<strong>and</strong>scape of mountains, plains, mesas, <strong>and</strong>canyons. The 30 highest major summits of the Rocky Mountains all lay within theState. Colorado is home to numerous national parks, forests, monuments,recreation areas, <strong>and</strong> wilderness/ wildlife refuge <strong>and</strong> conservation areas.With regard to population, Colorado is ranked 22nd in the United States. As of2010, the state population of Colorado was approximately 5,029,000, a 16.9 percentincrease since 2000. Approximately 60 percent of the state population resides inthe Denver-Aurora-Boulder Combined Statistical Area. In 2010, the median incomeof residents in Colorado from 2006-2010 was $56,456.II-2
The Westin Denver International AirportArea ReviewAgriculture, mining, <strong>and</strong> related support businesses are the backbone of Colorado’seconomy. Currently cattle, wheat, dairy products, corn <strong>and</strong> hay are the state’slargest crops. However, Denver, the State Capitol of Colorado, is a rapidly growingCity. Denver is the State’s economic hub <strong>and</strong> benefits from its central locationwithin the U.S. <strong>and</strong> has become a strategic location for federal, high-tech,commercial, financial, telecom, cultural, tourist <strong>and</strong> distribution services. Morerecently, dem<strong>and</strong> for clean energy is helping spur growth in the State. Thisdevelopment <strong>and</strong> growth of clean energy companies in Colorado will increaseColorado’s economic diversity, which will ultimately strengthen the State’s economygoing forward.We have presented two maps indicating the location of the Subject site in relation tothe surrounding region <strong>and</strong> local area on the following two pages.II-3
The Westin Denver International AirportArea ReviewRegional MapII-4
The Westin Denver International AirportArea ReviewLocal MapII-5
The Westin Denver International AirportArea ReviewPresented in the following text is a more detailed discussion of the Denver-Auroraarea.2. Denver Metropolitan Statistical Area (MSA)The Denver MSA is comprised of the seven counties of Adams, Arapahoe, Denver,Broomfield, Douglas, Jefferson, <strong>and</strong> Boulder. Denver, Boulder <strong>and</strong> Longmont are themajor cities within the Denver MSA. As Denver has grown in recent years, moreeconomic activity has spilled over into the adjoining Boulder submarket.Denver is famous for its somewhat mild climate, extraordinary sightseeingopportunities, <strong>and</strong> performing arts orientation. The economy of Denver is wellbalanced, with strong representation by industries related to retail <strong>and</strong> wholesaletrade, financial services, <strong>and</strong> tourism. The technology sector of Denver is growing,<strong>and</strong> manufacturers of electronic <strong>and</strong> aerospace items are located in this region.Denver is continually listed in surveys <strong>and</strong> studies as one of the premier cities inwhich to conduct business. Denver has earned a place high on Fortune Magazine’slist of “Best Cities for <strong>Business</strong>.” With a central location, good infrastructure, <strong>and</strong> anexcellent airport, Denver provides excellent access to both national <strong>and</strong>international markets. Mining once drove Denver’s economy; now, due to Denver’sstrong pro-business climate, highly educated workforce, <strong>and</strong> a relatively low cost ofliving, business has diversified into telecommunications, aerospace, biomedical,<strong>and</strong> other high tech sectors. In addition, Denver enjoys over 300 days of sunshineannually, adding to the attraction of the City overall.C. ECONOMIC AND DEMOGRAPHIC CHARACTERISTICS1. IntroductionTo assess the environment <strong>and</strong> economic <strong>and</strong> demographic factors in which theproposed Subject will operate, data was gathered from a number of differentsources including various city <strong>and</strong> county agencies, as well as sources within theprivate sector. <strong>Analysis</strong> of this data provides a mean of measuring the economicclimate in which the Subject functions. In the assessment of the general economicclimate for a hotel to be located within the Denver International Airport lodgingmarket, <strong>and</strong> specifically an in-terminal hotel, particular emphasis was placed on keyindicators such as population, airport passenger volume, office space absorption,employment, <strong>and</strong> miscellaneous new developments.2. PopulationAccording to the U.S. Census Bureau, the City of Denver had a 2010 population ofapproximately 600,200 residents, representing an 8.2 percent increase over the2000 year level. Denver is most populous city within a 500-mile radius <strong>and</strong> is theII-6
The Westin Denver International AirportArea Reviewsecond largest city in the Mountain West <strong>and</strong> Southwest regions (after Phoenix). Itis the 26 th most populous U.S. city <strong>and</strong> has a density of 3,979 persons per squaremile.3. EmploymentDue to Denver’s central location <strong>and</strong> large size, it has become a primary site for thedistribution of goods <strong>and</strong> services to the Mountain, Southwest, <strong>and</strong> Western States.Furthermore, several major companies have strong ties to the Denver area.Companies headquartered in Denver include Apartment Investment ManagementCompany, the largest owner <strong>and</strong> operator of apartment communities in the country;MapQuest, an online map resource; <strong>and</strong> Molson Coors Brewing Company.Companies which began operations in Denver include Big O Tires, Russell StoverC<strong>and</strong>ies, Inc, the luggage manufacturer Samsonite Corporation, <strong>and</strong> the jewelrychain The Shane Company. Presented below is a list of the top 20 employers inDenver as of year-end 2011.Major Employers in DenverEmployer Industry EmployeesU.S. Government Government 36,878State of Colorado Government 33,476University of Colorado System Education 15,205Denver Public Schools Education 13,587City & County of Denver Government 12,000HealthONE Corporation Healthcare 9,640CenturyLink Telecommunications 7,380Exempla Healthcare Healthcare 7,320Lockheed Martin Corporation Aerospace & Defense 7,220Centura Health Healthcare 6.370Kaiser Permanente Healthcare 5,870Denver Health Healthcare 5,331Adams 12 Five Star Schools Education 5,160Aurora Public Schools Education 5,000DISH Network Telecommunications 4,690United Airlines Transportation 4,310Wells Fargo Bank <strong>Financial</strong> Services 4,400Boulder Valley School District Education 4,335University of Denver Education 4,310Source: Metro DenverGiven Denver’s designation as state capitol, the U.S. Government represents thelargest employer in Denver. The State of Colorado is the second largest employer.Presented in the following chart are the historical <strong>and</strong> projected employmentstatistics for the Denver MSA.II-7
The Westin Denver International AirportArea ReviewDenver MSA Employment Statistics200000010.0%18000008.7% 9.0%9.0% 8.7%8.3%8.6%9.0%16000007.5%7.8%8.0%7.0%14000005.8%1,277,2276.0%12000005.0%1,186,9005.0%4.6% 4.4%3.7%10000003.9%4.3%8.5% 8.4% 0.0%4.0%3.0%8000002.0%6000001.0%400000EmploymentUnemployment RateSource: Moody’s AnalyticsAs noted, prior to the Great Recession, which occurred between December 2007<strong>and</strong> August 2009, the Denver MSA experienced unemployment rates in the high 3.0percent to mid-4.0 percent range. Since then, unemployment rates have fluctuatedbetween the high 7.0 percent range <strong>and</strong> 9.0 percent. In the second quarter 2012,the unemployment rate was 8.1 percent with an employment base of approximately1,240,500. Unemployment is projected to remain in the mid-8.0 percent rangethrough the fourth quarter of 2013.As of June 2012, Denver had an unemployment rate of 8.2 percent, up 0.1 percentin May 2012. As a point of comparison, the State of Colorado <strong>and</strong> the U.S. alsoindicated an unemployment rate of 8.2 percent during this same time.4. Commercial Office <strong>Market</strong>According to the <strong>Market</strong>View Report – Denver Office Second Quarter 2012published by CB Richard Ellis, the Denver office market showed positive signs inthe second quarter 2012. Improvements in vacancy <strong>and</strong> absorption bolstered gainsachieved in the previous quarter. Notable increases in direct asking rates were alsorealized. With a recorded 605,617 square feet of positive net absorption, the overallDenver office market experienced a fifth straight quarter of increase in occupiedspace. The resulting direct vacancy rate was 14.2 percent. The total availabilityrate decreased in the second quarter to 21.4 percent. There is 911,000 square feetII-8
The Westin Denver International AirportArea Reviewof office space currently under construction, most of which is located in theDowntown <strong>and</strong> Northwest submarkets. Lease rates of the local office market haveincreased notably <strong>and</strong> currently average $20.00 per square foot per year.Denver <strong>Market</strong> StatisticsSource: CB Richard EllisThe proposed Subject is located in the Aurora submarket. The Aurora submarkethad a rentable area of 5,878,269 <strong>and</strong> a direct vacancy rate of 19.4 percent as of thesecond quarter 2012. This vacancy rate is approximately five percentage pointsabove the direct vacancy rate of the overall Denver office market. The averageasking lease rate for the Aurora office market was $14.66 per square foot per year.The total vacancy rate was 19.6 percent, above the total vacancy rate for the overallDenver office market.5. TransportationDenver is primarily served by Interstates I-25 <strong>and</strong> I-70. I-70 runs east-west fromUtah to Kansas. I-25 runs north-south from the New Mexico border through Denverto the Wyoming border. I-225 traverses neighboring Aurora <strong>and</strong> connects with I-25in the southeastern corner of Denver. Additionally, I-76 begins from I-70 just westof the City of Arvada. It intersects I-25 north of the City <strong>and</strong> runs northeast toNebraska where it ends at I-80. US Route 6 connects Downtown Denver to thesuburb of Golden.II-9
The Westin Denver International AirportArea ReviewMass transportation throughout the Denver-Aurora metropolitan area is managed<strong>and</strong> coordinated by the Regional Transportation District (“RTD”). RTD currentlyoperates more than 1,000 buses serving 10,000 bus stops in 38 municipaljurisdictions. Additionally, RTD operates two light rail lines (the C Line <strong>and</strong> D Line)with a total of 15.8 miles of track, serving 24 stations.A component of the $500 million <strong>DIA</strong> project is the extension of the RTD FasTracksrail line. The East Rail line is a 22.8-mile commuter rail transit corridor that willoperate between the downtown Denver Union Station <strong>and</strong> <strong>DIA</strong>. In addition toconnecting these two vital areas of the Denver region, the rail line will also serveadjacent employment centers, neighborhoods <strong>and</strong> development areas in Denver<strong>and</strong> Aurora. A map with the East Rail line highlighted in yellow is presented below.The RTD rail line podium will be located on Level 1 of <strong>DIA</strong> <strong>and</strong> the Subject hotel. ItAs a result, riders will have access to the proposed Subject <strong>and</strong> the airport by wayof escalators <strong>and</strong> elevators. This rail line will benefit the proposed Subjecttremendously given the ease of access to the many attractions of downtownDenver, including the convention center, thus providing guests direct access todowntown with the convenience of an airport location.II-10
The Westin Denver International AirportArea Review6. Denver International AirportDomestic <strong>and</strong> international air travel activity within the MSA indicated stability of thetransportation <strong>and</strong> infrastructure of the MSA to bring dem<strong>and</strong> for hotel rooms bycommercial, leisure, <strong>and</strong> convention travelers.The Denver metro area is serviced by <strong>DIA</strong>, which opened on February 28, 1995.The $4.9 billion, 53 square mile facility is now the largest airfield of any US airport<strong>and</strong> is designed to incorporate the latest technology <strong>and</strong> safety. In addition, theairport has developed an accomplished record for on-time performance, safety, <strong>and</strong>convenience. In 2000, the United States Department of Transportation granted$21.5 million to Denver International Airport for construction of a sixth runway. Thepurpose of this runway is to increase the number of international flights that can beaccommodated, as well as ensure that the airport is operating efficiently. In 2011,<strong>DIA</strong> ranked as the 15 th busiest airport worldwide. <strong>DIA</strong> ranked as the fifth busiestairport nationwide in 2010 (the most recent information available).In the table below we have provided airport passenger statistics at the DenverInternational Airport (<strong>DIA</strong>) from 2000 through 2011, as well as year-to-date (YTD)April 2011 <strong>and</strong> 2012.Denver Air Travel TrafficDomestic International PercentageYear Inbound Outbound Subtotal Inbound Outbound Subtotal Total Change2000 18,926,570 18,963,023 37,889,593 432,121 429,973 862,094 38,751,687 -2001 17,626,640 17,634,502 35,261,142 420,057 411,607 831,664 36,092,806 -6.9%2002 17,432,875 17,447,202 34,880,077 389,645 382,362 772,007 35,652,084 -1.2%2003 18,263,806 18,296,014 36,559,820 480,453 464,865 945,318 37,505,138 5.2%2004 20,517,023 20,546,850 41,063,873 614,948 597,092 1,212,040 42,275,913 12.7%2005 20,872,569 20,910,073 41,782,642 812,969 791,902 1,604,871 43,387,513 2.6%2006 22,693,908 22,728,322 45,422,230 967,286 937,036 1,904,322 47,326,552 9.1%2007 23,810,915 23,862,374 47,673,289 1,111,484 1,078,579 2,190,063 49,863,352 5.4%2008 24,485,128 24,560,170 49,045,298 1,109,963 1,090,073 2,200,036 51,245,334 2.8%2009 24,092,818 24,183,236 48,276,054 946,634 944,797 1,891,431 50,167,485 -2.1%2010 24,992,757 25,071,981 50,064,738 967,359 952,941 1,920,300 51,985,038 3.6%2011 25,531,777 25,603,170 51,134,947 861,560 852,625 1,714,185 52,849,132 1.7%CAGR - - 2.8% - - 6.4% 2.9% -YTD 4/11 7,746,506 7,829,542 15,576,048 326,169 319,369 645,538 16,221,586 -YTD 4/12 7,801,265 7,852,346 15,653,611 302,298 304,051 606,349 16,259,960 0.2%Source: Denver International Airport <strong>Business</strong> CenterAs noted, passenger volume has increased to its highest level over this twelve-yearperiod to approximately 52.849 million in 2011. Of this total, internationalenplanements <strong>and</strong> deplanements totaled approximately 1.714 million. Passengervolume increased at a compound annual growth rate of 2.9 percent between 2000II-11
The Westin Denver International AirportArea Review<strong>and</strong> 2011. Through YTD April 2012, passenger volume increase 0.2 percent overprior year levels. The international passenger volume represented approximately3.2 percent of overall passenger volume in 2011. The ratio of international travel todomestic travel was highest between 2006 <strong>and</strong> 2008 <strong>and</strong> is assumed to be partiallyattributable to the weak U.S. dollar during this time.Presented below is a table that summarizes total passengers by airline for year-end2010 <strong>and</strong> 2011. As can be noted, United Airlines (23.67 percent market share),Southwest Airlines (21.17 percent market share), <strong>and</strong> Frontier Airlines (17.83percent market share) held the top three largest market share percentages at <strong>DIA</strong> in2011.II-12
The Westin Denver International AirportArea ReviewSummary of Total Passengers by Airline (2010 <strong>and</strong> 2011)Source: Denver International Airport <strong>Business</strong> CenterII-13
The Westin Denver International AirportArea ReviewPresented in the following table are the projected passenger enplanements at <strong>DIA</strong>from 2012 through 2018.Projected Enplaned Passengers by Airline (Baseline Projections)Airline 2012 2013 2014 2015 2016 2017 2018United Airlines GroupMainline 7,018,000 7,116,000 7,209,000 7,297,000 7,378,000 7,452,000 7,521,000United Express 4,358,000 4,434,000 4,517,000 4,608,000 4,707,000 4,815,000 4,930,000Subtotal 11,376,000 11,550,000 11,726,000 11,905,000 12,085,000 12,267,000 12,451,000Frontier 5,722,000 5,800,000 5,878,000 5,958,000 6,040,000 6,123,000 6,207,000Southwest 5,750,000 5,947,000 6,129,000 6,296,000 6,467,000 6,634,000 6,805,000Other 4,376,000 4,458,000 4,544,000 4,629,000 4,717,000 4,807,000 4,895,000Subtotal 15,848,000 16,205,000 16,551,000 16,883,000 17,224,000 17,564,000 17,907,000Total 27,224,000 27,755,000 28,277,000 28,788,000 29,309,000 29,831,000 30,358,000Source: Denver International AirportTotal passenger enplanements are projected to increase from approximately 27.224million in 2012 to 30.358 million in 2018. The United Airlines Group is estimated toaccommodate approximately 41.0 percent of total passenger enplanements.The proposed Subject is part of a $500 million expansion at <strong>DIA</strong>. An adjunctterminal is being built next to the Jeppesen terminal <strong>and</strong> will house a railway station,to be run by RTD’s FasTracks systems, as stated previously in this section, <strong>and</strong> a519-room hotel (the proposed Subject). The rail link will provide a direct linkagebetween downtown Denver <strong>and</strong> the airport. The hotel component of this project isprojected to be completed in August 2015.One of the biggest advantages <strong>DIA</strong> has over other U.S. international airports is itspotential for expansion. With a significant amount of vacant space surrounding theairport, we underst<strong>and</strong> that there is the potential to build six additional runways aswell as additional gates to the existing <strong>and</strong> new concourses. This potential build-outcan only serve to benefit the proposed Subject immensely as passenger trafficincreases in the coming years <strong>and</strong> decades. Should <strong>DIA</strong> continue to be built out,we underst<strong>and</strong> that the development of additional hotels would be considered toaccommodate an increase in passenger traffic <strong>and</strong> lodging dem<strong>and</strong>.7. Colorado Convention CenterThe $126.3 million Colorado Convention Center was completed in the spring of1990 <strong>and</strong> became a strong influence on the area lodging industry, acting as both amajor generator of room nights downtown <strong>and</strong> room night compression citywide.Currently, the convention center contains a 292,000 square foot exhibit hall, whichfeatures clear span seating for 7,000 people. At street level, the convention centerII-14
The Westin Denver International AirportArea Reviewmaintains 65,000 square feet of meeting space contained in 46 rooms. In addition,the center features 46,250 square feet of registration space. Below the ground flooris a 35,000 square foot sunken ballroom that is divisible <strong>and</strong> features 30-foot ceilingheights.With limited square footage of exhibition space relative to other major urb<strong>and</strong>estinations, the Colorado Convention Center accommodates primarily regionalcorporate <strong>and</strong> association groups. Through year-end 2012, there are 438 definiteevents that have generated approximately 585,000 room nights throughout theDenver area. The City of Denver is a popular destination for groups due to itscentral location within the U.S. For this reason, the proposed Subject withapproximately 29,000 square feet of meeting space is expected to benefit greatlyfrom group traffic that originates from both east <strong>and</strong> west coasts. While theproposed Subject is not anticipated to compete with the downtown market forconventions, it will certainly benefit from compression from the downtown marketwith the ease of commuting via the RTD rail line.8. TourismTourism is a strong component of the Denver MSA economy. Denver is 20 mileseast of the Rocky Mountain region, the gateway to some of the world’s mostrenowned national parks <strong>and</strong> ski resorts, as well as nationally acclaimed sportscenters <strong>and</strong> tourist attractions. Visitors to the Denver area enjoy a wide variety ofentertainment <strong>and</strong> recreational activities. Attractions in Denver include: Six FlagsElitch Gardens Theme Park; Heritage Square; Water World; Colorado’s OceanJourney; the fossils of Dinosaur Ridge; <strong>and</strong>, a network of beer breweries.The Denver Performing Arts Complex is the second largest such center in thenation, after Lincoln Center in New York. Sporting activities, including river running,hiking, <strong>and</strong> mountain biking, are popular among Denver tourists due to the sunnyclimate <strong>and</strong> extensive park system in the area. Denver is also home to professionalsports teams, including the NFL Broncos, NBA Nuggets, major league baseballRockies, <strong>and</strong> the NHL Avalanche. The following table highlights some of the topDenver attractions.II-15
The Westin Denver International AirportArea ReviewTop Denver AttractionsAttractionCherry Creek Shopping Center16th Street MallLoDo Historic DistrictCastle Rock Factory outlets Science/IMAXDenver Zoo MuseumColorado State CapitolPark Meadows Retail ResortFlatirons Crossing MallColorado RockiesCoors BreweryDenver PavilionsDenver Museum of Nature & ScienceRed Rock AmphitheaterBuffalo Bill's GraveLarimer SquareSource: Longwoods ReportLocationDenverDowntown DenverDowntown DenverCastle RockDenverDowntown DenverLittletonBloomfieldDowntown DenverGoldenDowntown DenverDenverMorrisonGoldenDowntown DenverIn addition, Denver has realized significant growth in tourist-related facilities overthe past several years. Most noteworthy is the opening of three new stadiums:76,000-seat Invesco Field at Mile High for the NFL Denver Broncos; 50,000-seatCoors Field for the MLB Colorado Rockies; <strong>and</strong>, 20,000-seat Pepsi Center for theNHL Colorado Avalanche <strong>and</strong> NBA Denver Nuggets. In addition, Ocean Journey, aworld class $93-million aquarium <strong>and</strong> $125 million Six Flags at Elitch Gardendowntown amusement park also represent popular tourist attractions.The lower downtown Denver area, known as “LoDo,” has been completely restored.LoDo is bounded by Larimer Street on the southeast <strong>and</strong> the Central Platte Valleyon the northwest. This area is known for its numerous restaurants, nightclubs, <strong>and</strong>art galleries. Completion of Coors Field in 1995 sparked extensive redevelopment,with warehouses originally constructed in the late-1800s being converted torestaurants, residential lofts, <strong>and</strong> night clubs. Over 40 restaurants have openedsince 1995, mostly near Coors Field revitalizing the downtown area with newresidential projects, retail <strong>and</strong> the aforementioned dining options.D. AREA SUMMARYThe Denver MSA has experienced expansion in many sectors <strong>and</strong> continues toattract commercial business. Economic indicators such as population <strong>and</strong>employment growth, commercial office space absorption, <strong>and</strong> increased airportpassenger traffic all reflect the steady growth of the Denver MSA. Denver isprojected to continue to experience growth going forward, thus benefiting theproposed Subject upon completion.II-16
SECTION IIIPROPERTY DESCRIPTION
The Westin Denver International <strong>Hotel</strong>Property DescriptionA. INTRODUCTIONIn the following section, we have provided a description of the Subject site,immediate neighborhood, <strong>and</strong> proposed improvements of the 519-room Westin.Site plans, floor plans, <strong>and</strong> renderings of the proposed Subject are presentedthroughout this section.B. SITE DESCRIPTION1. Location, Access, <strong>and</strong> VisibilityThe Subject site is located at the south terminal of the Denver International Airport(<strong>DIA</strong>), the area pictured in the photographs below. <strong>DIA</strong> is located in a remote areaof Denver-Aurora, approximately 25 miles from downtown <strong>and</strong> approximately sevenmiles from the closest amenities such as lodging facilities <strong>and</strong> restaurants alongTower Road. <strong>DIA</strong> is surrounded by many acres of vacant airport-owned l<strong>and</strong>, <strong>and</strong>,therefore, has excellent visibility from surrounding thoroughfares.Presented below is an aerial view of the Subject site which is outlined in red. Aneighborhood map is presented below the aerial view.III-2
The Westin Denver International <strong>Hotel</strong>Property DescriptionAerial ViewNeighborhood MapThe Subject site is easily accessible from Interstate 70, which connects toInterstates 270 <strong>and</strong> 25. In western Colorado, Interstate 70 (“I-70”) connects theIII-3
The Westin Denver International <strong>Hotel</strong>Property Descriptionmetropolitan areas of Gr<strong>and</strong> Junction <strong>and</strong> Denver via a route through the RockyMountains; it is an east-west thoroughfare. In eastern Colorado, I-70 crosses theGreat Plains, connecting Denver with metropolitan areas in Kansas <strong>and</strong> Missouri.To reach the proposed Subject by automobile from the west, one would travel easton I-70 <strong>and</strong> take a slight right onto Pena Boulevard. After traveling approximately12 miles, Pena Boulevard leads directly to <strong>DIA</strong>. It is anticipated that there will be anexit ramp leading directly to the entrance point of the proposed Subject uponcompletion of the overall development.The main vehicular access point to the hotel will be on the west side of thedevelopment on Level 1. This access point will be covered by a porte-cochere.Guests will have the option of valet parking or self-parking. The proposed Subjectwill be connected to the main terminal. As such, arriving passengers on the RTDrail line will be able to access the hotel via elevators <strong>and</strong> escalators at the south endof the airport. With RTD access, it is anticipated that a majority of overnight guestswill not arrive via a car.Overall, the location of the site is ranked “excellent,” as outlined in the followingtable.AccessibilityVisibilityProximity to <strong>Dem<strong>and</strong></strong>Long-term Strategic PotentialSite <strong>Analysis</strong>Excellent Very Good Good Fair PoorXXXXC. PLANNED IMPROVEMENTS DESCRIPTIONAs discussed, we have been provided with a preliminary development program forthe proposed Subject. While site work has commenced on the overall terminalproject, there are still minor changes occurring to the hotel development program.Our description of the improvements is based on this development program, whichis, therefore, subject to modification.III-4
The Westin Denver International <strong>Hotel</strong>Property Description<strong>DIA</strong> South Terminal Redevelopment Program Site Plan1. Property Description <strong>and</strong> ConfigurationThe proposed Westin will represent an upper upscale, full-service hotel. At 519guestrooms, the gross building area of the hotel is estimated to be approximately473,229 square feet, or 912 square feet per guestroom. The proposed Subject isestimated to be open <strong>and</strong> available for occupancy on August 1, 2015. The mainfacilities of the proposed Subject will include an all-purpose restaurant <strong>and</strong> bar,coffee express outlet, 29,000 square feet of meeting space, a 6,000 square-foothealth club, featuring an indoor swimming pool <strong>and</strong> whirlpool, fitness center, <strong>and</strong>Kids Club, business center, <strong>and</strong> a gift shop. The Westin hotel is only onecomponent of the overall redevelopment program. Other major components of theredevelopment plan include the RTD light rail extension, which will connectdowntown Denver to <strong>DIA</strong>, a new runway, more than 20 new gates, two additionalinternational gates, <strong>and</strong> an improved baggage system <strong>and</strong> passenger train.Based on our review of the preliminary development program <strong>and</strong> on conversationswith representatives of <strong>DIA</strong>, we underst<strong>and</strong> that the RTD rail line will connect to <strong>DIA</strong>on Level 1. The proposed Subject’s meeting space will be located on Level 2 withmechanical systems <strong>and</strong> back-of-house operations located on Levels 3 <strong>and</strong> 4.Level 5 will contain the proposed Subject’s restaurants (both the hotel-operatedrestaurant <strong>and</strong> <strong>DIA</strong> leased restaurant). This level will also be the access point tothe main terminal of the airport. Level 6 will feature the proposed Subject’s lobbyIII-5
The Westin Denver International <strong>Hotel</strong>Property Description<strong>and</strong> public space. The proposed Subject’s guestrooms will be located on Levels 6through 14. It is anticipated that guests traveling by way of the RTD rail line will beable to access the hotel’s lobby via a separate elevator bank than those used toaccess the main terminal.2. GuestroomsThe Subject will contain a total of 519 guestrooms. The guestroom mix will be asfollows: 286 st<strong>and</strong>ard king rooms, 192 st<strong>and</strong>ard queen/queen rooms, 16 executivesuites, 1 renewal suite, 12 junior suites, 4 deluxe suites (2 keys per suite), <strong>and</strong> 2hospitality suites (2 keys per suite). We have assumed that the furniture, fixtures,<strong>and</strong> guestroom amenities will be consistent with that of the Westin br<strong>and</strong> <strong>and</strong> willadhere to the operational <strong>and</strong> quality st<strong>and</strong>ards established by Starwood <strong>Hotel</strong>s <strong>and</strong>Resorts for the Starwood br<strong>and</strong>.The Westin Denver International AirportGuestrooms Distribution by TypeSt<strong>and</strong>ardDeluxe Suite HospitalityLevelSt<strong>and</strong>ardKingDoubleQueenExecutiveSuiteRenewalSuiteJuniorSuite(2 Keys perSuite)Suite (2 Keysper Suite) Total6 12 12 2 2 4 327 28 18 4 2 528 38 24 6 689 38 26 2 4 7010 40 29 6911 27 20 2 1 2 4 5612 36 22 2 6013 35 23 5814 32 18 4 54Total 286 192 16 1 12 8 4 519The st<strong>and</strong>ard king guestrooms will range in size between 383 <strong>and</strong> 580 square feet,<strong>and</strong> the st<strong>and</strong>ard queen/queen guestrooms will range in size between 416 <strong>and</strong> 680square feet. The executive suites are anticipated to be between 710 <strong>and</strong> 868square feet while the junior suite will be between 675 <strong>and</strong> 703 square feet. Thedeluxe <strong>and</strong> hospitality suites (2 keys per suite) will be between 1,200 <strong>and</strong> 1,234square feet. The largest suite, the renewal suite, is projected to be 1,492 squarefeet.Typical Westin guestrooms feature the following amenities:King, or double queen pillow-top beds with the Westin Heavenly Bed®;Smart desk with iPod <strong>and</strong> laptop interfacing capabilities;Two telephones with international direct dialing, data port <strong>and</strong> voicemail;Sitting area;III-6
The Westin Denver International <strong>Hotel</strong>Property DescriptionIron <strong>and</strong> pressing board;Coffee <strong>and</strong> tea maker;Mini bar;Refreshment center;Refrigerator available (charge);37” flat screen LCD televisions;In-room movies;Digital alarm clock/radio;Laptop safe;Bathrobes;High-speed internet;White Tea by Westin bath products; <strong>and</strong>,Hairdryer.3. Food <strong>and</strong> BeverageBased on a preliminary development program provided to us by <strong>DIA</strong>, we underst<strong>and</strong>that the proposed Subject will feature an all-purpose restaurant <strong>and</strong> bar <strong>and</strong> acoffee express outlet. Additionally, the proposed Subject will generate revenuethrough catering <strong>and</strong> banquet services. The restaurant is estimated toaccommodate up to 120 people; the bar will accommodate 140 people, <strong>and</strong> thecoffee express people will accommodate 25 people. Additionally, it should be notedthat there will be a second “all purpose” restaurant adjacent to the proposedSubject’s restaurant. However, any revenue or expenses associated with thisoperation will not flow through the financial statement of the hotel.4. Meeting SpaceBased on a preliminary development program provided to us by <strong>DIA</strong>, we underst<strong>and</strong>that the proposed Subject will feature approximately 29,000 square feet of flexiblefunction space, or 56 square feet per guestroom. The proposed Subject’s meetingspace will primarily be located on Level 2 of the development. Presented in thefollowing table is the breakdown of meeting space.III-7
The Westin Denver International <strong>Hotel</strong>Property DescriptionThe Westin Denver International AirportSummary of Meeting FacilitiesFunction Rooms QuantitySquareFootage Each Net Area SeatsJr. Ballroom 1 8,282 8,282 750Banquet Room "A" 2 3,373 6,746 560Banquet Room "B" 2 2,398 4,796 415Meeting Room "A" 2 988 1,976 140Meeting Room "B" 3 980 2,940 210Meeting Room "C" 1 584 584 40Board Room "A" 2 991 1,982 75Board Room "B" 3 565 1,695 65Total 16 29,001 2,255Source: Denver International AirportAt 57 square feet per guest room, the proposed Subject is expected to becompetitive in its ability to compete for group dem<strong>and</strong> in the local market. As apoint of comparison, the only hotel in the competitive airport lodging market tofeature more meeting space per guestroom than the proposed Subject is theCrowne Plaza, which has approximately 275 square feet of meeting space perguestroom. The remainder of the hotels comprising the primary competitive marketfeature between approximately 15 <strong>and</strong> 30 square feet per guestroom. It isanticipated that a significant number of groups will come from both coasts to the<strong>DIA</strong> location <strong>and</strong> stay at the proposed Subject in part due to the convenience of nothaving to rent a car but still being able to commute downtown via the RTD rail line.5. Public AreasThe proposed Subject’s public areas will include a 6,000 square-foot health club,featuring an indoor swimming pool <strong>and</strong> whirlpool, fitness center, <strong>and</strong> Kids Club.Additionally, the proposed Subject will feature a business center <strong>and</strong> gift shop.6. ParkingFor the purpose of this analysis, we have assumed that parking at the Subjectwould be provided by the airport surface <strong>and</strong> structure parking lots. It should benoted that we have not modeled any parking revenues or expenses for the Subjectin our cash flow projections.III-8
The Westin Denver International <strong>Hotel</strong>Property DescriptionD. MANAGEMENT AND AFFILIATION1. Management AgreementThe Subject will be affiliated with <strong>and</strong> operated by Starwood <strong>Hotel</strong>s <strong>and</strong> Resortsunder a long term management agreement. Under this agreement, the hotel will beencumbered with a management fee, national marketing assessment, <strong>and</strong> otheraffiliation fees. These fees have been included in our forecast of marketingexpense as will be presented in Section V of this report. We have based our feeson a qualified Management Agreement (“QMA”) dated April 11, 2011. Presented inthe following table is a summary of the fees stipulated in the QMA.Owner:Manager:Date: April 11, 2011Term:15 yearsThe Westin Denver International AirportSummary of the Qualified Management AgreementCity <strong>and</strong> County of Denver on behalf of its Department of AviationWestin <strong>DIA</strong> Operator, LLCSubordinateManagementFeeSeniorCapExReserveSubordinateCapExReserveBase ManagementFees:FeeFirst 12 months $684,309 $0 1.0% 0.0%Second 12 months $788,119 $197,030 2.0% 0.0%Third 12 months $1,319,743 $219,957 3.0% 0.0%Fourth 12 months $1,355,622 $451,874 5.0% 0.0%Fifth 12 months $1,399,739 $466,580 6.0% 1.0%Sixth 12 months $1,440,091 $480,030 6.0% 1.5%Seventh 12 months $1,489,171 $496,390 6.0% 2.0%Eighth 12 months $1,526,375 $508,791 6.0% 3.0%Ninth 12 months $1,572,334 $524,111 6.0% 3.0%Tenth 12 months $1,618,789 $539,596 6.0% 3.0%Source: Denver International AirportE. DEVELOPMENT COSTSPresented in the following table is a summary of the development costs for the hotelpiece of the overall project. As can be noted, development costs for the proposedSubject, inclusive of capitalized interest during construction, a debt service reservefund, <strong>and</strong> the cost of issuing bonds, less operator key money of $3,500,000, isapproximately $221,100,000, or $426,000 per room.III-9
The Westin Denver International <strong>Hotel</strong>Property DescriptionThe Westin Denver International AirportDevelopment Costs<strong>Hotel</strong> construction <strong>and</strong> development costs $ 180,000,000<strong>Hotel</strong> operating account 700,000<strong>Hotel</strong> operating reserve fund 1,500,000Capitalized interest during construction 27,106,111Debt service reserve fund 12,672,000Costs of issuing bonds 2,640,000Subtotal $ 224,618,111Operator key money (3,500,000)Total funding requirements $ 221,118,111Source: Piper JaffrayF. CONCLUSIONThe 519-room Westin will offer contemporary lodging services, surrounded bymodern furnishings, in a newly constructed facility built at the south terminal of <strong>DIA</strong>.Features <strong>and</strong> amenities at the property will include an all-purpose restaurant <strong>and</strong>bar, coffee express outlet, 29,000 square feet of meeting space, a 6,000 squarefoothealth club, featuring an indoor swimming pool <strong>and</strong> whirlpool, fitness center,<strong>and</strong> Kids Club, business center, <strong>and</strong> a gift shop.The proposed Subject will represent an upper upscale, full-service hotel located atthe south terminal of <strong>DIA</strong>. Upon completion of the development in August 2015, theproposed Subject will represent the highest quality <strong>and</strong> newest lodging product inthe Denver Airport lodging market <strong>and</strong> the newest in-terminal hotel in the U.S. Weare of the opinion that the proposed Subject will be well received in the competitivemarket, as will be detailed in Sections IV <strong>and</strong> V of this report.III-10
The Westin Denver International <strong>Hotel</strong>Property DescriptionLevel 1III-11
The Westin Denver International <strong>Hotel</strong>Property DescriptionLevel 2III-12
The Westin Denver International <strong>Hotel</strong>Property DescriptionLevel 3III-13
The Westin Denver International <strong>Hotel</strong>Property DescriptionLevel 4III-14
The Westin Denver International <strong>Hotel</strong>Property DescriptionLevel 5III-15
The Westin Denver International <strong>Hotel</strong>Property DescriptionLevel 6III-16
The Westin Denver International <strong>Hotel</strong>Property DescriptionLevel 7III-17
The Westin Denver International <strong>Hotel</strong>Property DescriptionLevel 8III-18
The Westin Denver International <strong>Hotel</strong>Property DescriptionLevel 9III-19
The Westin Denver International <strong>Hotel</strong>Property DescriptionLevel 10III-20
The Westin Denver International <strong>Hotel</strong>Property DescriptionLevel 11III-21
The Westin Denver International <strong>Hotel</strong>Property DescriptionLevel 12III-22
The Westin Denver International <strong>Hotel</strong>Property DescriptionLevel 13III-23
The Westin Denver International <strong>Hotel</strong>Property DescriptionLevel 14III-24
The Westin Denver International <strong>Hotel</strong>Property DescriptionIllustration – Aerial PerspectiveIII-25
The Westin Denver International <strong>Hotel</strong>Property DescriptionIllustration from Level 5 RoadwayIII-26
The Westin Denver International <strong>Hotel</strong>Property DescriptionIllustration from Level 1 L<strong>and</strong>scaped BermsIII-27
The Westin Denver International <strong>Hotel</strong>Property DescriptionSouthwest Aerial PerspectiveIII-28
The Westin Denver International <strong>Hotel</strong>Property DescriptionSouth PerspectiveIII-29
The Westin Denver International <strong>Hotel</strong>Property DescriptionTrain Platform PerspectiveTrain Hall PerspectiveIII-30
The Westin Denver International <strong>Hotel</strong>Property Description<strong>Hotel</strong> Lobby Interior PerspectiveIII-31
The Westin Denver International <strong>Hotel</strong>Property DescriptionConvention Center Interior PerspectiveIII-32
The Westin Denver International <strong>Hotel</strong>Property Description<strong>Hotel</strong> Pool <strong>and</strong> Fitness Interior PerspectiveIII-33
The Westin Denver International <strong>Hotel</strong>Property DescriptionSouth Aerial PerspectiveIII-34
The Westin Denver International <strong>Hotel</strong>Property DescriptionNorthwest PerspectiveIII-35
The Westin Denver International <strong>Hotel</strong>Property DescriptionPlaza PerspectiveIII-36
The Westin Denver International <strong>Hotel</strong>Property DescriptionPlaza PerspectiveIII-37
SECTION IVHOTEL MARKET ANALYSIS
The Westin Denver International Airport<strong>Hotel</strong> <strong>Market</strong> <strong>Analysis</strong>A. INTRODUCTIONThe market <strong>and</strong> financial feasibility of a lodging facility is a direct function of thesupply <strong>and</strong> dem<strong>and</strong> for hotel rooms within the market. Accordingly, an analysis ofthe local area lodging market is a key component of the financial process.Presented in this section is an overview of the overall Denver-Aurora area lodgingmarket, followed by a more detailed analysis of the competitive local hotel market ofthe proposed Subject. Based on this analysis, we have projected the occupancy,average daily room rate, <strong>and</strong> revenue per available room for the proposed WestinDenver International Airport for its first ten years of operation (2015 to 2024).B. NATIONAL MARKET OVERVIEWIn addition to <strong>PKF</strong> Consulting, our Firm contains a research division, <strong>PKF</strong>Hospitality Research. <strong>PKF</strong> Hospitality Research owns the database for Trends® inthe <strong>Hotel</strong> Industry, the statistical review of U.S. hotel operations which firstappeared in 1935 <strong>and</strong> has been published every year since. Beginning in 2007,<strong>PKF</strong> unveiled its powerful <strong>Hotel</strong> Horizons®, an economics-based hotel forecastingmodel that projects five years of supply, dem<strong>and</strong>, occupancy, ADR, <strong>and</strong> RevPARfor the U.S. lodging industry with a high degree of accuracy. <strong>Hotel</strong> Horizons ®reports are published on a quarterly basis for 50 markets <strong>and</strong> six national chainscales.Based on the June – August 2012 National Edition of <strong>Hotel</strong> Horizons® prepared by<strong>PKF</strong> Hospitality Research, in 2010 <strong>and</strong> 2011 the U.S. lodging market experiencedan increase in revenue per available room (RevPAR) of 5.4 <strong>and</strong> 8.2 percent,respectively. As a point of comparison, the U.S. lodging market experienced adecline in RevPAR of 16.7 percent in 2009, the largest percentage decline since<strong>PKF</strong> Research began tracking lodging performance back in 1935. This significantdecline in RevPAR was a direct result of the severe national <strong>and</strong> global recessionwhich began in the fall of 2007 <strong>and</strong> lasted well into 2009. Further, this significantdecline in RevPAR resulted in an even greater decline in the net operating income(NOI) of hotels of nearly 40 percent, subsequently impacting hotel valuesthroughout the nation. <strong>PKF</strong> Hospitality Research is projecting RevPAR growth of5.8 percent in 2012 due to gains primarily in ADR. In 2013 <strong>and</strong> 2014, the overallU.S. lodging market is projected to achieve RevPAR growth of 6.6 <strong>and</strong> 7.8 percent,respectively. Thereafter, RevPAR growth is projected to taper to long-run averagerates.The proposed Subject can be identified in the upper upscale hotel segment. TheRevPAR for the U.S. upper upscale hotel segment experienced a decline inRevPAR of 17.2 percent, slightly above the decline for all U.S. hotels during thistime. RevPAR for this segment increased 5.9 percent in 2010 <strong>and</strong> 6.6 percent in2011. In 2012 <strong>and</strong> 2013, RevPAR is projected to increase 5.5 <strong>and</strong> 5.4 percent,IV-1
The Westin Denver International Airport<strong>Hotel</strong> <strong>Market</strong> <strong>Analysis</strong>respectively. Thereafter, RevPAR for the U.S upper upscale hotel segment isprojected to taper to long-run averages.C. DENVER LODGING MARKET1. OverviewThe greater Denver lodging market offers a variety of lodging options in allsegments of the market. Travelers have a diverse selection of accommodations.The region offers boutique, full-service, focus-service, limited-service, extendedstay,<strong>and</strong> economy hotels. The Denver lodging market incorporates the followingsubmarkets: Central <strong>Business</strong> District, North, Airport/East, West, South, <strong>and</strong>Englewood. The proposed Subject is located in the Airport/East submarket. Intotal, the greater Denver lodging market consists of 40,316 hotel rooms. Thefollowing table summarizes the supply of hotel rooms in each of the aforementionedsubmarkets.Denver Lodging <strong>Market</strong>Submarket SummaryUpper-Priced Lower-Priced TotalsSubmarket <strong>Hotel</strong>s Rooms%<strong>Market</strong> <strong>Hotel</strong>s Rooms%<strong>Market</strong> <strong>Hotel</strong>s Rooms%<strong>Market</strong>Central <strong>Business</strong> District 24 7,635 18.9% 21 1,653 4.1% 45 9,288 23.0%North 10 1,841 4.6% 23 2,355 5.8% 33 4,196 10.4%Airport/East 21 4,131 10.2% 62 7,620 18.9% 83 11,751 29.1%West 10 1,210 3.0% 32 2,899 7.2% 42 4,109 10.2%South 12 1,743 4.3% 37 3,102 7.7% 49 4,845 12.0%Englewood 16 3,574 8.9% 24 2,553 6.3% 40 6,127 15.2%Total 93 20,134 49.9% 199 20,182 50.1% 292 40,316 100.0%Source: <strong>PKF</strong> Hospitality Research <strong>and</strong> Smith Travel ResearchAs noted, the Airport/East submarket contains the largest supply of hotel roomsthroughout the greater Denver region with a total of 83 hotels, 62 of which arecategorized as lower-priced hotels, <strong>and</strong> 11,751 guestrooms (29.1 percent of theoverall market). The Central <strong>Business</strong> District (downtown Denver) contains 45hotels, 24 of which are categorized as upper-priced hotels, <strong>and</strong> 9,288 guestrooms(23.0 percent of the overall market). The West submarket, which includes the cityof Golden amongst others, contains the smallest supply of hotel rooms <strong>and</strong> amarket share of only 10.2 percent. A map outlining the different submarkets ispresented on the following page.IV-2
The Westin Denver International Airport<strong>Hotel</strong> <strong>Market</strong> <strong>Analysis</strong>Map of Denver Submarkets2. Historical <strong>and</strong> Projected PerformancePresented in the following graph are the historical occupancy <strong>and</strong> average dailyroom rate (“ADR”) levels for the Denver lodging market since 1995. Additionally, wehave also included the projected performance of the Denver lodging market from2012 through 2016.IV-3
The Westin Denver International Airport<strong>Hotel</strong> <strong>Market</strong> <strong>Analysis</strong>Denver Lodging <strong>Market</strong>Historical <strong>and</strong> Projected Performance$20070.4%70.4%$180$16070.4%68.6%65.4%66.9%64.4% 65.4% 62.8%62.7%65.2%66.3%67.0%67.4% 68.3% 68.3%70%65%$140$120$10061.6%60.2% 62.1%59.3%57.9%$90$9957.5%$106$93$94$98$101$108$115$121$12760%55%$80$65$70$75$77$77$79 $79$76 $75 $75$8150%$6045%ADROccupancySource: <strong>PKF</strong> Hospitality Research – <strong>Hotel</strong> Horizons ® June – August 2012 <strong>and</strong> Smith TravelResearchThe overall Denver lodging market achieved a consistent occupancy level of 70.4percent between 1995 <strong>and</strong> 1997. Occupancy declined in 1998 <strong>and</strong> 1999 as a resultof an increase in supply of 10.2 <strong>and</strong> 11.6 percent, respectively. At this point in time,market occupancy fell to 65.4 percent. As new supply was absorbed, occupancyincreased 1.5 percentage points in 1999 before declining significantly between 2000<strong>and</strong> 2003, which can be attributable to the negative impact of the terrorist attacks onSeptember 11, 2001 (9/11), the war with Iraq, <strong>and</strong> an outbreak of Severe AcuteRespiratory Syndrome (SARS). Occupancy began to show signs of improvement in2004, which lasted through 2007 with steady increases in dem<strong>and</strong>. However, theDenver lodging market experienced another significant decline in dem<strong>and</strong> between2007 <strong>and</strong> 2009 as a result of the Great Recession, which negatively impacteddem<strong>and</strong> for hotel room nights across that nation. At this point in time, marketoccupancy decreased to 57.5 percent, which is in line with the occupancy levelachieved in 2003. As the economy began to show signs of recovery, occupancyincreased to 62.7 percent in 2010 <strong>and</strong> 65.2 percent in 2011, which representsincreases in dem<strong>and</strong> of 9.8 <strong>and</strong> 5.8 percent, respectively. Between 2012 <strong>and</strong> 2016,the Denver lodging market is projected to continue to experience increases indem<strong>and</strong>. <strong>Market</strong> occupancy over this period is projected to increase fromapproximately 66 percent in 2012 to a stabilized level of approximately 68 percentbeginning in 2015.IV-4
The Westin Denver International Airport<strong>Hotel</strong> <strong>Market</strong> <strong>Analysis</strong>The ADR of the Denver lodging market fluctuated between approximately $65 <strong>and</strong>$75 between 1995 <strong>and</strong> 2004. Beginning in 2005, management of hotels throughoutthe region focused on increasing rates as dem<strong>and</strong> returned to the local market.This focus on increasing ADR resulted in rate growth of 8.4 percent in 2005 withADR increasing from approximately $75 to $81. Significant rate growth of 11.0,10.4, <strong>and</strong> 6.5 percent was achieved in 2006, 2007, <strong>and</strong> 2008, respectively, whichresulted in an ADR of approximately $106 in 2008. As dem<strong>and</strong> declined year-overyeardue to the recent economic downturn, management discounted rates, whichresulted in a decrease in ADR of 12.0 percent in 2009. As dem<strong>and</strong> returned to thelocal lodging market, modest increases in ADR were achieved in 2010 <strong>and</strong> 2011,resulting in an ADR of approximately $98 through year-end 2011. As the economycontinues to improve <strong>and</strong> dem<strong>and</strong> returns to the Denver lodging market, rate growthof between approximately 4.0 <strong>and</strong> 7.0 percent is projected over the next five years,resulting in an ADR of approximately $127 in 2016. This ADR growth is deemedreasonable as the market operates on a stabilized level <strong>and</strong> management focusesprimarily on increasing room rates.D. COMPETITIVE LODGING MARKET ANALYSISWithin the greater Denver lodging market, the proposed Subject is projected tocompete primarily with the nationally-affiliated, full-service <strong>and</strong> some focus-servicehotels located proximate to the Denver International Airport (<strong>DIA</strong>) (in theAirport/East submarket). As the Subject will represent the highest quality hotel inthe Airport/East submarket, it is also projected to compete secondarily with thenationally-affiliated, full-service hotels located in downtown Denver (Central<strong>Business</strong> District submarket). Accordingly, we have presented an overview of themost direct competitors located in the local Airport/East market as well as thesecondary competitors located in the Central <strong>Business</strong> District lodging market.Lastly, as the Subject will represent an in-terminal hotel, or hotel physicallyconnected to a major international airport, we have also presented an overview ofthe performance of the in-terminal lodging market within the United States <strong>and</strong>Canada. Our review of the other in-terminal hotels is presented later in this section<strong>and</strong> serves more as a test of reasonableness against the unique performance forthe select number of hotels that are physically connected to a major, internationalairport.1. Competitive Airport Lodging <strong>Market</strong>The airport lodging market primarily includes those hotels located on Tower Road,approximately eight miles southwest of <strong>DIA</strong> <strong>and</strong> the group of hotels located in <strong>and</strong>around Gateway Park along 40 th Street, approximately 12 miles southwest of <strong>DIA</strong>.For the purpose of this analysis, we have focused on six hotels in these twolocations as representing the primary competitive market for the proposed Westin.Competitive properties were identified on the basis of product quality, room rateIV-5
The Westin Denver International Airport<strong>Hotel</strong> <strong>Market</strong> <strong>Analysis</strong>structure, amenities offered, <strong>and</strong> overall market positioning. These hotels includethe Marriott Gateway, Embassy Suites, Hilton Garden Inn, Courtyard by Marriott,Crowne Plaza, <strong>and</strong> the Holiday Inn. It should be noted that while we have selectedthese six hotels as the primary airport competitors, the proposed Westin maycompete indirectly with many other hotels in the airport market for select segmentsof transient or group dem<strong>and</strong>. However, our selection of these six propertiesrepresents the most competitive sample of hotels in the airport market. Thefollowing table provides a brief summary of these competitive airport properties. Amap <strong>and</strong> additional information on each individual property is presented on thefollowing pages.The Westin Denver International AirportSummary of the Competitive Airport Lodging <strong>Market</strong>Property Rooms Year OpenDenver International Airport Marriott at Gateway Park 238 1998Embassy Suites Denver International Airport 174 2002Hilton Garden Inn Denver International Airport 157 1999Courtyard Denver International Airport 202 1997Crowne Plaza Denver International Airport 255 1982Holiday Inn Denver International Airport 161 2009Total 1,187 -IV-6
The Westin Denver International Airport<strong>Hotel</strong> <strong>Market</strong> <strong>Analysis</strong>Competitive Airport <strong>Hotel</strong> <strong>Market</strong>IV-7
The Westin Denver International Airport<strong>Hotel</strong> <strong>Market</strong> <strong>Analysis</strong>Competitive Property Number One (Airport)Denver International Airport Marriott at Gateway ParkLocationDescriptionAddress:16455 E. 40th Circle Date opened: 1998Aurora, CO 80011 Guestrooms: 238Distance from Subject:11.8 milesAmenitiesPicture•••••••••••Fire + Spice GrillGreat Room LoungeIn-room diningApproximately 7,000 square feet of meeting spaceFitness centerIndoor swimming pool <strong>and</strong> whirlpoolDenver Airport shuttle, available 24 hours a dayHigh-speed Internet access throughout the hotelComplimentary on-site parking<strong>Business</strong> centerLaundry/valet serviceNotesThe Marriott at Gateway Park is located approximately 12miles southwest of the proposed Subject. Gateway Parkis a business park but also attracts overflow dem<strong>and</strong> fromthe hotels located on Tower Road, proximate to theDenver International Airport. The hotel opened in 1998<strong>and</strong> features 238 guestrooms. Additionally, the hotel isaffiliated with Marriott International <strong>and</strong> benefits fromMarriott's guest rewards program <strong>and</strong> marketing efforts.This hotel represents one of Marriott's full-serviceproducts.Historical PerformanceIn 2011, the Marriott at Gateway Park achieved anoccupancy level <strong>and</strong> ADR above the competitivemarket average. It should be noted that the Marriottat Gateway Park achieves one of the highest ADRsin the competitive airport lodging market.IV-8
The Westin Denver International Airport<strong>Hotel</strong> <strong>Market</strong> <strong>Analysis</strong>Competitive Property Number Two (Airport)Embassy Suites Denver International AirportLocationDescriptionAddress:7001 Yampa Street Date opened: 2002Denver, CO 80249 Guestrooms: 174Distance from Subject:7.8 miles•••••••••••••AmenitiesComplimentary cooked-to-order breakfastManager's evening receptionDiazza RestaurantIn-room diningApproximately 5,000 square feet of meeting spaceFitness centerIndoor swimming pool <strong>and</strong> whirlpoolCoin-operated laundry facilitiesLaundry/valet service<strong>Business</strong> centerGift shopLocal area transportationHigh-speed Internet access throughout the hotelNotesThe Embassy Suites is located approximately eight milessouthwest of the proposed Subject in the Tower Roadhotel market. The hotel opened in 2002 <strong>and</strong> features 174guestrooms. The Embassy Suites is affiliated with Hilton<strong>Hotel</strong>s <strong>and</strong> Resorts <strong>and</strong> benefits from Hilton's guestreward program <strong>and</strong> marketing efforts. This hotelrepresents Hilton's all-suite, full-service product.PictureHistorical PerformanceThe Embassy Suites achieved an occupancy level<strong>and</strong> ADR above the competitive market average in2011. It should be noted that the Embassy Suitesachieves one of the highest ADRs in the competitiveairport lodging market.IV-9
The Westin Denver International Airport<strong>Hotel</strong> <strong>Market</strong> <strong>Analysis</strong>Competitive Property Number Three (Airport)Hilton Garden Inn Denver International AirportLocationDescriptionAddress:16475 E. 40th Circle Date opened: 1999Aurora, CO 80011 Guestrooms: 157Distance from Subject:11.7 milesAmenitiesPicture••••••••••••The Great American Grill (breakfast <strong>and</strong> dinner)24-hour Pavilion Pantry <strong>Market</strong>Airline deskApproximately 3,100 square feet of meeting spaceIndoor swimming pool <strong>and</strong> whirlpool<strong>Business</strong> centerDenver Airport shuttle, 24 hours a dayHigh-speed Internet access throughout the hotelLaundry/valet serviceCoin-operated laundry facilitiesIn-room diningFitness centerNotesThe Hilton Garden Inn is located approximately 12 milessouthwest of the proposed Subject in the GatewayCorporate Park. The hotel opened in 1999 <strong>and</strong> features157 guestrooms. The Hilton Garden Inn is affiliated withHilton <strong>Hotel</strong>s <strong>and</strong> Resorts <strong>and</strong> benefits from Hilton's guestreward program <strong>and</strong> marketing efforts. This hotelrepresents Hilton's focus-service product.Historical PerformanceThe Hilton Garden Inn achieved an occupancy levelin line with the competitive market average <strong>and</strong> anADR above the competitive market average in2011.IV-10
The Westin Denver International Airport<strong>Hotel</strong> <strong>Market</strong> <strong>Analysis</strong>Competitive Property Number Four (Airport)Courtyard Denver International AirportLocationDescriptionAddress:6901 Tower Road Date opened: 1997Denver, CO 80249 Guestrooms: 202Distance from Subject:7.7 milesAmenitiesPicture•••••••••The BistroStarbucks® Coffee HouseApproximately 2,900 square feet of meeting spaceIndoor swimming pool <strong>and</strong> whirlpool<strong>Business</strong> centerDenver Airport shuttle, 24 hours a dayHigh-speed Internet access throughout the hotelLaundry/valet serviceFitness centerNotesThe Courtyard is located approximately eight milessouthwest of the proposed Subject in the Tower Roadhotel market. The hotel opened in 1997 <strong>and</strong> features 202guestrooms. The Courtyard is affiliated with MarriottInternational <strong>and</strong> benefits from Marriott's guest rewardprogram <strong>and</strong> marketing efforts. This hotel representsMarriott's focus-service product.Historical PerformanceIn 2011, the Courtyard achieved an occupancy levelabove the competitive market average <strong>and</strong> an ADRbelow the competitive market average.IV-11
The Westin Denver International Airport<strong>Hotel</strong> <strong>Market</strong> <strong>Analysis</strong>Competitive Property Number Five (Airport)Crowne Plaza Denver International AirportLocationDescriptionAddress:15500 E. 40th Avenue Date opened: 1982Denver, CO 80239 Guestrooms: 255Distance from Subject:12.4 milesAmenitiesPicture••••••••••••Terrace RestaurantAtrium Lounge50,000-square-foot convention centerApproximately 70,000 square feet of meeting spaceIndoor swimming pool <strong>and</strong> whirlpoolFitness centerExecutive floorsGift shopHigh-speed Internet access throughout the hotelLaundry/valet serviceDenver Airport shuttle, 24 hours a day<strong>Business</strong> centerNotesThe Crowne Plaza is located approximately 12 milessouthwest of the proposed Subject in the GatewayCorporate Park. The hotel opened in 1982 <strong>and</strong> features255 guestrooms. The hotel is a convention center hotel,featuring over 50,000-square-foot convention center <strong>and</strong>over 70,000 square feet of meeting space. The hotel isaffiliated with the InterContinental <strong>Hotel</strong>s Group <strong>and</strong>benefits from IHG's guest reward program <strong>and</strong> marketingefforts. This hotel represents one of IHG's full-serviceproducts.Historical PerformanceThe Crowne Plaza achieved an occupancy level <strong>and</strong>ADR below the competitive market average in2011. It should be noted that the Crowne Plazaachieves one of the lowest ADRs in the competitiveairport lodging market.IV-12
The Westin Denver International Airport<strong>Hotel</strong> <strong>Market</strong> <strong>Analysis</strong>Competitive Property Number Six (Airport)Holiday Inn Denver International AirportLocationDescriptionAddress:6900 Tower Road Date opened: 2009Aurora, CO 80249 Guestrooms: 161Distance from Subject:7.9 milesAmenitiesPicture•••••••••Sporting News Grill Restaurant <strong>and</strong> BarIn-room diningApproximately 4,100 square feet of meeting spaceIndoor swimming pool <strong>and</strong> whirlpool<strong>Business</strong> centerFitness centerHigh-speed Internet access throughout the hotelLaundry/valet serviceDenver Airport shuttle, 24 hours a dayNotesHistorical PerformanceThe Holiday Inn is located approximately eight miles The Holiday Inn achieved an occupancy level <strong>and</strong>southwest of the proposed Subject in the Tower Road ADR below the competitive market average inhotel market. The hotel recently opened in 2009,2011.representing the newest hotel to enter the competitiveairport market, <strong>and</strong> features 161 guestrooms. The HolidayInn is affiliated with the InterContinental <strong>Hotel</strong>s Group <strong>and</strong>benefits from IHG's guest reward program <strong>and</strong> marketingefforts. This hotel represents one of IHG's full-serviceproducts.IV-13
The Westin Denver International Airport<strong>Hotel</strong> <strong>Market</strong> <strong>Analysis</strong>a. Historical Performance of the Competitive Airport Lodging<strong>Market</strong>Presented in the following table is the historical performance of the competitiveairport lodging market from 2007 through 2011, as well as year-to-date (“YTD”)June 2011 <strong>and</strong> 2012.The Westin Denver International AirportHistorical Performance of the Competitive Airport Lodging <strong>Market</strong>Annual Percent Occupied Percent <strong>Market</strong> Percent PercentYear Supply Change Rooms Change Occupancy ADR Change RevPAR Change2007 374,490 - 276,689 - 73.9% $127.71 - $94.36 -2008 374,490 0.0% 276,112 -0.2% 73.7% $131.93 3.3% $97.27 3.1%2009 398,945 6.5% 291,682 5.6% 73.1% $107.71 -18.4% $78.75 -19.0%2010 433,255 8.6% 320,717 10.0% 74.0% $106.34 -1.3% $78.72 0.0%2011 433,255 0.0% 327,399 2.1% 75.6% $108.00 1.6% $81.61 3.7%CAGR 3.7% - 4.3% - - -4.1% - -3.6% -YTD Jun '11 216,628 - 165,262 - 76.3% $106.79 - $81.47 -YTD Jun '12 216,628 0.0% 165,668 0.2% 76.5% $108.76 1.8% $83.17 2.1%Source: <strong>PKF</strong> Consulting USAAs noted, supply for the competitive airport lodging market increased at acompound annual growth rate (“CAGR”) of 3.7 percent over the past five years.The 6.5 <strong>and</strong> 8.6 percent increases in supply in 2009 <strong>and</strong> 2010, respectively, areattributable to the annualized addition of the 161-room Holiday Inn which opened inAugust 2009. Supply remained stable through YTD June 2012 with no furtheradditions.<strong>Dem<strong>and</strong></strong> for the competitive airport lodging market increased at a CAGR of 4.3percent between 2007 <strong>and</strong> 2011, outpacing the increase in supply during this time.Over the past five years, market occupancy fluctuated between 73.1 <strong>and</strong> 75.6percent despite the economic downturn during this time. The number of occupiedrooms declined 0.2 percent in 2008, which resulted in a 0.2 percentage pointdecrease in occupancy. <strong>Market</strong> occupancy further declined 0.6 percentage pointsin 2009 as the increase in supply exceeded the increase in dem<strong>and</strong>, which resultedin the five-year low occupancy level of 73.1 percent. As the economy began toshow signs of recovery, the number of occupied rooms increased 10.0 percent overprior year levels in 2010 <strong>and</strong> further increased 2.1 percent through year-end 2011,resulting in the five-year high occupancy level of 75.6 percent. It is interesting tonote that while most lodging markets across the nation experienced significantdeclines in dem<strong>and</strong> during the Great Recession, airport lodging markets typicallyexperienced only modest declines in dem<strong>and</strong> with much of the loss in revenue peravailable room (“RevPAR”) attributable to heavily discounted rates. Through YTDJune 2012, dem<strong>and</strong> remained relatively flat with occupancy increasing only 0.2percentage points to 76.5 percent.IV-14
The Westin Denver International Airport<strong>Hotel</strong> <strong>Market</strong> <strong>Analysis</strong>The ADR for the competitive airport lodging market decreased at a CAGR of 4.1percent over the past five years with ADR ranging from a low of $106.34 in 2010 toa high of $131.93 in 2008. During the height of the Great Recession (2009), theidentified competitive market experienced a significant decline in ADR of 18.4percent. This decrease resulted in an ADR of $107.71, an approximately $24decline. The market ADR further declined 1.3 percent in 2010 to $106.34, the fiveyearlow ADR level achieved by the competitive airport lodging market. Throughyear-end 2011, ADR increased a modest 1.6 percent over prior year levels,resulting in an ADR of $108. Through YTD June 2012, ADR increased from$106.79 to $108.76 or 1.8 percent.As a result of fluctuations in occupancy <strong>and</strong> ADR, RevPAR declined at a CAGR of3.6 percent between 2007 <strong>and</strong> 2011. In 2009, the competitive market experienceda decline in RevPAR of 19.0 percent, primarily as a result of an 18.4 percentdecrease in ADR. Comparatively, the U.S. overall lodging market experienced adecline in RevPAR of only 16.7 percent during this time. Through YTD June 2012,RevPAR increased 2.1 percent over prior year levels, resulting in RevPAR of$83.17, which is below 2007 levels.A majority of dem<strong>and</strong> at the hotels comprising the competitive airport lodgingmarket is from the transient market segment (approximately 55 percent) with groupdem<strong>and</strong> representing the second largest market segment (approximately 30percent). Based on conversations with management of the competitive hotels, weunderst<strong>and</strong> that the airport lodging market attracts group business that prefers theconvenience of being near the airport. The remainder of dem<strong>and</strong> in the competitiveairport lodging market is comprised of contract/crew dem<strong>and</strong>. The competitiveairport lodging market also benefits from distressed passenger dem<strong>and</strong>, which iscreated due to flight cancellations which are primarily attributable to inclementweather <strong>and</strong> airplane mechanical malfunctions. <strong>Dem<strong>and</strong></strong> for the full-service hotelscomprising the competitive airport lodging market is typically highest between themonths of May <strong>and</strong> September.2. Competitive Downtown Lodging <strong>Market</strong>As previously stated, given the fact that the proposed Subject will represent thehighest quality hotel in the airport submarket, we have also identified a sample ofcompetitive full-service hotels in downtown Denver. While these hotels are locatedapproximately 25 miles from the proposed Subject, it is likely that the proposedSubject will compete with these hotels for group dem<strong>and</strong> associated mainly withcorporate groups <strong>and</strong> national associations that involve attendees that must travelto Denver by air. The Subject will also compete with these hotels for transientdem<strong>and</strong> that would prefer the convenience of an airport location but that have totravel downtown due to the current lack of quality, upper upscale accommodations<strong>and</strong>/or lack of Starwood affiliated, full-service hotels in the airport market. As aresult, a review of the performance of these hotels, both in aggregate <strong>and</strong> on anIV-15
The Westin Denver International Airport<strong>Hotel</strong> <strong>Market</strong> <strong>Analysis</strong>individual basis is necessary, particularly as it relates to the future occupancy <strong>and</strong>ADR performance of the proposed Subject.The downtown Denver lodging market is primarily comprised of firstclass/convention, luxury, upscale, midscale, <strong>and</strong> extended-stay hotels. Based onthe proposed attributes of the Subject <strong>and</strong> its affiliation with Starwood <strong>Hotel</strong>s <strong>and</strong>Resorts <strong>and</strong> the Westin br<strong>and</strong>, we have selected eight hotels as representing thesecondary competitive downtown lodging market. Competitive properties wereidentified on the basis of product quality, room rate structure, amenities offered, <strong>and</strong>overall market positioning. These hotels include the Westin, Gr<strong>and</strong> Hyatt, MarriottCity Center, Hyatt Regency, Ritz-Carlton, Sheraton, Four Seasons, <strong>and</strong> theEmbassy Suites. As with these secondary competitive hotels, we have selectedthis sample as representing the most likely competitors to the proposed Subject inthe downtown market. However, the proposed Westin may compete indirectly withmany other hotels in the downtown market for select segments of transient or groupdem<strong>and</strong>. Our selection of these eight properties represents the most competitivesample of hotels in the downtown market. The following table provides a briefsummary of the competitive properties. A map <strong>and</strong> additional information on eachindividual property is presented on the following pages.The Westin Denver International AirportSummary of the Competitive Downtown Lodging <strong>Market</strong>Property Rooms Year OpenThe Westin Denver Downtown 430 1985Gr<strong>and</strong> Hyatt Denver 516 1979Denver Marriott City Center 613 1982Hyatt Regency Denver at Colorado Convention Center 1,100 2005The Ritz-Carlton Denver 202 2008Sheraton Denver Downtown <strong>Hotel</strong> 1,231 1985Four Seasons <strong>Hotel</strong> Denver 239 2011Embassy Suites Denver Downtown/Convention Center 403 2010Total 4,734 -IV-16
The Westin Denver International Airport<strong>Hotel</strong> <strong>Market</strong> <strong>Analysis</strong>Competitive Downtown <strong>Hotel</strong> <strong>Market</strong>IV-17
The Westin Denver International Airport<strong>Hotel</strong> <strong>Market</strong> <strong>Analysis</strong>Competitive Property Number One (Downtown)The Westin Denver DowntownLocationDescriptionAddress:1672 Lawrence Street Date opened: 1985Denver, CO 80202 Guestrooms: 430Distance from Subject:25.2 milesAmenitiesPicture•••••••••••••Augusta RestaurantStarbucks® Coffee KioskThe Palm RestaurantV's LoungeApproximately 32,000 square feet of meeting spaceRooftop pool <strong>and</strong> deckIndoor swimming pool <strong>and</strong> whirlpoolConcierge service<strong>Business</strong> centerFitness centerHigh-speed Internet access throughout the hotelIn-room diningLaundry/valet serviceNotesThe Westin is located approximately 25 miles southwest ofthe proposed Subject in downtown Denver. The hotelopened in 1985 <strong>and</strong> features 430 guestrooms. Based onconversations with management, we underst<strong>and</strong> that thishotel is to undergo a renovation in 2013. The Westin isaffiliated with Starwood <strong>Hotel</strong>s & Resorts <strong>and</strong> benefitsfrom Starwood's guest reward program <strong>and</strong> marketingefforts. This hotel represents one of Starwood's upscale,full-service products. It is assumed that the proposedSubject will also be affiliated with Starwood under theWestin br<strong>and</strong>.Historical PerformanceThe Westin achieved an occupancy <strong>and</strong> ADR abovethe competitive market average in 2011.IV-18
The Westin Denver International Airport<strong>Hotel</strong> <strong>Market</strong> <strong>Analysis</strong>Competitive Property Number Two (Downtown)Gr<strong>and</strong> Hyatt DenverLocationDescriptionAddress:1750 Welton Street Date opened: 1979Denver, CO 80202 Guestrooms: 516Distance from Subject:25.1 miles•••••••••••••AmenitiesPub 17 on Welton StreetStarbucks® CaféFireside TerraceApproximately 60,000 square feet of meeting spaceSun deckIndoor swimming pool <strong>and</strong> whirlpool<strong>Business</strong> centerFitness centerConcierge serviceLaundry/valet serviceHigh-speed Internet access throughout the hotelIn-room diningValet covered parkingNotesThe Gr<strong>and</strong> Hyatt is located approximately 25 milessouthwest of the proposed Subject in downtown Denver,approximately one block from 16th Street Mall. The hotelopened in 1979 <strong>and</strong> features 516 guestrooms. The hotelis affiliated with Hyatt <strong>Hotel</strong>s <strong>and</strong> Resorts <strong>and</strong> benefitsfrom Hyatt's guest reward program <strong>and</strong> marketing efforts.This hotel represents one of Hyatt's upscale, full-serviceproducts.PictureHistorical PerformanceIn 2011, the Gr<strong>and</strong> Hyatt achieved an occupancy<strong>and</strong> ADR above the competitive market average.IV-19
The Westin Denver International Airport<strong>Hotel</strong> <strong>Market</strong> <strong>Analysis</strong>Competitive Property Number Three (Downtown)Denver Marriott City CenterLocationDescriptionAddress:1701 California Street Date opened: 1982Denver, CO 80202 Guestrooms: 613Distance from Subject:24.9 miles• Allie's American Grill• D-Spot Lounge• Starbucks® Coffee House• In-room dining•••••••••AmenitiesApproximately 30,000 square feet of meeting spaceFitness center<strong>Business</strong> centerConcierge serviceFour concierge levelsHigh-speed Internet access throughout the hotelValet covered parkingSaunaLaundry/valet serviceNotesThe Marriott City Center is located approximately 25 milessouthwest of the proposed Subject in downtown Denver.The hotel opened in 1982 <strong>and</strong> features 613 guestrooms.The Marriott City Center is affiliated with MarriottInternational <strong>and</strong> benefits from Marriott's guest rewardprogram <strong>and</strong> marketing efforts. The hotel represents oneof Marriott's full-service products.PictureHistorical PerformanceIn 2011, the Marriott City Center achieved anoccupancy level below the competitive marketaverage <strong>and</strong> an ADR above the competitive marketaverage.IV-20
The Westin Denver International Airport<strong>Hotel</strong> <strong>Market</strong> <strong>Analysis</strong>Competitive Property Number Four (Downtown)Hyatt Regency Denver at Colorado Convention CenterLocationDescriptionAddress:650 15th Street Date opened: 2005Denver, CO 80202 Guestrooms: 1,100Distance from Subject:25.3 miles•••••••••••••AmenitiesAltitude RestaurantPerks Coffee & MorePeaks LoungeStrata BarIn-room diningApproximately 61,000 square feet of meeting spaceIndoor swimming pool <strong>and</strong> whirlpoolConcierge serviceFitness center<strong>Business</strong> centerSpa UniversaireValet covered parkingLaundry/valet serviceNotesThe Hyatt Regency is located approximately 25 milessouthwest of the proposed Subject in downtown Denver,adjacent to the Colorado Convention Center. The hotelopened in 2005 <strong>and</strong> features 1,100 guestrooms. TheHyatt Regency is affiliated with Hyatt <strong>Hotel</strong>s <strong>and</strong> Resorts<strong>and</strong> benefits from Hyatt's guest reward program <strong>and</strong>marketing efforts. The hotel represents one of Hyatt'supscale, full-service products.PictureHistorical PerformanceIn 2011, the Hyatt Regency achieved an occupancylevel <strong>and</strong> ADR above the competitive marketaverage.IV-21
The Westin Denver International Airport<strong>Hotel</strong> <strong>Market</strong> <strong>Analysis</strong>Competitive Property Number Five (Downtown)The Ritz-Carlton DenverLocationDescriptionAddress:1881 Curtis Street Date opened: 2008Denver, CO 80202 Guestrooms: 202Distance from Subject:24.9 milesAmenitiesPicture• Elway's Restaurant• In-room dining• Approximately 13,000 square feet of meeting space• The Ritz-Carlton Spa• Access to the adjacent FORZA fitness club• <strong>Business</strong> center• Concierge service• High-speed Internet access throughout the hotel• Valet covered parking• Laundry/valet service• 32 Club Level roomsNotesThe Ritz-Carlton is located approximately 25 milessouthwest of the proposed Subject in downtown Denver.The hotel opened in 2008 <strong>and</strong> features 202 guestrooms.The Ritz-Carlton is affiliated with Marriott International <strong>and</strong>benefits from Marriott's guest reward program <strong>and</strong>marketing efforts. The hotel represents Marriott's highend,full-service product.Historical PerformanceIn 2011, the Ritz-Carlton achieved an occupancylevel <strong>and</strong> ADR above the competitive marketaverage. It should be noted that the Ritz-Carltonachieves one of the highest ADRs in the overallcompetitive market.IV-22
The Westin Denver International Airport<strong>Hotel</strong> <strong>Market</strong> <strong>Analysis</strong>Competitive Property Number Six (Downtown)Sheraton Denver Downtown <strong>Hotel</strong>LocationDescriptionAddress:1550 Court Place Date opened: 1985Denver, CO 80202 Guestrooms: 1,231Distance from Subject:25.4 milesAmenitiesPicture• 15/Fifty Restaurant• 16Mix Lounge• Yard House• Katie Mullen's Irish Restaurant & Pub• Peet's Coffee & Tea• In-room dining• Approximately 133,000 square feet of meeting space• Outdoor swimming pool <strong>and</strong> whirlpool• Gift/sundry shop• <strong>Business</strong> center• Fitness center• VIP Floor• Concierge serviceNotesThe Sheraton is located approximately 25 miles southwestof the proposed Subject in downtown Denver. The hotelopened in 1985 <strong>and</strong> features 1,231 guestrooms,representing the largest hotel in the competitive market.The hotel underwent an extensive renovation in 2009, atwhich time it began operating under the Sheraton br<strong>and</strong>.The hotel is affiliated with Starwood <strong>Hotel</strong>s <strong>and</strong> Resorts<strong>and</strong> benefits from Starwood's guest reward program <strong>and</strong>marketing efforts. The hotel represents one of Starwood'sfull-service products.Historical PerformanceThe Sheraton achieved an occupancy level <strong>and</strong>ADR below the competitive market average. Itshould be noted that the hotel penetrates thedowntown competitive market below its fair sharewith regard to occupancy due to its larger size.IV-23
The Westin Denver International Airport<strong>Hotel</strong> <strong>Market</strong> <strong>Analysis</strong>Competitive Property Number Seven (Downtown)Four Seasons <strong>Hotel</strong> DenverLocationDescriptionAddress:1111 14th Street Date opened: 2011Denver, CO 80202 Guestrooms: 239Distance from Subject:25.0 milesAmenitiesPicture• EDGE restaurant <strong>and</strong> Bar• In-room dining• Approximately 17,000 square feet of meeting space• Rooftop terrace with swimming pool <strong>and</strong> whirlpool• Fitness center• <strong>Business</strong> center• High-speed Internet throughout the hotel• The 10-treatement room Four Seasons Spa• Concierge service• Valet covered parking• Laundry/valet serviceNotesHistorical PerformanceThe Four Seasons <strong>Hotel</strong> is located 25 miles southwest of In 2011, its first full year of operation, the Fourthe proposed Subject in downtown Denver. The 239-room Seasons achieved an occupancy level below thehotel recently opened in 2011, making it the newest competitive market average of the downtown hotels.addition to the competitive market. The Four Seasons is However, the Four Seasons achieves one of theaffiliated with Four Seasons <strong>Hotel</strong>s <strong>and</strong> Resorts <strong>and</strong> highest ADRs in the overall competitive market.benefits from Four Seasons' reputation <strong>and</strong> marketingefforts. The hotel represents one of the most luxurioushotels in the Denver-Aurora area.IV-24
The Westin Denver International Airport<strong>Hotel</strong> <strong>Market</strong> <strong>Analysis</strong>Competitive Property Number Eight (Downtown)Embassy Suites Denver Downtown/Convention CenterLocationDescriptionAddress:1420 Stout Street Date opened: 2010Denver, CO 80202 Guestrooms: 403Distance from Subject:25.3 milesAmenitiesPicture••••••••••••Complimentary cooked-to-order breakfastManager's evening receptionIn-room diningApproximately 5,000 square feet of meeting spaceFitness centerIndoor swimming pool <strong>and</strong> whirlpoolCoin-operated laundry facilitieslaundry/valet service<strong>Business</strong> centerGift shopLocal area transportationHigh-speed Internet located throughout the hotelNotesThe Embassy Suites is located approximately 25 milessouthwest of the Subject in downtown Denver, adjacent tothe Colorado Convention Center. The hotel opened in2010 <strong>and</strong> features 403 guestrooms. The Embassy Suitesis affiliated with Hilton <strong>Hotel</strong>s <strong>and</strong> Resorts <strong>and</strong> benefitsfrom Hilton's guest reward program <strong>and</strong> marketing efforts.The hotel represents Hilton's all-suite product.Historical PerformanceIn 2011, its first full year of operation, the EmbassySuites achieved an occupancy level below thecompetitive market average <strong>and</strong> an ADR above thecompetitive market average.IV-25
The Westin Denver International Airport<strong>Hotel</strong> <strong>Market</strong> <strong>Analysis</strong>a. Historical Performance of the Competitive DowntownLodging <strong>Market</strong>Presented in the following table is the historical performance of the competitivedowntown lodging market from 2007 through 2011, as well as YTD June 2011 <strong>and</strong>2012.The Westin Denver International AirportHistorical Performance of the Competitive <strong>Market</strong>Annual Percent Occupied Percent <strong>Market</strong> Percent PercentYear Supply Change Rooms Change Occupancy ADR Change RevPAR Change2007 1,419,850 - 986,512 - 69.5% $154.23 - $107.16 -2008 1,493,580 5.2% 1,037,392 5.2% 69.5% $163.21 5.8% $113.36 5.8%2009 1,493,580 0.0% 918,420 -11.5% 61.5% $149.80 -8.2% $92.11 -18.7%2010 1,515,480 1.5% 1,030,784 12.2% 68.0% $157.64 5.2% $107.22 16.4%2011 1,727,910 14.0% 1,207,794 17.2% 69.9% $163.37 3.6% $114.19 6.5%CAGR 5.0% - 5.2% - - 1.4% - 1.6% -YTD Jun '11 863,955 - 587,505 - 68.0% $161.42 - $109.77 -YTD Jun '12 863,955 0.0% 612,970 4.3% 70.9% $160.01 -0.9% $113.52 3.4%Source: <strong>PKF</strong> Consulting USAAs noted, supply for the competitive downtown lodging market increased at a CAGRof 5.0 percent over the past five years. In 2008, supply increased 5.2 percent overprior year levels as a result of the addition of the 202-room Ritz-Carlton in January2008. The 1.5 percent increase in supply in 2010 is attributable to the annualizedaddition of the 239-room Four Seasons in October 2010. Lastly, the 14.0 percentincrease in supply in 2011 is reflective of the annualized addition of the FourSeasons as well as the addition of the 403-room Embassy Suites in January 2011.Through YTD June 2012, supply remained stable with no further additions.<strong>Dem<strong>and</strong></strong> for the competitive downtown lodging market increased at a CAGR of 5.2percent between 2007 <strong>and</strong> 2011, in line with the increase in supply during this time.Over the past five years, market occupancy ranged from a low of 61.5 percent in2009, the height of the Great Recession, to a high of 69.9 percent through year-end2011. On average, the downtown competitive lodging market achieved a marketoccupancy of approximately 68 percent over the past five years. While dem<strong>and</strong>increased 5.2 percent in 2008, on par with the increase in supply during this time, asignificant decline in dem<strong>and</strong> of 11.5 percent was experienced in 2009, whichresulted in the five-year low occupancy level of 61.5 percent. As the economybegan to improve, the competitive downtown lodging market experienced anincrease in dem<strong>and</strong> of 12.2 percent in 2010 <strong>and</strong> 17.2 percent in 2011, resulting in afive-year high occupancy level of 69.9 percent. Through YTD June 2012, dem<strong>and</strong>increased 4.3 percent over prior year levels to 70.9 percent.IV-26
The Westin Denver International Airport<strong>Hotel</strong> <strong>Market</strong> <strong>Analysis</strong>The ADR for the competitive downtown lodging market increased at a CAGR of 1.4percent between 2007 <strong>and</strong> 2011 with ADRs ranging from a low of$149.80 in 2009 toa high of $163.37 in 2011. Rate growth of 5.8 percent was achieved in 2008 beforeADR declined 8.2 percent in 2009. This decline in ADR is less than half of thedecline experienced by the competitive airport lodging market during this time. In2010 <strong>and</strong> 2011, market ADR increased 5.2 <strong>and</strong> 3.6 percent to $163.37. ThroughYTD June 2012, ADR remained relatively flat at approximately $160.As a result of fluctuations in occupancy <strong>and</strong> ADR, RevPAR increased at a CAGR of1.6 percent between 2007 <strong>and</strong> 2011. In 2009, the competitive market experienceda decline in RevPAR of 18.7 percent, as a result of an 11.5 percent decrease indem<strong>and</strong> <strong>and</strong> 8.2 percent decrease in ADR. In 2010, the performance of thecompetitive downtown lodging market rebounded, experiencing an increase inRevPAR of 16.4 percent. Through YTD June 2012, RevPAR increased 3.4 percentover prior year levels, resulting in RevPAR of $113.52, in line with 2008 levels.A majority of dem<strong>and</strong> at the hotels comprising the competitive downtown lodgingmarket is from the transient <strong>and</strong> group market segments (approximately 45 <strong>and</strong> 50percent, respectively). Only approximately five percent of dem<strong>and</strong> represents thecontract/crew market segment. Guests who choose to stay in the downtownDenver area primarily do so to be proximate to the convention center, downtowntourist attractions, <strong>and</strong>/or within the Denver CBD where most commercial businessis conducted.3. Combined Historical Performance of the Primary <strong>and</strong> SecondaryCompetitive Lodging <strong>Market</strong>sPresented in the following table is the historical performance of the aforementionedcombined competitive airport <strong>and</strong> downtown lodging markets from 2007 through2011, as well as YTD June 2011 <strong>and</strong> 2012.The Westin Denver International AirportHistorical Performance of the Competitive <strong>Market</strong>Annual Percent Occupied Percent <strong>Market</strong> Percent PercentYear Supply Change Rooms Change Occupancy ADR Change RevPAR Change2007 1,794,340 - 1,263,201 - 70.4% $148.42 - $104.49 -2008 1,868,070 4.1% 1,313,504 4.0% 70.3% $156.63 5.5% $110.13 5.4%2009 1,892,525 1.3% 1,210,102 -7.9% 63.9% $139.66 -10.8% $89.30 -18.9%2010 1,948,735 3.0% 1,351,501 11.7% 69.4% $145.46 4.2% $100.88 13.0%2011 2,161,165 10.9% 1,535,193 13.6% 71.0% $151.56 4.2% $107.66 6.7%CAGR 4.8% - 5.0% - - 0.5% - 0.8% -YTD Jun '11 1,080,583 - 752,767 - 69.7% $149.43 - $104.10 -YTD Jun '12 1,080,583 0.0% 778,637 3.4% 72.1% $149.10 -0.2% $107.44 3.2%Source: <strong>PKF</strong> Consulting USAIV-27
The Westin Denver International Airport<strong>Hotel</strong> <strong>Market</strong> <strong>Analysis</strong>Supply for the overall competitive market increased at a CAGR of 4.8 percent overthe past five years as a result of the aforementioned additions to supply. <strong>Market</strong>occupancy ranged from a low of 63.9 percent in 2009, the height of the GreatRecession, to a high of 71.0 percent in 2011, which was attainable due to an 11.7percent increase in dem<strong>and</strong> in 2010 <strong>and</strong> 13.6 percent increase in dem<strong>and</strong> in 2011.Through YTD June 2012, occupancy increased from 69.7 to 72.1 percent or 3.4percent over prior year levels. ADR for the overall competitive market remainedrelatively unchanged between 2007 <strong>and</strong> 2011 due to an offset in ADR declines <strong>and</strong>increases. The year-end 2011 ADR is approximately $3 higher than 2007 levels.Through YTD June 2012, the competitive market experienced a modest decline inADR of 0.2 percent, resulting in an ADR of $149.10. Due to the aforementionedfluctuations in occupancy <strong>and</strong> ADR RevPAR increased at a CAGR of 0.8 percent.In 2009, RevPAR decreased 18.9 percent before increasing 13.0 percent in 2010<strong>and</strong> 6.7 percent in 2011, resulting in a RevPAR of $107.66. RevPAR increased 3.2percent over prior year levels through YTD June 2012 to $107.44.Presented in the following table is a summary of the estimated year-end 2012 ADRsfor the primary <strong>and</strong> secondary competitive markets. Due to the confidential natureof this information, we have not disclosed the identity of the hotels.Estimated Year-End 2012 ADRPrimary Competitive <strong>Market</strong> Secondary Competitive <strong>Market</strong>Property ADR Property ADR<strong>Hotel</strong> A $90 <strong>Hotel</strong> A $165<strong>Hotel</strong> B $85 <strong>Hotel</strong> B $240<strong>Hotel</strong> C $100 <strong>Hotel</strong> C $140<strong>Hotel</strong> D $115 <strong>Hotel</strong> D $225<strong>Hotel</strong> E $145 <strong>Hotel</strong> E $170<strong>Hotel</strong> F $130 <strong>Hotel</strong> F $155<strong>Hotel</strong> G $150<strong>Hotel</strong> H $165We estimate the primary competitive market to achieve ADRs ranging betweenapproximately $85 <strong>and</strong> $145 through year-end 2012. We estimate the secondarycompetitive market to achieve ADRs ranging between approximately $155 <strong>and</strong>$240 through year-end 2012. As noted, the low-end of the range in estimated 2012ADRs for the secondary competitive market is approximately $10 above the highendof the range of the primary competitive market. The hotels comprising thecompetitive downtown lodging market, in general, represent upper upscale <strong>and</strong>luxury properties with superior guestroom products <strong>and</strong> are located in primedowntown locations, thus warranting a premium in ADR.IV-28
The Westin Denver International Airport<strong>Hotel</strong> <strong>Market</strong> <strong>Analysis</strong>4. Additions to SupplyBased on our research, we have identified a number of potential additions to supplyin the Denver lodging market. Numerous hotels are in various planning stages inthe downtown <strong>and</strong> airport hotel markets. However, due to the speculative nature ofthe proposed properties, coupled with the high cost of construction, it is unlikely thatmany of these projects are expected to come to fruition in the near term, thuslimiting the number of rooms that will actually enter the market. For the purpose ofthis analysis, we have only included one hotel development in our analysis of supply<strong>and</strong> dem<strong>and</strong> for the proposed Subject due to the speculative nature or lack ofcompetitiveness of each project. The project we included is the 231-roomRenaissance hotel which is located in downtown Denver <strong>and</strong> is scheduled to openin 2014. Presented in the following paragraphs is a review of each of the variousproposed projects.Aurora: Anschutz Medial Campus Village Project: A proposed 250 to 300-room full-service hotel is planned as part of the Anschutz MedicalCampus Village project. The hotel is proposed by Corporex Colorado<strong>and</strong> is proposed to feature a 30,000-square-foot conference center, afull-service restaurant, <strong>and</strong> state-of-the-art meeting facilities. Thishotel is part of the Phase I development project. Anschutz Medical Campus: Approximately 15 acres of thisdevelopment have been set aside for the development of two or threehotels. This hotel is still in the pre-planning stage.Gaylord Resort & Convention Center: Gaylord <strong>Hotel</strong>s & Resorts isproposing a Western-style convention hotel featuring 1,500guestrooms <strong>and</strong> more than 400,000 square feet of exhibition space.Plans also include outdoor event space, a children’s playground, alarge parking area, future waterpark, several gardens <strong>and</strong> an outdoorfireplace. Development plans also include a retail town center <strong>and</strong>restaurants. The development site for this $800 million project islocated within the High Point Master Plan Development near <strong>DIA</strong> at64 th Avenue <strong>and</strong> Tower Road. Based on discussions withrepresentatives of Gaylord <strong>Hotel</strong>s & Resorts, we underst<strong>and</strong> that thisproject has been terminated.Hyatt Place <strong>Hotel</strong> & Conference Center: A 163-room Hyatt Place<strong>and</strong> conference center are proposed in the Anschutz Medical Campusdevelopment at Montview Boulevard <strong>and</strong> Ursala Drive. The hotel <strong>and</strong>conference center are proposed as part of a mixed-use developmentalso containing an office building for University Physicians, Inc. SiteIV-29
The Westin Denver International Airport<strong>Hotel</strong> <strong>Market</strong> <strong>Analysis</strong>plans have been set; however, construction is scheduled for thecoming years. Officials are hoping that the credits markets willimprove for construction to commence.Woolley Classic Suites <strong>Hotel</strong>: The first Woolley Class Suites <strong>Hotel</strong>is proposed in the Denver-Aurora hotel market, proximate to GatewayPark. The 248-room proposed full-service luxury, all-suite hotel will becomprised of eight stories on 5.17 acres with guestrooms ranging insize from 650 to 950 square feet. The project is estimated to cost $50million.Denver: Belleview Station: A 2.3 million square-foot development on 18acres of l<strong>and</strong> is proposed to include at least one 240-room full-servicehotel, along with homes, offices, <strong>and</strong> stores. The location of this largedevelopment is at Interstate 25 <strong>and</strong> Belleview Avenue. Theinfrastructure is currently being installed, <strong>and</strong> construction of thePhase I residential units was completed in 2009. Most of theBelleview Station development is projected to be completed in thenext five to seven years. Cable Building <strong>Hotel</strong>: The Cable Building is located at 1801Lawrence Street in downtown Denver. Between 13 <strong>and</strong> 14 stories areproposed to be added to the existing building <strong>and</strong> will feature retail,meeting space, <strong>and</strong> 217 guestrooms. The project is being developedby Central Development LLC. Construction on this project is to bedetermined.<strong>Hotel</strong> Gold Crown: This site for this project is located at the corner of15 th <strong>and</strong> Champa Streets. The original proposed project entailed a17-story hotel <strong>and</strong> condo tower. The tower would feature 264guestrooms on floors three through 14 <strong>and</strong> 12 condominiums on floors15 through 17. Architects of this project were forced to reduce thenumber of stories of this project from 17 to 13 floors. The firm iscurrently finalizing the redesign with a construction date to bedetermined.<strong>Hotel</strong> Palomar: A <strong>Hotel</strong> Palomar is proposed for the GreenwoodVillage at Interstate 25 <strong>and</strong> Arapahoe Road. The project is beingdeveloped by ING Clarion Partners <strong>and</strong> Kimpton <strong>Hotel</strong>s. The 200-room hotel is planned to contain 25 condominium units, 10,000 squarefeet of meeting space, <strong>and</strong> a restaurant. The hotel will be adjacent tothe Arapahoe light rail station.IV-30
The Westin Denver International Airport<strong>Hotel</strong> <strong>Market</strong> <strong>Analysis</strong>Renaissance Denver City Center: The $50 million project will bringthe old Colorado National Bank Building back to life as a 231-roomfull-service Renaissance by Marriott hotel. The physical address ofthe project is 918 17 th Street. Development plans call for the additionof two stories to the six-story building. Features include a full-servicerestaurant, café, <strong>and</strong> a 1,000-square-foot fitness center. Thedeveloper of this project is the Stonebridge Company. Thedevelopment is projected to be completed in 2014. As stated, thishotel has been included as an addition in our supply <strong>and</strong> dem<strong>and</strong> <strong>and</strong>analysis.Sunshine Towers: This mixed-use development is proposed to belocated at 1601 Wewatta Street in downtown Denver <strong>and</strong> will includean 110,000-square-foot boutique hotel. Construction is projected totake 18 to 24 months once the permitting process is complete. Denver Union Terminal: Under the Regional TransportationDistrict’s Master Plan for the historic station site, the station will beturned into a 130-room boutique hotel to be affiliated with Oxford<strong>Hotel</strong>s. The hotel is proposed to feature restaurants <strong>and</strong> retail. Thedeveloper of this project is Union Station Alliance. The plans arecurrently being finalized <strong>and</strong> are required to go through a rigoroushistorical preservation review process.E. PROJECTED PERFORMANCE OF THE COMPETITIVE MARKETTypically, dem<strong>and</strong> for hotel rooms in a given market area can be categorized in oneof three ways:Demonstrated or Accommodated <strong>Dem<strong>and</strong></strong> – The dem<strong>and</strong> that can bequantified as existing occupancy levels at competitive hotels;Unsatisfied <strong>Dem<strong>and</strong></strong> – The dem<strong>and</strong> that seeks hotel accommodations in thecompetitive market, but is turned away due to capacity restraints; <strong>and</strong>,Induced <strong>Dem<strong>and</strong></strong> – The dem<strong>and</strong> that does not presently seek hotelaccommodations in the competitive market, but could be persuaded to doso through marketing efforts, room rates, location, new facilities, services,<strong>and</strong> amenities.The dem<strong>and</strong> captured by the competitive market (demonstrated dem<strong>and</strong>) isoriented predominately towards the transient market segment (50 percent), with thegroup <strong>and</strong> contract/crew segments generating the balance. The 2011 market mixfor the competitive market is presented in the following table.IV-31
The Westin Denver International Airport<strong>Hotel</strong> <strong>Market</strong> <strong>Analysis</strong>2011 Mix of <strong>Dem<strong>and</strong></strong>Overall Competitive <strong>Market</strong><strong>Market</strong> Segment Room Nights RatioTransient 769,400 50%Group 683,600 45%Contract/Crew 82,200 5%Total 1,535,200 100%Source: <strong>PKF</strong> Consulting USAThe transient (commercial <strong>and</strong> leisure/discount) market segment comprisedapproximately 50 percent, or approximately 769,400 room nights, of the total marketdem<strong>and</strong> for 2011. The transient commercial market segment consists primarily ofmanagers, sales representatives, lawyers, investors, potential employees, <strong>and</strong> othertravelers visiting local companies based in Denver. This segment also includestransient government dem<strong>and</strong> <strong>and</strong> travelers from private <strong>and</strong> public companies,interest groups visiting local government offices, <strong>and</strong> visitors to the many medicalfacilities located throughout the region. As Denver is the capital of Colorado, thereis a large government presence. <strong>Dem<strong>and</strong></strong> for rooms in this segment is highestMonday through Thursday.The transient leisure/discount market segment consists of dem<strong>and</strong> primarily drivenby the numerous scenic attractions <strong>and</strong> bountiful recreational activities offeredthroughout the region. Leisure/discount travel includes those who travel to theDenver area to experience its year-round recreational opportunities, myriad ofsports teams <strong>and</strong> arenas, <strong>and</strong> those who patron the many museums <strong>and</strong> historicalvenues of Denver. One of Denver’s largest dem<strong>and</strong> generators is its abundance ofcultural events <strong>and</strong> venues centered in <strong>and</strong> around downtown Denver. Thissegment also includes visitors to residents in the area, as well as motorists on themajor Interstates in the region.The group market segment comprised approximately 45 percent of the overallmarket, or 683,600 room nights in 2011. The group market segment consistsprimarily of dem<strong>and</strong> generated from events at the Colorado Convention Center, inhouseassociation meetings, <strong>and</strong> social, military, educational, religious, <strong>and</strong>fraternal groups (SMERF) that are traveling to the area, <strong>and</strong> special events such asfestivals <strong>and</strong> weddings. Federal <strong>and</strong> state government groups are also included inthis segment. As Denver as the central hub of the U.S., this segment generates alarge amount of room nights on an annual basis.The contract/crew market segment comprised 5.0 percent of the overall market, orapproximately 82,200 room nights, in 2011. The contract/crew market segment iscomprised primarily of pilots, flight attendants, <strong>and</strong> airline crew business from thoseairlines utilizing <strong>DIA</strong>. Despite usual lower rates in comparison to other segments,this market is primarily attractive for its consistency. This dem<strong>and</strong> isaccommodated by the primary competitive airport hotels.IV-32
The Westin Denver International Airport<strong>Hotel</strong> <strong>Market</strong> <strong>Analysis</strong>Presented in the following table is the projected performance of the competitivemarket for the period 2012 to 2019. We have provided the 2011 performance of thecompetitive market as a basis of comparison.The Westin Denver International AirportCompetitive <strong>Market</strong>Estimated Future Growth in Lodging Supply <strong>and</strong> <strong>Dem<strong>and</strong></strong>2012 - 20192011 2012 2013 2014 2015 2016 2017 2018 2019ROOMS SUPPLY 5,339Additions/(Deletions) to SupplyThe Westin Denver International Airport 216 303Four Seasons Dow ntow n Denver (239 rms 10/2010) 179Embassy Suites Dow ntow n Denver (403 rms 12/2010) 403Renaissance <strong>Hotel</strong> (231 rms 1/2014) 231Cumulative Rooms Supply 5,921 5,921 5,921 6,152 6,368 6,671 6,671 6,671 6,671--------- --------- --------- --------- --------- --------- --------- --------- ---------Total Annual Rooms Supply 2,161,165 2,161,165 2,161,165 2,245,480 2,324,320 2,434,915 2,434,915 2,434,915 2,434,915Grow th Over the Prior Year 10.9% 0.0% 0.0% 3.9% 3.5% 4.8% 0.0% 0.0% 0.0%DEMONSTRATED DEMAND IN BASE YRTransient 769,358 50%Group 683,649 45%Contract/Crew 82,186 5%--------- ---------TOTAL DEMONSTRATED DEMAND 1,535,193 100%--------- ---------PROJECTED DEMANDTransientDemonstrated 769,358 784,745 800,440 816,449 855,218 887,622 925,775 944,290 963,176Induced/(Unsatisfied) 0 0 (18,991) (18,824) (26,855) (16,983) (54,420) (72,144) (90,254)--------- --------- --------- --------- --------- --------- --------- --------- ---------Total 769,400 784,700 781,400 797,600 828,400 870,600 871,400 872,100 872,900Grow th Over Prior Year N/A 2.0% -0.4% 2.1% 3.9% 5.1% 0.1% 0.1% 0.1%--------- --------- --------- --------- --------- --------- --------- --------- ---------GroupDemonstrated 683,649 697,322 711,268 725,494 747,144 772,286 803,032 819,093 835,475Induced/(Unsatisfied) 0 0 (16,875) (29,276) (26,566) (17,178) (47,205) (62,579) (78,287)--------- --------- --------- --------- --------- --------- --------- --------- ---------Total 683,600 697,300 694,400 696,200 720,600 755,100 755,800 756,500 757,200Grow th Over Prior Year N/A 2.0% -0.4% 0.3% 3.5% 4.8% 0.1% 0.1% 0.1%--------- --------- --------- --------- --------- --------- --------- --------- ---------Contract/CrewDemonstrated 82,186 82,186 82,186 82,186 82,186 82,186 82,186 82,186 82,186Induced/(Unsatisfied) 0 0 (1,989) (4,192) (4,103) (3,493) (4,928) (6,405) (7,855)--------- --------- --------- --------- --------- --------- --------- --------- ---------Total 82,200 82,200 80,200 78,000 78,100 78,700 77,300 75,800 74,300Grow th Over Prior Year N/A 0.0% -2.4% -2.7% 0.1% 0.8% -1.8% -1.9% -2.0%--------- --------- --------- --------- --------- --------- --------- --------- ---------Total <strong>Market</strong> <strong>Dem<strong>and</strong></strong> 1,535,200 1,564,200 1,556,000 1,571,800 1,627,100 1,704,400 1,704,500 1,704,400 1,704,400Grow th Over Prior Year N/A 1.9% -0.5% 1.0% 3.5% 4.8% 0.0% 0.0% 0.0%<strong>Market</strong> Occupancy 71% 72% 72% 70% 70% 70% 70% 70% 70%Source: <strong>PKF</strong> Consulting USAAs noted, we project accommodated dem<strong>and</strong> to increase 1.9 percent in 2012,resulting in a market occupancy level of 72 percent. This estimate is slightly lowerthan the performance of the competitive market through YTD June 2012.Accommodated dem<strong>and</strong> is projected to remain relatively unchanged in 2013resulting in continued occupancy at 72 percent. Beginning in 2014, we project thecompetitive market to achieve a stabilized occupancy level of 70 percent. Whileaccommodated dem<strong>and</strong> is projected to increase in 2014, as a result of the openingof the 231-room Renaissance hotel, <strong>and</strong> in 2015 <strong>and</strong> 2016 as a result of theaddition of the 519-room proposed Subject, market occupancy is projected toIV-33
The Westin Denver International Airport<strong>Hotel</strong> <strong>Market</strong> <strong>Analysis</strong>remain at 70 percent due to the increase in annual supply. This stabilizedoccupancy level is in line with the average annual occupancy level of thecompetitive market achieved over the past five years. It should be noted that whilethe identified competitive market occupancy may exceed or fall below 70 percent inany specific year, our projection of a stabilized occupancy of 70 percent representsthe most likely level of performance of the market over our 10-year projectionperiod.F. IN-TERMINAL LODGING MARKET OVERVIEWIn our review of the proposed Subject as an in-terminal hotel, we have alsoperformed an analysis of other in-terminal hotels located at the major airportsthroughout the U.S. <strong>and</strong> Canada. <strong>Hotel</strong>s that are physically attached to a majorU.S. airport, classified as “in-terminal” hotels, are relatively rare in the United States,but we have identified all of these hotels throughout the U.S. <strong>and</strong> Canada. Thesehotels represent nationally affiliated, luxury <strong>and</strong> upper upscale chain hotels, many ofwhich are more than 20 years old. Presented in the table on the following page is asummary of in-terminal hotels, which include ten hotels in the U.S. <strong>and</strong> two inCanada. Also included in this table is the year-end 2011 total passenger volume foreach of the hotels. As noted, there are a total of 5,319 guestrooms amongst these12 in-terminal hotels.IV-34
The Westin Denver International Airport<strong>Hotel</strong> <strong>Market</strong> <strong>Analysis</strong>Summary of In-Terminal <strong>Hotel</strong>s2011Property Location RoomsYearOpenAirportPassengerVolumeProposed Westin Denver International Airport Denver, CO 519 2015 Denver International Airport 52,849,132Hilton Chicago O'Hare Chicago, IL 860 1973 O'Hare International Airport 66,793,081Hilton Boston Logan Airport Boston, MA 599 1999 Boston Logan International Airport 28,907,938Houston Airport Marriott Houston, TX 559 1982 George Bush Intercontinental Airport 9,843,302Hyatt Regency Orl<strong>and</strong>o International Airport Orl<strong>and</strong>o, FL 445 1992 Orl<strong>and</strong>o International Airport 35,426,006Philadelphia Airport Marriott Philadelphia, PA 419 1995 Philadelphia International Airport 30,839,175Westin Detroit Metro Airport Detroit, MI 404 2002 Detroit Metro Airport 32,406,159Hyatt Regency Pittsburgh International Airport Pittsburgh, PA 336 2000 Pittsburgh International Airport 8,300,310Gr<strong>and</strong> Hyatt DFW Dallas, TX 298 2005 Dallas/Fort Worth International Airport 57,806,918Tampa Airport Marriott Tampa, FL 296 1982 Tampa International Airport 16,732,051Sheraton Bradley Airport Windsor Locks, CT 237 1987 Bradley International Airport 5,607,756Sheraton Gateway Toronto International Airport Toronto, Canada 474 1991 Toronto Pearson International Airport 33,400,000Fairmont Vancouver Airport Richmond, Canada 392 1999 Vancouver International Airport 17,032,780Total 5,319IV-35
The Westin Denver International Airport<strong>Hotel</strong> <strong>Market</strong> <strong>Analysis</strong>1. Historical Performance of the In-Terminal <strong>Hotel</strong>sPresented in the following table is the historical performance of the in-terminallodging market from 2007 through 2011, as well as YTD June 2011 <strong>and</strong> 2012.The Westin Denver International AirportHistorical Performance of the Competitive <strong>Market</strong>Annual Percent Occupied Percent <strong>Market</strong> Percent PercentYear Supply Change Rooms Change Occupancy ADR Change RevPAR Change2007 1,941,435 - 1,556,749 - 80.2% $164.46 - $131.87 -2008 1,941,435 0.0% 1,476,369 -5.2% 76.0% $160.58 -2.4% $122.11 -7.4%2009 1,941,435 0.0% 1,401,656 -5.1% 72.2% $140.74 -12.4% $101.61 -16.8%2010 1,941,435 0.0% 1,517,808 8.3% 78.2% $140.08 -0.5% $109.51 7.8%2011 1,941,435 0.0% 1,542,975 1.7% 79.5% $146.67 4.7% $116.57 6.4%CAGR 0.0% - -0.2% - - -2.8% - -3.0% -YTD Jun '11 970,718 - 784,654 - 80.8% $148.43 - $119.98 -YTD Jun '12 970,718 0.0% 791,873 0.9% 81.6% $150.62 1.5% $122.87 2.4%Source: <strong>PKF</strong> Consulting USA<strong>Dem<strong>and</strong></strong> at the in-terminal hotels decreased at a CAGR of 0.2 percent over the pastfive years with occupancy ranging from a low of 72.2 percent in 2009 to a high of80.2 percent in 2007. Similar to the performance of most lodging markets acrossthe U.S., dem<strong>and</strong> declined in 2008 <strong>and</strong> 2009 as a result of the economic downturn.The in-terminal hotels experienced a decline of 5.2 <strong>and</strong> 5.1 percent in 2008 <strong>and</strong>2009, respectively. As the economy began to improve <strong>and</strong> air travel returned toprior year levels, dem<strong>and</strong> at the in-terminal hotels increased 8.3 percent in 2010,resulting in an occupancy level of 78.2 percent. <strong>Dem<strong>and</strong></strong> further increased 1.7percent in 2011, resulting in an occupancy level of nearly 80 percent. Occupancyfor the in-terminal hotels remained flat over prior year levels at approximately 81percent through YTD June 2012. It is worth noting that an overall occupancy ofapproximately 80 percent represents the maximum level of performance for thissample of hotels given market segmentation <strong>and</strong> dem<strong>and</strong> seasonality <strong>and</strong> explainsthe flat five-year CAGR in dem<strong>and</strong> <strong>and</strong> minimal YTD dem<strong>and</strong> growth.It is also worth noting that over the five year historical period, the occupancy for thein-terminal hotels has averaged 77.2 percent <strong>and</strong> that the average size of the 12hotels is 443 rooms. When reviewing the local <strong>DIA</strong> competitive airport hotels, thefive year occupancy average was lower at 74 percent <strong>and</strong> yet the average hotel sizewas much smaller at 198 rooms. This indicates that there is a clear competitiveadvantage, which translates into an occupancy performance premium, for interminalhotels when compared to their respective competitors that are notphysically attached to the airport.ADR for the in-terminal hotels decreased at a CAGR of 2.8 percent between 2007<strong>and</strong> 2011. While the aggregate ADR was in the low to mid-$160 range in 2007 <strong>and</strong>IV-36
The Westin Denver International Airport<strong>Hotel</strong> <strong>Market</strong> <strong>Analysis</strong>2008, ADR between 2009 <strong>and</strong> 2011 fluctuated between the low to mid-$140 range,a $20 difference. Specifically, the in-terminal hotels experienced a decline in ADRof 2.4 percent in 2008, 12.4 percent in 2009, <strong>and</strong> 0.5 percent in 2010. In 2011,ADR increased 4.7 percent over prior year levels. Through YTD June 2012, ADRfurther increased 1.5 percent to $150.62.As a result of the fluctuations in occupancy <strong>and</strong> ADR, RevPAR for the in-terminalhotels decreased at a CAGR of 3.0 percent over the past five years. In 2009, thein-terminal hotels experienced a decline in RevPAR of16.8 percent, which is in linewith the decline in RevPAR experienced by the overall U.S hotel segment. RevPARincreased 7.8 <strong>and</strong> 6.4 percent in 2010 <strong>and</strong> 2011, respectively, to $116.57, which isapproximately $15 below 2007 levels. Through YTD June 2012, RevPAR increased2.4 percent to $122.87.It should be noted that in-terminal hotels typically outperform their respective urbancounterparts due to their in-terminal location. The reason for this is that customersare typically willing to pay a premium for the convenience factor of an in-terminalhotel. This is especially true in the case of distressed passengers <strong>and</strong> travelers withearly AM flights who would prefer to be as close as possible to the airport <strong>and</strong> nothave to worry about logistics. As indicated, <strong>DIA</strong> is one of the busiest airportsthroughout the U.S. <strong>and</strong> benefits from its central location. The proposed Subject isprojected to benefit from its in-terminal location based on these factors.Additionally, as the other hotels in the immediate area are at least eight miles awayfrom <strong>DIA</strong>, the proposed Subject is projected to benefit even more so. Given its interminalstatus, the proposed Subject is projected to achieve an occupancy levelabove the overall competitive market. Additionally, because the hotel will beaffiliated with Starwood as a Westin hotel <strong>and</strong> will be located at one of the mosthighly trafficked airports in the U.S., we are of the opinion that the proposed Subjectwill also achieve a premium in ADR. Our projections of occupancy <strong>and</strong> ADR for theproposed Subject are presented in the following paragraphs.G. PROJECTED PERFORMANCE OF THE PROPOSED SUBJECT1. OccupancyIn order to project the future occupancy levels of the proposed Subject, we haveestimated the level of patronage by market segment that can be reasonablycaptured. The extent to which the Subject can capture dem<strong>and</strong> from each marketsegment was estimated by performing a fair share penetration analysis.A hotel's fair share of the market is defined as the number of available rooms of theproposed Subject hotel divided by the total supply of available rooms in thecompetitive market, including the Subject. Factors indicating a hotel would possesscompetitive advantages suggest a market penetration in excess of 100 percent offair market share, while competitive weaknesses are reflected in penetration lessIV-37
The Westin Denver International Airport<strong>Hotel</strong> <strong>Market</strong> <strong>Analysis</strong>than 100 percent. We have formulated our assumptions <strong>and</strong> analysis on aprojected opening date of the hotel of August 1, 2015.Based on the expected attributes of the proposed Subject, we anticipate that it willhave various advantages within the market in location <strong>and</strong> in product quality. Asummary of the proposed Subject’s competitive advantages are presented in thefollowing statements.The proposed Subject will be a state-of-the-art, newly-built prototypefeaturing the latest in engineering, design, <strong>and</strong> innovation. Additionally, theproposed Subject will represent the newest upper upscale, full-service hotelin the Denver-Aurora lodging market <strong>and</strong> the highest quality hotel in theDenver Airport lodging market;The proposed Subject will be affiliated with Starwood <strong>Hotel</strong>s <strong>and</strong> Resorts <strong>and</strong>the Preferred Guest® reward program, which encompasses 850 hotelsworldwide. Furthermore, the Subject will benefit from the strong recognitionof the Westin hotel br<strong>and</strong> <strong>and</strong> will represent the only full service Starwoodaffiliated hotel in the Airport/East submarket;The proposed Subject will benefit from its designation as an in-terminal hotelat <strong>DIA</strong>, a central hub within the U.S. that represents one of the highesttrafficked airports nationwide. This central, strategic location will be asignificant advantage point with regard to attracting nationwide meetings <strong>and</strong>group dem<strong>and</strong> that can easily converge at <strong>DIA</strong> without the inefficiency <strong>and</strong>cost of having to commute from the airport to an alternate meeting <strong>and</strong>lodging venue.With plenty of room for expansion surrounding <strong>DIA</strong>, the proposed Subject isalso situated to benefit from any future growth that might occur. This is aunique situation when compared to other major airports with in-terminalhotels, which typically do not have room for runway, concourse, or gateexpansions.In review of the aforementioned competitive advantages affecting the proposedSubject <strong>and</strong> after our analysis of the competitive market, similar airport markets,<strong>and</strong>, more specifically, in-terminal hotels, we project that the proposed Subject canachieve a stabilized market penetration level of 106 percent, more than its fair shareof dem<strong>and</strong>. This results in a stabilized occupancy of 74 percent. During the firsttwo years of operation, we estimate the proposed Subject’s occupancy level to“ramp up” from 68 percent in 2015 to 72 percent in 2016 before stabilizing at 74percent in 2017. As previously stated, the in-terminal hotels that we analyzedthroughout the U.S. achieved an average occupancy of roundly 77 percent over thepast five years with the aggregate occupancy level ranging from a low of 72.2IV-38
The Westin Denver International Airport<strong>Hotel</strong> <strong>Market</strong> <strong>Analysis</strong>percent to a high of 80.2 percent from 2007 to 2011. However, prior to the severeeconomic downturn in 2008 <strong>and</strong> 2009, the average occupancy level for the interminalhotels was approximately 79 percent. These in-terminal hotels range insize from 237 rooms to 860 rooms with an average of 443 rooms. Based on theproposed Subject’s aforementioned advantages <strong>and</strong> its size at 519 rooms, we areof the opinion that a stabilized occupancy level of 74 percent is reasonable.The table on the following page summarizes our analysis of penetration by marketsegment <strong>and</strong> the resulting occupancy levels for the proposed Subject for the fiveyearperiod of 2015 to 2019. This penetration analysis is based on the identifiedcompetitive airport <strong>and</strong> downtown hotel market previously presented.IV-39
The Westin Denver International Airport<strong>Hotel</strong> <strong>Market</strong> <strong>Analysis</strong>The Westin Denver International Airport<strong>Market</strong> Penetration <strong>and</strong> Projected Occupancy2015 2016 2017 2018 2019 2020TOTAL ROOMS AVAILABLEThe Westin Denver International Airport 78,840 189,435 189,435 189,435 189,435 189,435Competitive <strong>Market</strong> 2,324,320 2,434,915 2,434,915 2,434,915 2,434,915 2,434,915==== ==== ==== ==== ==== ====Fair Share of Supply 3.4% 7.8% 7.8% 7.8% 7.8% 7.8%==== ==== ==== ==== ==== ====ESTIMATED TOTAL MARKET DEMANDTransient 828,400 870,600 871,400 872,100 872,900 873,700Group 720,600 755,100 755,800 756,500 757,200 757,800Contract/Crew 78,100 78,700 77,300 75,800 74,300 72,900------- ------- ------- ------- ------- -------TOTAL 1,627,100 1,704,400 1,704,500 1,704,400 1,704,400 1,704,400------- ------- ------- ------- ------- -------1,627,100 1,704,400 1,704,500 1,704,400 1,704,400 1,704,400FAIR SHARE OF DEMANDTransient 28,100 67,700 67,800 67,800 67,900 68,000Group 24,400 58,700 58,800 58,900 58,900 59,000Contract/Crew 2,600 6,100 6,000 5,900 5,800 5,700------- ------- ------- ------- ------- -------TOTAL 55,100 132,500 132,600 132,600 132,600 132,700------- ------- ------- ------- ------- -------SUBJECT PENETRATIONTransient 115% 121% 124% 127% 125% 125%Group 67% 70% 74% 70% 72% 72%Contract/Crew 200% 215% 222% 228% 229% 235%------- ------- ------- ------- ------- -------ROOM NIGHTS CAPTUREDTransient 32,300 82,000 84,100 86,200 84,900 85,000Group 16,400 41,100 43,500 41,200 42,400 42,400Contract/Crew 5,300 13,200 13,400 13,400 13,200 13,300------- ------- ------- ------- ------- -------TOTAL CAPTURED DEMAND 54,000 136,300 141,000 140,800 140,500 140,700==== ==== ==== ==== ==== ====MARKET SHARE CAPTURED 3.3% 8.0% 8.3% 8.3% 8.2% 8.3%OVERALL MARKET PENETRATION 98% 103% 106% 106% 106% 106%------- ------- ------- ------- ------- -------SUBJECT OCCUPANCY 68% 72% 74% 74% 74% 74%------- ------- ------- ------- ------- -------MARKET MIXTransient 60% 60% 60% 60% 60% 60%Group 30% 30% 30% 30% 30% 30%Contract/Crew 10% 10% 10% 10% 10% 10%------- ------- ------- ------- ------- -------TOTAL 100% 100% 100% 100% 100% 100%==== ==== ==== ==== ==== ====Source: <strong>PKF</strong> Consulting USAIV-40
The Westin Denver International Airport<strong>Hotel</strong> <strong>Market</strong> <strong>Analysis</strong>As previously presented, the comparable in-terminal hotels located throughout theU.S. <strong>and</strong> Canada achieved an average occupancy level of 77.2 percent over thepast five years, ranging from a low of 72.2 percent to a high of 80.2 percent. Astabilized occupancy level below the average annual occupancy of the in-terminalhotels is deemed reasonable for the proposed Subject given its size, which is largerthan most in-terminal hotels, as well as our projected ADR for the proposed Subject,which will be discussed in the following paragraphs. On a stabilized basis, weestimate the proposed Subject to receive approximately 60 percent of its dem<strong>and</strong>from the transient market segment, 30 percent of its dem<strong>and</strong> from the group marketsegment, <strong>and</strong> approximately 10 percent of its dem<strong>and</strong> from the contract/crewmarket segment.2. Projected Average Daily Room RateIn order to project the future ADR of the Subject, we first estimated a hypotheticalADR if the Subject were open as of year-end 2012. Based on our analysis of thecompetitive market, the performance of the surrounding Westin hotels locatedthroughout the Denver region, <strong>and</strong> the performance of other in-terminal hotelslocated throughout the U.S., we are of the opinion that the Subject could achieve ahypothetical ADR of $180 stated in 2012 value dollars. This would position theSubject above the estimated 2012 year-end ADR of the Westin Tabor Centerlocated in downtown Denver <strong>and</strong> above the Marriott Gateway <strong>and</strong> Embassy Suites,both of which are located proximate to the airport. This hypothetical ADR of $180would position the Subject below the Ritz-Carlton <strong>and</strong> the Four Seasons but abovethe remainder of the previously identified competitive market. In addition, this ratepositions the proposed Subject above the average of the comparable in-terminalairport hotels we evaluated throughout the U.S.After concluding to a hypothetical ADR, we then projected the ADR growth of themarket based on current trends. As previously discussed, the competitive marketexperienced an increase in ADR of 4.2 percent in 2010 <strong>and</strong> 2011. Through YTDJune 2012, ADR for the overall competitive market was relatively unchanged.Through year-end 2012, ADR is projected to increase modestly. Specifically, weproject ADR to increase 3.0 percent through year-end 2012. In 2013 <strong>and</strong> 2014,more aggressive rate growth of 7.0 <strong>and</strong> 6.0 percent, respectively, is projected as thelocal, national, <strong>and</strong> global economy continues to improve <strong>and</strong> properties achievetheir long-run average occupancy levels, thus giving way to an emphasis on ADRgrowth. Going forward, ADR growth is projected to taper to 5.0 percent in 2015, 4.0percent in 2016, <strong>and</strong> 3.0 percent per annum thereafter, which is in line with theassumed long-term outlook on inflation. This projected ADR growth would result inan ADR of $215 for the proposed Subject upon opening in 2015. However, as aresult of some discounting, which is expected as the proposed Subject is introducedinto the market, the Subject’s projected ADR in 2015 is expected to beapproximately $209.IV-41
The Westin Denver International Airport<strong>Hotel</strong> <strong>Market</strong> <strong>Analysis</strong>The proposed Subject will undoubtedly represent the most superior asset in theprimary competitive market. Due to the inferior product <strong>and</strong> location of the hotelscomprising the competitive airport lodging market, the proposed Subject is projectedto outperform these hotels. We project the proposed Subject to achieve an ADRlevel at the midpoint of the range indicated by the hotels comprising the competitivedowntown lodging market. Lastly, when benchmarked against other in-terminalhotels located throughout the U.S. <strong>and</strong> Canada, we project the proposed Subject toachieve an ADR at the high-end of the range as it will represent the newest state-ofthe-artin-terminal hotel located at one of the busiest airports in the U.S. with acentral location.The following table summarizes our estimated annual market performance for theSubject from 2015 through 2019, representing the first five years of operation.The Westin Denver International AirportProjected PerformanceHypothetical <strong>Market</strong> Introductory Actual Percent Subject <strong>Market</strong> <strong>Market</strong> PercentYear ADR Growth Discount ADR Change Occupancy Occupancy Penetration RevPAR Change2012 $180.00 - 0.0% $180.00 - - - - -2013 $193.00 7.0% 0.0% $193.00 7.0% - - - -2014 $205.00 6.0% 0.0% $205.00 6.0% - - - -2015¹ $215.00 5.0% 3.0% $209.00 2.0% 68% 72% 94% $142.12 -2016 $224.00 4.0% 0.0% $224.00 7.0% 72% 72% 100% $161.28 13.5%2017 $231.00 3.0% 0.0% $231.00 3.0% 74% 70% 105% $170.94 6.0%2018 $238.00 3.0% 0.0% $238.00 3.0% 74% 70% 105% $176.12 3.0%2019 $245.00 3.0% 0.0% $245.00 3.0% 74% 70% 105% $181.30 2.9%¹ Assumed opening of the proposed Subject on August 1, 2015Note: Numbers may not foot due to roundingSource: <strong>PKF</strong> Consulting USAAlthough it is possible that the Subject will experience growth in occupancy <strong>and</strong>ADRs above those estimated above, it is also possible that sudden economicdownturns, unexpected additions to room supply, or other external factors will forcethe property below the selected point of stability. Consequently, the estimatedoccupancy <strong>and</strong> ADR levels are representative of the most likely potential operationsof the Subject over the projection period based on our analysis of the market as ofthe date of this report.IV-42
SECTION VSTATEMENT OF ESTIMATED ANNUAL OPERATING RESULTS
The Westin Denver International AirportStatement of Estimated Annual Operating ResultsA. INTRODUCTIONIn the previous sections of this report, we have described the demographic <strong>and</strong>economic trends occurring in the Denver area. We have also provided a descriptionof the proposed hotel improvements <strong>and</strong> have determined the projected operatingoccupancy <strong>and</strong> average daily rate for the proposed 519-room Westin to be locatedat the south terminal of the Denver International Airport in Denver, Colorado. In thefollowing section, we provide an analysis of the projected financial operating resultsfor the proposed Subject over the first ten years of operation.The earnings stream most commonly used is the projected net operating income(“NOI”) from operations after the deduction of management fees, real estate taxes,insurance, <strong>and</strong> ground rent (if applicable), but before the deduction of interest,depreciation, amortization, <strong>and</strong> taxes on income which vary from owner to owner.Also deducted from the profit from operations is a reserve for capital improvementsto the property. As will be discussed in further detail, the projected NOI for theproposed Subject includes the deduction of a subordinate management fee <strong>and</strong>subordinate reserve for capital expenditures; however excludes a deduction forproperty taxes (as the owner is a government agency).The income expectancy used as a basis for our cash flow forecast is the anticipatedincome for a typical, or stabilized, year of operation, stated in current value dollars.The performance of the property in the stabilized year reflects the normal level oroperation of the hotel at its expected long-term stabilized occupancy (in the case ofthe Subject, 74 percent), unaffected by temporary non-recurring expenses such asextraordinary start-up marketing, administrative, or operation costs, which can occurin the initial years of a new hotel. Our cash flow projections for the first ten years ofoperation of the proposed Subject are based on this stabilized year estimate,adjusted to reflect such factors as changes in room rates, occupancy, inflation <strong>and</strong>the fixed <strong>and</strong> variable components of each revenue <strong>and</strong> expense item.The financial format used in our analysis of the hotel is the Uniform System ofAccounts for <strong>Hotel</strong>s, developed by the American <strong>Hotel</strong> & Motel Association <strong>and</strong> ingeneral uses throughout the hospitality industry. In conformity with this system ofaccount classifications, only direct operating expenses are charged to operatingdepartments of the hotel. The general overhead items which are applicable tooperations as a whole are classified as deductions from income <strong>and</strong> includeadministrative <strong>and</strong> general expenses, franchise fees, marketing expenses, propertyoperations <strong>and</strong> maintenance expenses, utility costs, <strong>and</strong> a reserve for replacement.V-1
The Westin Denver International AirportStatement of Estimated Annual Operating ResultsB. BASIS FOR CASH FLOW PROJECTIONSIn order to develop our estimate of the net operating income (cash flow) for theSubject for both a stabilized year of operation <strong>and</strong> for the first ten years of operationof the hotel, we have analyzed in detail the following:1) The 2011 year-end financial performance of six in-terminal hotels locatedthroughout North America deemed most comparable to the Subject interms of performance <strong>and</strong> size;2) The 2011 year-end financial performance of five Westin hotels locatedthroughout the U.S. deemed most comparable to the Subject in term ofperformance <strong>and</strong> size; <strong>and</strong>,3) Our general knowledge of the performance of upper upscale hotels in theDenver region.As stated, in order to develop our estimate of the NOI (cash flow) for the Subject forboth a stabilized year of operation <strong>and</strong> for the first ten years of operation, we haverelied upon the operating performance of in-terminal hotels located throughoutNorth American <strong>and</strong> five comparable Westin hotels located throughout the U.S.This information was obtained from confidential financial statements submitted incompilation of the 2012 edition (summarizing year-end 2011 data) of <strong>PKF</strong>Consulting’s publication Trends in the <strong>Hotel</strong> Industry. The hotels are generallycomparable due to their size, location, national affiliation, operating concept, <strong>and</strong>market orientation.The six in-terminal hotels range in size from 336 to 860 guestrooms. Occupanciesfor the comparable in-terminal hotels ranged from 74.5 to 85.2 percent, <strong>and</strong> ADRsranged from $109.65 to $167.46 in 2011. The gross operating profit (“GOP”),before the deduction management fees, property taxes, insurance, <strong>and</strong> reserve forcapital replacements, for the comparable in-terminal hotels ranged from 24.7 to 38.7percent of total revenue with an average of 36.6 percent. The NOI for thecomparable in-terminal hotels, after the deduction of a reserve for replacementexpense of four percent of gross revenues, ranged from 13.3 to 33.4 percent of totalrevenue, with an average of 26.5 percent. On the following two pages, we havesummarized the financial statements for these comparable in-terminal hotels. Forreasons of confidentiality, we have not disclosed the identity of the specific hotels.V-2
The Westin Denver International AirportStatement of Estimated Annual Operating ResultsThe Westin Denver International AirportOperating Results of Comparable In-Terminal <strong>Hotel</strong>s<strong>Hotel</strong> A <strong>Hotel</strong> B <strong>Hotel</strong> CRatio Per Room P.O.R. Ratio Per Room P.O.R. Ratio Per Room P.O.R.RevenuesRooms 75.2% $51,270 $167.46 70.5% $48,663 $160.19 60.0% $41,298 $132.85Food & Beverage 21.2% 14,432 47.14 26.4% 18,265 60.12 38.7% 26,592 85.54Other Operated Departments 3.2% 2,173 7.10 3.1% 2,142 7.05 0.7% 452 1.45Rentals <strong>and</strong> Other Income 0.4% 272 0.89 0.0% 0 0.00 0.7% 454 1.46Total Revenues 100.0% 68,146 222.58 100.0% 69,070 227.36 100.0% 68,797 221.30Departmental ExpensesRooms 31.2% 15,985 52.21 26.0% 12,655 41.66 26.9% 11,113 35.75Food & Beverage 72.4% 10,446 34.12 70.7% 12,916 42.52 77.5% 20,617 66.32Other Operated Departments 38.9% 846 2.76 74.4% 1,593 5.24 194.1% 878 2.82Total Departmental Expenses 40.0% 27,277 89.09 39.3% 27,164 89.42 47.4% 32,609 104.89Departmental Profit 60.0% 40,869 133.49 60.7% 41,906 137.94 52.6% 36,188 116.41Undistributed ExpensesAdministrative & General 8.1% 5,540 18.09 9.3% 6,449 21.23 10.3% 7,089 22.80<strong>Market</strong>ing (Including Franchise Fees) 6.2% 4,212 13.76 6.4% 4,388 14.44 6.9% 4,739 15.24Property Operation <strong>and</strong> Maintenance 3.3% 2,253 7.36 4.1% 2,829 9.31 5.5% 3,804 12.24Utility Costs 3.7% 2,494 8.15 3.5% 2,414 7.95 5.1% 3,537 11.38Total Undistributed Operating Expenses 21.3% 14,499 47.36 23.3% 16,080 52.93 27.9% 19,169 61.66Gross Operating Profit 38.7% 26,370 86.13 37.4% 25,826 85.01 24.7% 17,019 54.75Base Management Fee 2.5% 1,704 5.57 3.0% 2,072 6.82 3.9% 2,678 8.61Fixed ExpensesIncentive Management Fee 0.0% 0 0.00 1.3% 900 2.96 0.0% 0 0.00Property Taxes 0.1% 53 0.17 0.5% 335 1.10 2.6% 1,803 5.80Insurance 0.6% 431 1.41 0.5% 379 1.25 0.9% 613 1.97Total Fixed Expenses 0.7% 484 1.58 2.3% 1,615 5.32 3.5% 2,416 7.77Net Operating Income 35.5% 24,182 78.98 32.1% 22,139 72.88 17.3% 11,925 38.36FF&E Reserve/Capital Expenditures 4.0% 2,726 8.90 4.0% 2,763 9.09 4.0% 2,752 8.85Net Operating Income After Reserve 31.5% $21,456 $70.08 28.1% $19,376 $63.78 13.3% $9,173 $29.51Source: <strong>PKF</strong> Consulting USAV-3
The Westin Denver International AirportStatement of Estimated Annual Operating ResultsThe Westin Denver International AirportOperating Results of Comparable In-Terminal <strong>Hotel</strong>s<strong>Hotel</strong> D <strong>Hotel</strong> E <strong>Hotel</strong> FRatio Per Room P.O.R. Ratio Per Room P.O.R. Ratio Per Room P.O.R.RevenuesRooms 64.8% $35,968 $117.83 67.0% $50,539 $109.65 59.9% $39,751 $146.13Food & Beverage 33.3% 18,491 60.57 29.3% 22,096 47.94 33.7% 22,354 82.18Other Operated Departments 0.8% 451 1.48 3.7% 2,786 6.04 3.8% 2,515 9.25Rentals <strong>and</strong> Other Income 1.1% 623 2.04 0.0% 0 0.00 2.6% 1,695 6.23Total Revenues 100.0% 55,533 181.92 100.0% 75,421 163.63 100.0% 66,315 243.78Departmental ExpensesRooms 26.4% 9,513 31.16 25.6% 12,958 28.11 27.7% 11,014 40.49Food & Beverage 63.7% 11,782 38.60 59.9% 13,245 28.74 48.7% 10,895 40.05Other Operated Departments 49.4% 223 0.73 67.2% 1,871 4.06 32.8% 825 3.03Total Departmental Expenses 38.7% 21,518 70.49 37.2% 28,075 60.91 34.3% 22,735 83.57Departmental Profit 61.3% 34,015 111.43 62.8% 47,346 102.72 65.7% 43,581 160.21Undistributed ExpensesAdministrative & General 9.4% 5,233 17.14 9.0% 6,791 14.73 7.9% 5,206 19.14<strong>Market</strong>ing (Including Franchise Fees) 7.6% 4,227 13.85 6.1% 4,610 10.00 6.5% 4,287 15.76Property Operation <strong>and</strong> Maintenance 3.1% 1,718 5.63 5.8% 4,387 9.52 4.8% 3,212 11.81Utility Costs 3.9% 2,180 7.14 4.8% 3,656 7.93 2.0% 1,318 4.84Total Undistributed Operating Expenses 24.1% 13,358 43.76 25.8% 19,445 42.19 21.1% 14,023 51.55Gross Operating Profit 37.2% 20,657 67.67 37.0% 27,901 60.53 44.6% 29,558 108.66Base Management Fee 5.6% 3,091 10.13 3.0% 2,263 4.91 2.5% 1,658 6.09Fixed ExpensesIncentive Management Fee 0.0% 0 0.00 2.3% 1,728 3.75 0.0% 0 0.00Property Taxes 0.0% 0 0.00 0.8% 602 1.31 4.1% 2,721 10.00Insurance 0.5% 280 0.92 1.0% 772 1.67 0.6% 407 1.49Total Fixed Expenses 0.5% 280 0.92 4.1% 3,102 6.73 4.7% 3,127 11.50Net Operating Income 31.1% 17,286 56.63 29.9% 22,537 48.89 37.4% 24,773 91.07FF&E Reserve/Capital Expenditures 4.0% 2,221 7.28 4.0% 3,017 6.55 4.0% 2,653 9.75Net Operating Income After Reserve 27.1% $15,065 $49.35 25.9% $19,520 $42.35 33.4% $22,120 $81.32Source: <strong>PKF</strong> Consulting USAV-4
The Westin Denver International AirportStatement of Estimated Annual Operating ResultsAdditionally, in order to develop our estimate of the NOI (cash flow) for the Subjectfor both a stabilized year of operation <strong>and</strong> for the first ten years of operation, wehave relied upon the operating performance of five comparable Westin hotelslocated throughout the U.S. The five comparable Westin hotels range in size from337 to 430 guestrooms. Occupancies for the comparable Westin hotels rangedfrom 75.2 to 80.7 percent, <strong>and</strong> ADRs ranged from $137.79 to $218.73. The GOPfor the comparable Westin hotels ranged from 35.0 to 48.9 percent of total revenue.The NOI for the comparable Westin hotels, after the deduction of a reserve forreplacement expense of four percent of gross revenues, ranged from 24.3 to 34.0percent of total revenue. On the following two pages, we have summarized thefinancial statements for these comparable Westin hotels. For reasons ofconfidentiality, we have not disclosed the identity of the specific hotels. Theweighted average presented in the second table below includes the performance ofthe comparable in-terminal hotels.V-5
The Westin Denver International AirportStatement of Estimated Annual Operating ResultsThe Westin Denver International AirportOperating Results of Comparable Westin <strong>Hotel</strong>s<strong>Hotel</strong> G <strong>Hotel</strong> H <strong>Hotel</strong> IRatio Per Room P.O.R. Ratio Per Room P.O.R. Ratio Per Room P.O.R.RevenuesRooms 60.5% $39,167 $137.79 66.9% $46,144 $168.15 66.1% $64,420 $218.73Food & Beverage 34.5% 22,347 78.62 28.8% 19,888 72.47 30.3% 29,501 100.17Other Operated Departments 4.4% 2,861 10.07 3.5% 2,446 8.91 1.3% 1,258 4.27Rentals <strong>and</strong> Other Income 0.6% 375 1.32 0.7% 505 1.84 2.4% 2,306 7.83Total Revenues 100.0% 64,750 227.79 100.0% 68,983 251.37 100.0% 97,485 331.00Departmental ExpensesRooms 23.8% 9,314 32.77 20.8% 9,606 35.00 23.6% 15,202 51.62Food & Beverage 63.9% 14,281 50.24 66.7% 13,258 48.31 67.2% 19,825 67.31Other Operated Departments 73.2% 2,094 7.37 78.3% 1,915 6.98 108.3% 1,363 4.63Total Departmental Expenses 39.7% 25,689 90.37 35.9% 24,779 90.30 37.3% 36,390 123.56Departmental Profit 60.3% 39,061 137.41 64.1% 44,204 161.08 62.7% 61,095 207.44Undistributed ExpensesAdministrative & General 7.4% 4,776 16.80 9.0% 6,180 22.52 6.4% 6,259 21.25<strong>Market</strong>ing (Including Franchise Fees) 6.6% 4,262 14.99 12.9% 8,866 32.31 7.1% 6,963 23.64Property Operation <strong>and</strong> Maintenance 3.3% 2,135 7.51 3.6% 2,465 8.98 3.9% 3,849 13.07Utility Costs 2.9% 1,909 6.72 3.7% 2,545 9.27 2.2% 2,166 7.36Total Undistributed Operating Expenses 20.2% 13,082 46.02 29.1% 20,056 73.08 19.7% 19,237 65.32Gross Operating Profit 40.1% 25,979 91.39 35.0% 24,147 87.99 42.9% 41,858 142.13Base Management Fee 7.0% 4,511 15.87 1.0% 690 2.51 2.8% 2,770 9.40Fixed ExpensesIncentive Management Fee 0.0% 0 0.00 0.0% 0 0.00Property Taxes 0.0% 0 0.00 5.2% 3,611 13.16 5.5% 5,404 18.35Insurance 0.8% 545 1.92 0.4% 296 1.08 0.6% 580 1.97Total Fixed Expenses 0.8% 545 1.92 5.7% 3,908 14.24 6.1% 5,984 20.32Net Operating Income 32.3% 20,923 73.61 28.3% 19,550 71.24 34.0% 33,104 112.40FF&E Reserve/Capital Expenditures 4.0% 2,590 9.11 4.0% 2,759 10.05 4.0% 3,899 13.24Net Operating Income After Reserve 28.3% $18,333 $64.50 24.3% $16,791 $61.18 30.0% $29,205 $99.16Source: <strong>PKF</strong> Consulting USAV-6
The Westin Denver International AirportStatement of Estimated Annual Operating ResultsThe Westin Denver International AirportOperating Results of Comparable Westin <strong>Hotel</strong>s<strong>Hotel</strong> J <strong>Hotel</strong> K Weighted AverageRatio Per Room P.O.R. Ratio Per Room P.O.R. Ratio Per Room P.O.R.RevenuesRooms 66.6% $54,534 $194.29 79.5% $54,746 $196.49 66.7% $47,301 $156.93Food & Beverage 28.2% 23,115 82.35 17.1% 11,805 42.37 29.3% $20,750 $68.84Other Operated Departments 4.5% 3,647 12.99 3.4% 2,337 8.39 3.0% $2,116 $7.02Rentals <strong>and</strong> Other Income 0.6% 526 1.87 0.0% 0 0.00 1.0% $712 $2.36Total Revenues 100.0% 81,822 291.51 100.0% 68,888 247.25 100.0% $70,878 $235.16Departmental ExpensesRooms 20.3% 11,056 39.39 16.0% 8,769 31.47 24.7% $11,703 38.83Food & Beverage 65.2% 15,064 53.67 63.7% 7,524 27.00 64.3% $13,337 44.25Other Operated Departments 96.2% 3,507 12.49 77.0% 1,798 6.45 67.5% $1,429 4.74Total Departmental Expenses 36.2% 29,626 105.55 26.3% 18,090 64.93 37.3% $26,469 87.82Departmental Profit 63.8% 52,196 185.96 73.7% 50,798 182.32 62.7% $44,409 147.34Undistributed ExpensesAdministrative & General 8.7% 7,135 25.42 6.0% 4,124 14.80 8.2% $5,807 19.27<strong>Market</strong>ing (Including Franchise Fees) 7.6% 6,212 22.13 12.3% 8,464 30.38 7.7% $5,433 18.03Property Operation <strong>and</strong> Maintenance 3.4% 2,819 10.04 3.1% 2,133 7.66 4.1% $2,885 9.57Utility Costs 2.5% 2,014 7.17 3.4% 2,360 8.47 3.3% $2,321 7.70Total Undistributed Operating Expenses 22.2% 18,180 64.77 24.8% 17,081 61.31 23.2% $16,446 54.56Gross Operating Profit 41.6% 34,016 121.19 48.9% 33,717 121.01 39.5% $27,964 92.78Base Management Fee 2.9% 2,398 8.54 1.5% 1,046 3.75 3.1% $2,168 7.19Fixed ExpensesIncentive Management Fee 0.0% 0 0.00 0.8% 565 2.03 0.3% $238 0.79Property Taxes 2.3% 1,875 6.68 7.6% 5,265 18.90 2.9% $2,028 6.73Insurance 1.4% 1,166 4.15 0.9% 646 2.32 0.7% $529 1.75Total Fixed Expenses 3.7% 3,041 10.83 9.4% 6,477 23.24 3.6% $2,557 8.48Net Operating Income 34.9% 28,577 101.81 38.0% 26,194 94.01 32.8% $23,239 77.10FF&E Reserve/Capital Expenditures 4.0% 3,273 11.66 4.0% 2,756 9.89 4.0% $2,835 9.41Net Operating Income After Reserve 30.9% $25,305 $90.15 34.0% $23,439 $84.12 28.8% $20,404 $67.69Source: <strong>PKF</strong> Consulting USAV-7
The Westin Denver International AirportStatement of Estimated Annual Operating ResultsC. STABILIZED YEAR ESTIMATEAs indicated previously, in order to develop our cash flow forecast for the proposedWestin, we first have estimated the operating performance of the proposed Subjectfor a stabilized year of operation based on our review of the performance of thecomparable in-terminal <strong>and</strong> Westin hotels <strong>and</strong> our knowledge of the performance ofupper upscale hotels in the local market area. It should be noted that our stabilized,or representative, year estimate detailed in the following paragraphs is stated incalendar-year value dollars beginning January 1, 2012 <strong>and</strong> ending December 31,2012.1. Departmental Revenues <strong>and</strong> ExpensesIn the Uniform System of Accounts for the Lodging Industry, revenues of the facilityare categorized by the department from which they are derived. In the case of theSubject, these include income from rooms, food <strong>and</strong> beverage, other operateddepartments, <strong>and</strong> rentals <strong>and</strong> other income. In the Uniform System of Accounts for<strong>Hotel</strong>s, only direct operating expenses associated with each department arecharged to the operating departments. General overhead items that are applicableto the overall operation of the facility are classified as undistributed operatingexpenses.Direct or departmental revenues <strong>and</strong> expenses, which typically vary withoccupancy, are generally analyzed on a per-occupied-room (POR) basis, whichvaries with occupancy, while undistributed expenses, which are more fixed innature, are typically analyzed on total expense or a per-available-room (PAR) basis.a. Rooms Revenue <strong>and</strong> ExpenseRooms revenue is based on the number of occupied rooms multiplied by the ADRfor each respective year as presented in Section IV of this report. We estimate thatthe long-term stabilized occupancy rate of the Subject would be 74 percent with anADR equal to $200 stated in 2012 value dollars. This ADR of $200 stated in 2012value dollars is determined by discounting (deflating) the future ADR of theproposed Subject on a stabilized basis (approximately $284 in 2024) at 3.0 percentannually to 2012.519 Rooms x 365 Days x 74% Occupancy x $200 Room Rate = $28,036,000Rooms expense consists of salaries <strong>and</strong> wages, employee benefits, commissions,contract cleaning, guest transportation, laundry <strong>and</strong> dry cleaning, linen, operatingsupplies, reservation costs, uniforms, <strong>and</strong> other items related to the roomsdepartment. Presented in the following table are the historical rooms expenses ofthe comparable hotels.V-8
The Westin Denver International AirportStatement of Estimated Annual Operating ResultsRooms ExpensePer OccupiedRoomRatio to RmsRevenueIn-Terminal <strong>Hotel</strong>s<strong>Hotel</strong> A $52.21 31.2%<strong>Hotel</strong> B 41.66 26.0%<strong>Hotel</strong> C 35.75 26.9%<strong>Hotel</strong> D 31.16 26.4%<strong>Hotel</strong> E 28.11 25.6%<strong>Hotel</strong> F 40.49 27.7%Westin <strong>Hotel</strong>s<strong>Hotel</strong> G $32.77 23.8%<strong>Hotel</strong> H 35.00 20.8%<strong>Hotel</strong> I 51.62 23.6%<strong>Hotel</strong> J 39.39 20.3%<strong>Hotel</strong> K 31.47 16.0%Weighted Average 38.83 24.7%Subject Stabilized Year $42.00 21.0%The comparable hotels achieved rooms expense between $28.11 <strong>and</strong> $52.21 PORwith a weighted average of $38.83, or 24.7 percent of rooms revenue. For astabilized year of operation, we project rooms expense of $42.00 POR, or 21.0percent of rooms revenue. Our estimate falls within the range of the comparablehotels on a POR <strong>and</strong> ratio basis. It should be noted that our ratio to rooms revenueis at the lower end of the range as the proposed Subject is projected to achievehigher room revenues in a stabilized year of operation due to our projected ADR.b. Food <strong>and</strong> Beverage Revenue <strong>and</strong> ExpenseFood <strong>and</strong> Beverage Revenues will be generated by sales in the restaurant <strong>and</strong>lounge, as well as through room service <strong>and</strong> banquets <strong>and</strong> catering. As previouslystated, while the proposed Subject will have a second restaurant located on themain terminal level (Level 5), this restaurant will be independently controlled by <strong>DIA</strong>such that no food <strong>and</strong> beverage revenue (or restaurant lease income) will passthrough the Subject hotel. Presented in the following table are the historical food<strong>and</strong> beverage revenues of the comparable hotels.V-9
The Westin Denver International AirportStatement of Estimated Annual Operating ResultsFood & Beverage RevenueTotal Amount Per Occupied RoomIn-Terminal <strong>Hotel</strong>s<strong>Hotel</strong> A $8,644,505 $47.14<strong>Hotel</strong> B 7,634,817 60.12<strong>Hotel</strong> C 11,833,408 85.54<strong>Hotel</strong> D 6,212,911 60.57<strong>Hotel</strong> E 7,424,159 47.94<strong>Hotel</strong> F $19,224,327 82.18Westin <strong>Hotel</strong>s<strong>Hotel</strong> G $9,028,241 78.62<strong>Hotel</strong> H 8,551,741 72.47<strong>Hotel</strong> I 12,508,359 100.17<strong>Hotel</strong> J 7,789,645 82.35<strong>Hotel</strong> K 4,792,990 42.37Weighted Average N/A 68.84Subject Stabilized Year $11,915,000 $85.00The comparable hotels indicated a range in food <strong>and</strong> beverage revenue of between$42.37 <strong>and</strong> $100.17 POR. For a stabilized year of operation, we estimate food <strong>and</strong>beverage revenue at the proposed Subject to be approximately $85.00 POR, or atotal of $11,915,000, stated in 2012 value dollars. Our estimate falls within therange indicated by the comparable hotels. Furthermore, based on 29,000 squarefeet of meeting space, our estimate indicates that approximately $410 of food <strong>and</strong>beverage revenue will be generated per square foot of meeting space. This is inline with the food <strong>and</strong> beverage revenue generated on a price per square foot basisof the comparable hotels <strong>and</strong> reflects the fact that the Subject, with approximately30 percent of its dem<strong>and</strong> from the group segment, is projected to be a popularvenue for group meetings <strong>and</strong> banquet functions given its strategic location.Food <strong>and</strong> beverage expense includes product costs, payroll <strong>and</strong> relatedexpenses, <strong>and</strong> other items such as laundry <strong>and</strong> linen, china, glassware <strong>and</strong>silverware, uniform costs, supplies, <strong>and</strong> other miscellaneous items. Presented inthe following table are the historical food <strong>and</strong> beverage expenses of the comparablehotels.V-10
The Westin Denver International AirportStatement of Estimated Annual Operating ResultsFood & Beverage ExpenseRatio to F&B Rev.In-Terminal <strong>Hotel</strong>s<strong>Hotel</strong> A 72.4%<strong>Hotel</strong> B 70.7%<strong>Hotel</strong> C 77.5%<strong>Hotel</strong> D 63.7%<strong>Hotel</strong> E 59.9%<strong>Hotel</strong> F 48.7%Westin <strong>Hotel</strong>s<strong>Hotel</strong> G 63.9%<strong>Hotel</strong> H 66.7%<strong>Hotel</strong> I 67.2%<strong>Hotel</strong> J 65.2%<strong>Hotel</strong> K 63.7%Weighted Average 64.3%Subject Stabilized Year 65.0%Food <strong>and</strong> beverage expense at the Subject is estimated to be approximately 65.0percent of departmental revenue. As noted, our estimate is in line with the food <strong>and</strong>beverage expense ratio of the weighted average of the comparable hotels <strong>and</strong> isdeemed reasonable based on the high percentage of banquet food, beverage <strong>and</strong>meeting space rental revenues.c. Other Operated Departments Revenue <strong>and</strong> ExpenseOther operated departments revenue primarily includes revenue fromtelecommunications services (phone <strong>and</strong> Internet), business services, guest laundryservices, in-room movies, <strong>and</strong> other miscellaneous items. Presented in thefollowing table are the historical other operated departments revenue for thecomparable hotels.V-11
The Westin Denver International AirportStatement of Estimated Annual Operating ResultsOther Operated Departments RevenuePer Occupied RoomIn-Terminal <strong>Hotel</strong>s<strong>Hotel</strong> A $7.10<strong>Hotel</strong> B 7.05<strong>Hotel</strong> C 1.45<strong>Hotel</strong> D 1.48<strong>Hotel</strong> E 6.04<strong>Hotel</strong> F 9.25Westin <strong>Hotel</strong>s<strong>Hotel</strong> G $10.07<strong>Hotel</strong> H 8.91<strong>Hotel</strong> I 4.27<strong>Hotel</strong> J 12.99<strong>Hotel</strong> K 8.39Weighted Average 7.02Subject Stabilized Year $3.00The comparable hotels indicated a range in other operated departments revenue ofbetween $1.45 <strong>and</strong> $12.99 POR, with an average of $7.02. Focusing primarily onthe performance of the in-terminal hotels, we estimate other operated departmentsrevenue at the proposed Subject to be $3.00 POR for a stabilized year of operation.This equates to projected revenues of $461,000 for the Subject’s first full year ofoperation (2016).Other operated departments expense primarily includes expenses associatedwith other operated departments revenues. Presented in the following table are thehistorical other operated departments expenses of the comparable hotels.V-12
The Westin Denver International AirportStatement of Estimated Annual Operating ResultsOther Operated Departments ExpenseRatio to O.O.D. Rev.In-Terminal <strong>Hotel</strong>s<strong>Hotel</strong> A 38.9%<strong>Hotel</strong> B 74.4%<strong>Hotel</strong> C 194.1%<strong>Hotel</strong> D 49.4%<strong>Hotel</strong> E 67.2%<strong>Hotel</strong> F 32.8%Westin <strong>Hotel</strong>s<strong>Hotel</strong> G 73.2%<strong>Hotel</strong> H 78.3%<strong>Hotel</strong> I 108.3%<strong>Hotel</strong> J 96.2%<strong>Hotel</strong> K 77.0%Weighted Average 67.5%Subject Stabilized Year 80.0%Based on our projections of departmental revenue in this department, we estimateother operated departments expense to be 80.0 percent of departmental revenuefor a stabilized year of operation. Our estimate falls within the range indicated bythe comparable hotels.d. Rentals <strong>and</strong> Other IncomeRentals <strong>and</strong> other income primarily include revenue from space rental,commissions, attrition <strong>and</strong> cancellation fees, <strong>and</strong> miscellaneous income. Presentedin the following table are the historical rentals <strong>and</strong> other income of the comparablehotels.V-13
The Westin Denver International AirportStatement of Estimated Annual Operating ResultsRentals <strong>and</strong> Other IncomePer Occupied Room Per DayIn-Terminal <strong>Hotel</strong>s<strong>Hotel</strong> A $0.89 $446<strong>Hotel</strong> B 0.00 0<strong>Hotel</strong> C 1.46 554<strong>Hotel</strong> D 2.04 574<strong>Hotel</strong> E 0.00 0<strong>Hotel</strong> F 6.23 3,993Westin <strong>Hotel</strong>s<strong>Hotel</strong> G $1.32 $415<strong>Hotel</strong> H 1.84 595<strong>Hotel</strong> I 7.83 2,679<strong>Hotel</strong> J 1.87 486<strong>Hotel</strong> K 0.00 0Weighted Average 2.36 1,948Subject Stabilized Year $2.00 $768As noted, the comparable hotels indicated rentals <strong>and</strong> other income rangingbetween $0.00 <strong>and</strong> $7.83. For a stabilized year of operation, we estimate rentals<strong>and</strong> other income to be $2.00 POR for the proposed Subject, which equates torevenue of $307,000 in the first full year operation.2. Undistributed Operating ExpensesOperating expenses that are not chargeable to a particular operating departmentare presented as undistributed operating expenses, in accordance with the UniformSystem of Accounts for the Lodging Industry. These expenses includeadministrative <strong>and</strong> general, marketing, property operation <strong>and</strong> maintenance, <strong>and</strong>utilities. These expenses are relatively unaffected by fluctuations in occupancies<strong>and</strong> room rates. These expenses are typically analyzed on a dollar amount peravailable room basis.V-14
The Westin Denver International AirportStatement of Estimated Annual Operating Resultsa. Administrative <strong>and</strong> GeneralThis category includes the salary <strong>and</strong> wages of the general manager <strong>and</strong> officestaff, cash overages <strong>and</strong> shortages, credit card commissions, bad debt expense,security, accounting expense, <strong>and</strong> office supplies. Presented in the following tableare the historical administrative <strong>and</strong> general expenses of the comparable hotels.Administrative <strong>and</strong> GeneralPer Available Room Ratio to Total Rev.In-Terminal <strong>Hotel</strong>s<strong>Hotel</strong> A $5,540 8.1%<strong>Hotel</strong> B 6,449 9.3%<strong>Hotel</strong> C 7,089 10.3%<strong>Hotel</strong> D 5,233 9.4%<strong>Hotel</strong> E 6,791 9.0%<strong>Hotel</strong> F 5,206 7.9%Westin <strong>Hotel</strong>s<strong>Hotel</strong> G $4,776 7.4%<strong>Hotel</strong> H 6,180 9.0%<strong>Hotel</strong> I 6,259 6.4%<strong>Hotel</strong> J 7,135 8.7%<strong>Hotel</strong> K 4,124 6.0%Weighted Average 5,807 8.2%Subject Stabilized Year $5,975 7.6%The comparable hotels indicated historical administrative <strong>and</strong> general expenses ofbetween $4,124 <strong>and</strong> $7,135 PAR with a weighted average of $5,807, or 8.2 percentof total revenues. For a stabilized year of operation, we estimate administrative <strong>and</strong>general expense at the proposed Subject to be $5,975 PAR, or 7.6 percent of totalrevenues. Included in this expense are the variable costs of credit cardcommissions, which are estimated to be approximately 2.5 percent of totalrevenues. Our estimate is in line with the weighted average of the comparablehotels on a PAR basis <strong>and</strong> slightly lower on ratio basis.b. <strong>Market</strong>ingThis expense includes the cost of advertising, printing of brochures, salaryassociated with sales <strong>and</strong> marketing personnel, <strong>and</strong> other costs associated with anongoing sales <strong>and</strong> promotion program. Also included in this department are thecosts associated with the Starwood national chain marketing costs. Presented inthe following table are the historical marketing expenses of the comparable hotels.V-15
The Westin Denver International AirportStatement of Estimated Annual Operating Results<strong>Market</strong>ingPer Available Room Ratio to Total Rev.In-Terminal <strong>Hotel</strong>s<strong>Hotel</strong> A $4,212 6.2%<strong>Hotel</strong> B 4,388 6.4%<strong>Hotel</strong> C 4,739 6.9%<strong>Hotel</strong> D 4,227 7.6%<strong>Hotel</strong> E 4,610 6.1%<strong>Hotel</strong> F 4,287 6.5%Westin <strong>Hotel</strong>s<strong>Hotel</strong> G $4,262 6.6%<strong>Hotel</strong> H 8,866 12.9%<strong>Hotel</strong> I 6,963 7.1%<strong>Hotel</strong> J 6,212 7.6%<strong>Hotel</strong> K 8,464 12.3%Weighted Average 5,433 7.7%Subject Stabilized Year $5,700 7.3%<strong>Market</strong>ing expense for the comparable hotels ranged from $4,212 to $8,866 PAR.As indicated, the marketing expense for the in-terminal hotels is generally lowerthan the comparable Westin hotels. For a stabilized year of operation, we estimatemarketing expense of $5,700 PAR or 7.3 percent of total revenues for the proposedSubject. Our estimate is in line with the weighted average of the comparable hotelson a PAR <strong>and</strong> ratio basis.c. Property Operations <strong>and</strong> MaintenanceProperty operations <strong>and</strong> maintenance (POM) expense is a function of building age<strong>and</strong> usage. This expense category is comprised of engineering salaries, wages,employee benefits, normal maintenance of the building, normal maintenance ofelectrical, mechanical, <strong>and</strong> refrigeration equipment, <strong>and</strong> other operating supplies.Presented in the following table are the historical POM expenses of the comparablehotels.V-16
The Westin Denver International AirportStatement of Estimated Annual Operating ResultsProperty Operation <strong>and</strong> MaintenancePer Available Room Ratio to Total Rev.In-Terminal <strong>Hotel</strong>s<strong>Hotel</strong> A $2,253 3.3%<strong>Hotel</strong> B 2,829 4.1%<strong>Hotel</strong> C 3,804 5.5%<strong>Hotel</strong> D 1,718 3.1%<strong>Hotel</strong> E 4,387 5.8%<strong>Hotel</strong> F 3,212 4.8%Westin <strong>Hotel</strong>s<strong>Hotel</strong> G $2,135 3.3%<strong>Hotel</strong> H 2,465 3.6%<strong>Hotel</strong> I 3,849 3.9%<strong>Hotel</strong> J 2,819 3.4%<strong>Hotel</strong> K 2,133 3.1%Weighted Average 2,885 4.1%Subject Stabilized Year $2,800 3.6%For a stabilized year of operation, POM expense is projected to be $2,800 PAR, or3.6 percent of total revenues. Based on our experience of evaluating new fullservicehotels, we are of the opinion that our estimate for the proposed Subject isreasonable. Our estimate is in line with the weighted average of the comparablehotels on a PAR <strong>and</strong> ratio basis.d. Utility CostsUtility cost includes electricity, gas, water, <strong>and</strong> steam. These costs vary amonghotels given the different building characteristics, HVAC systems, <strong>and</strong> building age.Presented in the following table are the historical utility costs of the comparablehotels.V-17
The Westin Denver International AirportStatement of Estimated Annual Operating ResultsUtility CostsPer Available Room Ratio to Total Rev.In-Terminal <strong>Hotel</strong>s<strong>Hotel</strong> A $2,494 3.7%<strong>Hotel</strong> B 2,414 3.5%<strong>Hotel</strong> C 3,537 5.1%<strong>Hotel</strong> D 2,180 3.9%<strong>Hotel</strong> E 3,656 4.8%<strong>Hotel</strong> F 1,318 2.0%Westin <strong>Hotel</strong>s<strong>Hotel</strong> G $1,909 2.9%<strong>Hotel</strong> H 2,545 3.7%<strong>Hotel</strong> I 2,166 2.2%<strong>Hotel</strong> J 2,014 2.5%<strong>Hotel</strong> K 2,360 3.4%Weighted Average 2,321 3.3%Subject Stabilized Year $2,500 3.2%Utility costs are generally particular to the location, climate, <strong>and</strong> type of hotelstructure. Placing primary reliance on the comparable Westin hotels, we estimateutility costs to be $2,500 PAR, or 3.2 percent of total revenues. Furthermore, ourestimate is in line with the weighted average of the comparable in-terminal hotels ona PAR <strong>and</strong> ratio basis.3. Management Fees <strong>and</strong> Fixed Chargesa. Base <strong>and</strong> Subordinate Management FeesAs previously discussed, we have been provided with a QMA between the City <strong>and</strong>County of Denver, on behalf of the Denver International Airport, <strong>and</strong> Starwood<strong>Hotel</strong>s <strong>and</strong> Resorts (“Starwood”). This analysis assumes that the proposed Subjectwill be operated by Starwood under the Westin br<strong>and</strong>. Based on our currentforecast, base management fees are projected to be $1,220,000, or 3.0 percent oftotal revenues, for a stabilized year of operation.Subordinate management fees are payable below the NOI line. For a stabilizedyear of operation, we estimate subordinate management fees of $407,000. Ourcalculation of both base <strong>and</strong> subordinate management fees over the first ten yearsof operation for the proposed Subject is presented in the following table.V-18
The Westin Denver International AirportStatement of Estimated Annual Operating ResultsFee Basedon 500RoomsManagement Fees Per the Qualified Management AgreementBase Management FeeSubordinate Management FeeFee Basedon 519RoomsFee Basedon 500RoomsFee Basedon 519RoomsPerFeesPerFeesYearRoom(Rounded)Room(Rounded)2015 $659,257 $1,319 $684,309 $285,000 $0 $0 $0 $02016 $759,267 $1,519 $788,119 $728,000 $189,817 $380 $197,030 $82,0002017 $1,271,429 $2,543 $1,319,743 $1,010,000 $211,905 $424 $219,957 $207,0002018 $1,305,994 $2,612 $1,355,622 $1,335,000 $435,331 $871 $451,874 $317,0002019 $1,348,496 $2,697 $1,399,739 $1,374,000 $449,499 $899 $466,580 $458,0002020 $1,387,371 $2,775 $1,440,091 $1,417,000 $462,457 $925 $480,030 $472,0002021 $1,434,654 $2,869 $1,489,171 $1,461,000 $478,218 $956 $496,390 $487,0002022 $1,470,496 $2,941 $1,526,375 $1,505,000 $490,165 $980 $508,791 $502,0002023 $1,514,773 $3,030 $1,572,334 $1,546,000 $504,924 $1,010 $524,111 $515,0002024 $1,559,527 $3,119 $1,618,789 $1,592,000 $519,842 $1,040 $539,596 $531,000In total, management fees are stated at 3.7 percent of total revenues, within thetypical range of total management fees for an asset such as the proposed Subject.b. Real Estate <strong>and</strong> Property TaxesBased on our conversations with the representatives of the Denver InternationalAirport, as the Subject will be owned by a government agency, it will not be requiredto pay property taxes. As such, we have not modeled a property tax expense intoour projections.c. InsuranceInsurance expense at the proposed Subject is for both general liability <strong>and</strong> propertycoverage. Presented in the following table are the insurance expenses of thecomparable hotels.V-19
The Westin Denver International AirportStatement of Estimated Annual Operating ResultsInsurancePer Available RoomIn-Terminal <strong>Hotel</strong>s<strong>Hotel</strong> A $431<strong>Hotel</strong> B 379<strong>Hotel</strong> C 613<strong>Hotel</strong> D 280<strong>Hotel</strong> E 772<strong>Hotel</strong> F 407Westin <strong>Hotel</strong>s<strong>Hotel</strong> G $545<strong>Hotel</strong> H 296<strong>Hotel</strong> I 580<strong>Hotel</strong> J 1,166<strong>Hotel</strong> K 646Weighted Average 529Subject Stabilized Year $750The comparable hotels indicated a wide range of insurance expense between $296<strong>and</strong> $1,166 PAR. For a stabilized year of operation, we project insurance expensefor the proposed Subject to be $750 PAR, slightly above average of all of thecomparable hotels.d. Reserves for ReplacementsAn additional item not typically listed on an owner’s income statement is the amountrequired for the periodic replacement of certain short-lived items such as carpeting,draperies, <strong>and</strong> other furniture, fixtures <strong>and</strong> equipment. The QMA stipulates areserve for capital expenditures of 1.0 percent of total revenues during the firsttwelve months of operation, ramping up to 6.0 percent of total revenues in the fifthtwelve-month period <strong>and</strong> thereafter. Additionally, the QMA stipulates a subordinatereserve for capital expenditures, which falls below the NOI line. During the first fouryears of operation, the stipulated reserve is 0.0 percent of total revenues, rampingup to 3.0 percent in the eighth year <strong>and</strong> thereafter. The following table summarizesthe increase in reserves for the proposed Subject.V-20
The Westin Denver International AirportStatement of Estimated Annual Operating ResultsReserves for Capital Expenditures Per the Qualified Management AgreementSenior CapEx ReserveSubordinate CapEx ReserveSeniorCapExReserveSubordinateCapExReserveFiscal Year FeesFiscal Year Fees12-Month PeriodYear Conversion (Rounded) 12-Month PeriodYear Conversion (Rounded)First 12 months 1.0% 2015 1.0% $165,000 First 12 months 0.0% 2015 0.0% $0Second 12 months 2.0% 2016 1.0% $444,000 Second 12 months 0.0% 2016 0.0% $0Third 12 months 3.0% 2017 2.0% $940,000 Third 12 months 0.0% 2017 0.0% $0Fourth 12 months 5.0% 2018 4.0% $1,937,000 Fourth 12 months 0.0% 2018 0.0% $0Fifth 12 months 6.0% 2019 5.0% $2,493,000 Fifth 12 months 1.0% 2019 0.0% $0Sixth 12 months 6.0% 2020 6.0% $3,078,000 Sixth 12 months 1.5% 2020 1.0% $513,000Seventh 12 months 6.0% 2021 6.0% $3,175,000 Seventh 12 months 2.0% 2021 2.0% $1,058,000Eighth 12 months 6.0% 2022 6.0% $3,271,000 Eighth 12 months 3.0% 2022 2.0% $1,090,000Ninth 12 months 6.0% 2023 6.0% $3,369,000 Ninth 12 months 3.0% 2023 3.0% $1,685,000Tenth 12 months 6.0% 2024 6.0% $3,468,000 Tenth 12 months 3.0% 2024 3.0% $1,734,000V-21
The Westin Denver International AirportStatement of Estimated Annual Operating ResultsFor a stabilized year of operation, a senior capital expenditure reserve of six percentof total revenues <strong>and</strong> subordinate capital expenditure reserve of three percent oftotal revenues is projected for the proposed Subject.D. STABILIZED YEAR OPERATING RESULTSPresented on page V-20 is an estimate of the Subject’s stabilized year operatingresults expressed in 2012 value dollars, which is based on our foregoing analysis.For this 12-month period, revenues are projected to total approximately$40,652,000. Gross operating profit, which does not include property taxes,insurance, base management fees, or reserves for replacements, totalsapproximately $17,874,000, or 44.0 percent of total revenues, within the rangeindicated by the comparable Westin hotels <strong>and</strong> slightly above the range indicated bythe comparable in-terminal hotels. Operating income after the deduction of basemanagement fees, insurance, property taxes, <strong>and</strong> reserves for replacements totals$13,826,000 or 34.0 percent of total revenues. Furthermore, operating income afterthe deduction of a subordinate base management fee <strong>and</strong> subordinate reserve forcapital expenditures totals $12,199,000, or 30.0 percent of total revenues.V-22
The Westin Denver International AirportStatement of Estimated Annual Operating ResultsThe Westin Denver International AirportRepresentative Year of OperationStated in 2012 DollarsNumber of Units: 519Number of Annual Rooms Available: 189,435Number of Rooms Occupied: 140,182Annual Occupancy: 74.0%Average Daily Rate: $200.00Revenue Per Available Room: $148.00Amount Ratio Per Room P.O.R.RevenuesRooms $28,036,000 69.0% $54,019 $200.00Food & Beverage 11,915,000 29.3% 22,958 85.00Other Operated Departments 421,000 1.0% 811 3.00Rentals <strong>and</strong> Other Income 280,000 0.7% 539 2.00Total Revenues 40,652,000 100.0% 78,328 289.99Departmental ExpensesRooms 5,888,000 21.0% 11,345 42.00Food & Beverage 7,745,000 65.0% 14,923 55.25Other Operated Departments 336,000 79.8% 647 2.40Total Departmental Expenses 13,969,000 34.4% 26,915 99.65Departmental Profit 26,683,000 65.6% 51,412 190.35Undistributed ExpensesAdministrative & General 3,100,000 7.6% 5,973 22.11<strong>Market</strong>ing 2,958,000 7.3% 5,699 21.10Property Operation <strong>and</strong> Maintenance 1,453,000 3.6% 2,800 10.37Utility Costs 1,298,000 3.2% 2,501 9.26Total Undistributed Operating Expenses 8,809,000 21.7% 16,973 62.84Gross Operating Profit 17,874,000 44.0% 34,439 127.51Base Management Fee 1,220,000 3.0% 2,351 8.70Fixed ExpensesProperty Taxes 0 0.0% 0 0.00Insurance 389,000 1.0% 750 2.77Total Fixed Expenses 389,000 1.0% 750 2.77Net Operating Income 16,265,000 40.0% 31,339 116.03FF&E Reserve 2,439,000 6.0% 4,699 17.40Net Operating Income After Reserve 13,826,000 34.0% 26,640 98.63Subordinate FeesSubordinate Management Fee 407,000 1.0% 797 $3Subordinate CapEx Reserve 1,220,000 3.0% 2,366 $9Total Senior Fees 1,627,000 4.0% 3,163 $12Net Operating Income After Subordinate Fees $12,199,000 30.0% 23,505 $87.02Source: <strong>PKF</strong> Consulting USAV-23
The Westin Denver International AirportStatement of Estimated Annual Operating ResultsE. ESTIMATED ANNUAL OPERATING RESULTS FOR THE HOLDINGPERIODThe previous analysis provided for the income <strong>and</strong> expenses incurred in theoperation of the Subject in a hypothetical stabilized year of operation stated in 2012value dollars. In the following analysis, we provide estimated income <strong>and</strong> expensesfor the Subject during each year of the holding period anticipated by a typicalinvestor. The estimate of the performance for the Subject in the base year is usedas a basis for our analysis, adjusted to reflect the effects of inflation, businessdevelopment, <strong>and</strong> variations in occupancy.1. Holding PeriodIn the 2012 issue of the <strong>PKF</strong> Consulting’s publication Hospitality Investment Survey,the average holding period for investors interviewed for full-service hotels is 6.8years, with a range of between 4.0 <strong>and</strong> 15.0 years. The Summer 2012 InvestorSurvey published by Real Estate Research Corporation indicates a typicalprojection (holding) period of 7.5 years.Based on the foregoing investor surveys, but relying more on our experienceregarding hotel acquisitions, we have utilized a ten-year holding period,representing the period from August 1, 2015 to December 31, 2024. While we arenot assuming a sale of the asset, we have opted to reflect a ten-year period for thepurpose of this economic analysis. It should be noted that the first year of ourprojections reflects a five month “stub” year, or the period from opening on August 1to the end of the calendar year on December 31. All future years reflect a full,twelve month calendar year.2. InflationTo portray price level changes, we have assumed an inflation rate of three percentthroughout the holding period. This rate reflects the consensus of several wellrecognizedeconomists for the current long-term outlook pertaining to the futuremovement of prices <strong>and</strong> is consistent with the inflation rates of the last five years.All revenues <strong>and</strong> expenses are projected to increase at three percent.It should be noted that inflation is caused by many factors, <strong>and</strong> unanticipated events<strong>and</strong> circumstances can affect the forecasted rate. Therefore, the estimatedoperating results computed over the projection period will vary from the actualoperating results, <strong>and</strong> the variations may be material. Our assumption of an annualthree percent inflation factor portrays an expected long-term trend in pricemovements over the projection period rather than a point in time. This level ofinflation is comparable to the compound annual change in the Consumer PriceIndex (CPI) for U.S. Cities since 1990 as shown in the following table.V-24
The Westin Denver International AirportStatement of Estimated Annual Operating ResultsU. S. CitiesAverage Increase in Consumer Price Index (CPI)1990 to 2011Year CPI Percent Change1990 130.7 -1991 136.2 4.2%1992 140.3 3.0%1993 144.5 3.0%1994 148.2 2.6%1995 152.4 2.8%1996 156.9 3.0%1997 160.5 2.3%1998 163.0 1.6%1999 166.6 2.2%2000 172.2 3.4%2001 177.1 2.8%2002 179.9 1.6%2003 184.0 2.3%2004 188.9 2.7%2005 195.3 3.4%2006 201.6 3.2%2007 207.3 2.8%2008 215.3 3.9%2009 214.5 -0.4%2010 218.1 1.7%2011 224.9 3.1%CAGR 2.6% -2012(F) 229.6 2.1%2013(F) 234.7 2.2%2014(F) 241.5 2.9%Source: U.S. Department of Labor StatisticsNote: CPI forecast provided by Moody’s AnalyticsAs noted by the table above, while inflation rates have been lower over the past fiveyears, future inflationary growth is projected to increase back closer toapproximately three percent per year by 2014. While there is some uncertaintyabout the future growth of inflation over the long term, many groups that we haveworked with that are institutional investors in hotels continue to utilize a long termgrowth rate of three percent. Therefore, for the purpose of this analysis, we haveutilized a long term growth rate of three percent in our analysis.3. ADR <strong>and</strong> Occupancy during the Holding PeriodFor the first year of our ten-year forecast, we project the Subject to achieve an ADRof $209. Over the first five years, we project the proposed Subject’s ADR toV-25
The Westin Denver International AirportStatement of Estimated Annual Operating Resultsincrease at a CAGR of 4.1 percent. For the last five years of our projections, theSubject’s ADR is projected to increase at three percent per annum.Our estimate for the ADR, occupancy, <strong>and</strong> resulting total annual rooms revenue forthe Subject during the holding period, is presented in the following table.Estimated Rooms RevenueAverage Annual RoomsYear Daily Rate Occupancy Revenue2015 $209.00 68.0% $11,217,0002016 224.00 72.0% 30,551,0002017 231.00 74.0% 32,382,0002018 238.00 74.0% 33,363,0002019 245.00 74.0% 34,344,0002020 252.00 74.0% 35,325,0002021 260.00 74.0% 36,447,0002022 268.00 74.0% 37,568,0002023 276.00 74.0% 38,690,0002024 284.00 74.0% 39,811,0004. Operating Revenues <strong>and</strong> Expenses during the Holding PeriodOperating revenues <strong>and</strong> expenses for the Subject are projected using a computermodel developed by <strong>PKF</strong> Consulting especially for use in hotel feasibility analysis.The estimated operating revenues <strong>and</strong> expenses are based on the sameassumptions used to develop our base year projection. Each item, however, isadjusted to reflect the varying impact of the fixed <strong>and</strong> variable components, i.e., theproportion of each that is affected by variations in occupancy. In addition, each itemis adjusted for inflation as previously discussed. It should be noted, while the actualperformance over the ten year period may flatten, or in fact decrease due tonational recessions or unforeseen geopolitical events, these fluctuations inoperational projections are typically not recognized by market participants.Therefore, it is our opinion that projecting a stabilized occupancy of 74 percentthroughout the ten-year projection period is consistent with the approach utilized bymost market participants.5. Estimated Annual Operating Results during the Holding PeriodThe estimated annual operating results for the Subject for the ten-year periodbeginning August 1, 2015, are presented on the following pages. The followingtable summarizes the estimated operating income for the Subject throughout theten-year projection period.V-26
The Westin Denver International AirportStatement of Estimated Annual Operating ResultsSummary of Estimated Annual Operating ResultsTotal Net Operating Ratio toYear Revenue Income 1 Total Revenues2015² $16,495,000 $5,839,000 35.4%2016 44,367,000 17,314,000 39.0%2017 47,008,000 17,997,000 38.3%2018 48,427,000 17,178,000 35.5%2019 49,860,000 17,046,000 34.2%2020 51,307,000 16,485,000 32.1%2021 52,909,000 16,503,000 31.2%2022 54,523,000 17,022,000 31.2%2023 56,154,000 16,972,000 30.2%2024 57,799,000 17,447,000 30.2%1 Income before the deduction of depreciation, interest,amortization, <strong>and</strong> income taxes, but after the deduction of areserve for capital replacement, a subordinate management fee,<strong>and</strong> a subordinate reserve for capital expenditures. This incomeexcludes the deduction of property taxes.² 2015 represents a stub year beginning August 1, 2015 <strong>and</strong>ending December 31, 2015As noted, revenues for the Subject are projected to increase from $16,495,000 inthe five-month stub year 2015 to $39,811,000 in 2024. Net operating income isprojected to increase from $5,839,000 in 2015 to $17,447,000 in 2024. It should benoted that NOI peaks at $17,997,000 in 2017. As a result of an increase in thesubordinate reserve for capital expenditures, NOI declines between 2017 <strong>and</strong> 2022before increasing year-over-year. Net operating income as a ratio to total revenuesis projected to decline from 35.4 percent in 2015 to 30.2 percent in 2024.On a stabilized basis, the proposed Subject is projected to achieve an NOI ratio of30.0 percent, in line with the weighted average of the comparable Westin hotels <strong>and</strong>the comparable in-terminal hotels.V-27
The Westin Denver International AirportStatement of Estimated Annual Operating ResultsThe Westin Denver International AirportProjected Operating ResultsCalendar Years2015 2016 2017 2018 2019Number of Units: 216 519 519 519 519Number of Annual Rooms Available: 78,931 189,435 189,435 189,435 189,435Number of Rooms Occupied: 53,670 136,390 140,180 140,180 140,180Annual Occupancy: 68.0% 72.0% 74.0% 74.0% 74.0%Average Daily Rate: $209.00 $224.00 $231.00 $238.00 $245.00Revenue Per Available Room: $142.12 $161.28 $170.94 $176.12 $181.30Amount Ratio Amount Ratio Amount Ratio Amount Ratio Amount RatioRevenuesRooms $11,217,000 68.0% $30,551,000 68.9% $32,382,000 68.9% $33,363,000 68.9% $34,344,000 68.9%Food & Beverage 4,985,000 30.2% 13,048,000 29.4% 13,813,000 29.4% 14,227,000 29.4% 14,654,000 29.4%Other Operated Departments 176,000 1.1% 461,000 1.0% 488,000 1.0% 502,000 1.0% 517,000 1.0%Rentals <strong>and</strong> Other Income 117,000 0.7% 307,000 0.7% 325,000 0.7% 335,000 0.7% 345,000 0.7%Total Revenues 16,495,000 100.0% 44,367,000 100.0% 47,008,000 100.0% 48,427,000 100.0% 49,860,000 100.0%Departmental ExpensesRooms 2,572,000 22.9% 6,537,000 21.4% 6,825,000 21.1% 7,030,000 21.1% 7,241,000 21.1%Food & Beverage 3,355,000 67.3% 8,576,000 65.7% 8,979,000 65.0% 9,248,000 65.0% 9,525,000 65.0%Other Operated Departments 141,000 80.1% 368,000 79.8% 390,000 79.9% 402,000 80.1% 414,000 80.1%Total Departmental Expenses 6,068,000 36.8% 15,481,000 34.9% 16,194,000 34.4% 16,680,000 34.4% 17,180,000 34.5%Departmental Profit 10,427,000 63.2% 28,886,000 65.1% 30,814,000 65.6% 31,747,000 65.6% 32,680,000 65.5%Undistributed ExpensesAdministrative & General 1,361,000 8.3% 3,454,000 7.8% 3,591,000 7.6% 3,699,000 7.6% 3,809,000 7.6%<strong>Market</strong>ing 1,347,000 8.2% 3,330,000 7.5% 3,429,000 7.3% 3,532,000 7.3% 3,638,000 7.3%Property Operation <strong>and</strong> Maintenance 662,000 4.0% 1,636,000 3.7% 1,685,000 3.6% 1,735,000 3.6% 1,787,000 3.6%Utility Costs 591,000 3.6% 1,460,000 3.3% 1,504,000 3.2% 1,549,000 3.2% 1,596,000 3.2%Total Undistributed Operating Expenses 3,961,000 24.0% 9,880,000 22.3% 10,209,000 21.7% 10,515,000 21.7% 10,830,000 21.7%Gross Operating Profit 6,466,000 39.2% 19,006,000 42.8% 20,605,000 43.8% 21,232,000 43.8% 21,850,000 43.8%Base Management Fee 285,000 1.7% 728,000 1.6% 1,010,000 2.1% 1,335,000 2.8% 1,374,000 2.8%Fixed ExpensesProperty Taxes 0 0.0% 0 0.0% 0 0.0% 0 0.0% 0 0.0%Insurance 177,000 1.1% 438,000 1.0% 451,000 1.0% 465,000 1.0% 479,000 1.0%Total Fixed Expenses 177,000 1.1% 438,000 1.0% 451,000 1.0% 465,000 1.0% 479,000 1.0%Net Operating Income 6,004,000 36.4% 17,840,000 40.2% 19,144,000 40.7% 19,432,000 40.1% 19,997,000 40.1%FF&E Reserve 165,000 1.0% 444,000 1.0% 940,000 2.0% 1,937,000 4.0% 2,493,000 5.0%Net Operating Income After Reserve $5,839,000 35.4% $17,396,000 39.2% $18,204,000 38.7% $17,495,000 36.1% $17,504,000 35.1%Subordinate FeesSubordinate Management Fee $0 0.0% $82,000 0.2% $207,000 0.4% $317,000 0.7% $458,000 0.9%Subordinate CapEx Reserve $0 0.0% $0 0.0% $0 0.0% $0 0.0% $0 0.0%Total Senior Fees $0 0.0% $82,000 0.2% $207,000 0.4% $317,000 0.7% $458,000 0.9%Net Operating Income After Subordinate Fees $5,839,000 35.4% $17,314,000 39.0% $17,997,000 38.3% $17,178,000 35.5% $17,046,000 34.2%Source: <strong>PKF</strong> Consulting USA Five Months of OperationV-28
The Westin Denver International AirportStatement of Estimated Annual Operating ResultsThe Westin Denver International AirportProjected Operating ResultsCalendar Years2020 2021 2022 20232024Number of Units: 519 519 519 519 519Number of Annual Rooms Available: 189,435 189,435 189,435 189,435 189,435Number of Rooms Occupied: 140,180 140,180 140,180 140,180 140,180Annual Occupancy: 74.0% 74.0% 74.0% 74.0% 74.0%Average Daily Rate: $252.00 $260.00 $268.00 $276.00 $284.00Revenue Per Available Room: $186.48 $192.40 $198.32 $204.24 $210.16Amount Ratio Amount Ratio Amount Ratio Amount Ratio Amount RatioRevenuesRooms $35,325,000 68.9% $36,447,000 68.9% $37,568,000 68.9% $38,690,000 68.9% $39,811,000 68.9%Food & Beverage 15,094,000 29.4% 15,547,000 29.4% 16,013,000 29.4% 16,494,000 29.4% 16,988,000 29.4%Other Operated Departments 533,000 1.0% 549,000 1.0% 565,000 1.0% 582,000 1.0% 600,000 1.0%Rentals <strong>and</strong> Other Income 355,000 0.7% 366,000 0.7% 377,000 0.7% 388,000 0.7% 400,000 0.7%Total Revenues 51,307,000 100.0% 52,909,000 100.0% 54,523,000 100.0% 56,154,000 100.0% 57,799,000 100.0%Departmental ExpensesRooms 7,458,000 21.1% 7,682,000 21.1% 7,912,000 21.1% 8,150,000 21.1% 8,394,000 21.1%Food & Beverage 9,811,000 65.0% 10,105,000 65.0% 10,409,000 65.0% 10,721,000 65.0% 11,042,000 65.0%Other Operated Departments 426,000 79.9% 439,000 80.0% 452,000 80.0% 466,000 80.1% 480,000 80.0%Total Departmental Expenses 17,695,000 34.5% 18,226,000 34.4% 18,773,000 34.4% 19,337,000 34.4% 19,916,000 34.5%Departmental Profit 33,612,000 65.5% 34,683,000 65.6% 35,750,000 65.6% 36,817,000 65.6% 37,883,000 65.5%Undistributed ExpensesAdministrative & General 3,922,000 7.6% 4,042,000 7.6% 4,164,000 7.6% 4,288,000 7.6% 4,416,000 7.6%<strong>Market</strong>ing 3,747,000 7.3% 3,860,000 7.3% 3,976,000 7.3% 4,095,000 7.3% 4,218,000 7.3%Property Operation <strong>and</strong> Maintenance 1,841,000 3.6% 1,896,000 3.6% 1,953,000 3.6% 2,012,000 3.6% 2,072,000 3.6%Utility Costs 1,644,000 3.2% 1,693,000 3.2% 1,744,000 3.2% 1,796,000 3.2% 1,850,000 3.2%Total Undistributed Operating Expenses 11,154,000 21.7% 11,491,000 21.7% 11,837,000 21.7% 12,191,000 21.7% 12,556,000 21.7%Gross Operating Profit 22,458,000 43.8% 23,192,000 43.8% 23,913,000 43.9% 24,626,000 43.9% 25,327,000 43.8%Base Management Fee 1,417,000 2.8% 1,461,000 2.8% 1,505,000 2.8% 1,546,000 2.8% 1,592,000 2.8%Fixed ExpensesProperty Taxes 0 0.0% 0 0.0% 0 0.0% 0 0.0% 0 0.0%Insurance 493,000 1.0% 508,000 1.0% 523,000 1.0% 539,000 1.0% 555,000 1.0%Total Fixed Expenses 493,000 1.0% 508,000 1.0% 523,000 1.0% 539,000 1.0% 555,000 1.0%Net Operating Income 20,548,000 40.0% 21,223,000 40.1% 21,885,000 40.1% 22,541,000 40.1% 23,180,000 40.1%FF&E Reserve 3,078,000 6.0% 3,175,000 6.0% 3,271,000 6.0% 3,369,000 6.0% 3,468,000 6.0%Net Operating Income After Reserve $17,470,000 34.0% $18,048,000 34.1% $18,614,000 34.1% $19,172,000 34.1% $19,712,000 34.1%Subordinate FeesSubordinate Management Fee $472,000 0.9% $487,000 0.9% $502,000 0.9% $515,000 0.9% $531,000 0.9%Subordinate CapEx Reserve $513,000 1.0% $1,058,000 2.0% $1,090,000 2.0% $1,685,000 3.0% $1,734,000 3.0%Total Senior Fees $985,000 1.9% $1,545,000 2.9% $1,592,000 2.9% $2,200,000 3.9% $2,265,000 3.9%Net Operating Income After Subordinate Fees $16,485,000 32.1% $16,503,000 31.2% $17,022,000 31.2% $16,972,000 30.2% $17,447,000 30.2%Source: <strong>PKF</strong> Consulting USAV-29
ADDENDA
ADDENDAA. CERTIFICATION OF THE CONSULTANTSB. STATEMENT OF ASSUMPTIONS AND LIMITING CONDITIONSC. QUALIFICATIONS OF THE CONSULTANTSD. COPY OF THE ENGAGEMENT LETTERE. SENSITIVITY ANALYSIS
ADDENDUM ACERTIFICATION OF THE CONSULTANTS
CERTIFICATION OF THE CONSULTANTSWe, Christopher A. Kraus, MAI, <strong>and</strong> Catherine E. Bolstad certify that, to the best of ourknowledge <strong>and</strong> belief:The statements of fact contained in this report are true <strong>and</strong> correct.The reported analyses, opinions, <strong>and</strong> conclusions are limited only by the reportedassumptions <strong>and</strong> limiting conditions, <strong>and</strong> are our personal, impartial, unbiasedprofessional analyses, opinions, <strong>and</strong> conclusions.We have no present or prospective interest in the property that is the subject of thisreport, <strong>and</strong> no personal interest with respect to the parties involved.We have no bias with respect to the property that is the subject of this report or tothe parties involved with this assignment.Our engagement in this assignment was not contingent upon developing orreporting predetermined results.Our compensation for completing this assignment is not contingent upon thedevelopment or reporting of a predetermined value or direction in value that favorsthe cause of the client, the amount of the value estimate, the attainment of astipulated result, or the occurrence of a subsequent event directly related to theintended use of this report.We have made a personal inspection of the property that is the subject of thisreport.No one has provided significant professional assistance in completing this report.Christopher A. Kraus, MAI, is a Certified General Real Estate Appraiser in the Stateof California.As of the date of this report, Christopher A. Kraus, MAI, has completed therequirements of the continuing education program of the Appraisal Institute.
<strong>PKF</strong> Consulting appreciates the opportunity to be of service to you. Should youhave any questions, or if we can be of further assistance, please do not hesitate tocontact us.Yours sincerely,<strong>PKF</strong> Consulting USABy: Christopher A. Kraus, MAISenior Vice Presidentchris.kraus@pkfc.com | 406.582.8189By: Catherine E. BolstadVice Presidentcatherine.bolstad@pkfc.com | 415.288.7834
ADDENDUM BSTATEMENT OF ASSUMPTIONS AND LIMITING CONDITIONS
STATEMENT OF ASSUMPTIONS AND LIMITING CONDITIONSEconomic <strong>and</strong> Social Trends - The consultant assumes no responsibility for economic, physical ordemographic factors which may affect or alter the opinions in this report if said economic, physical ordemographic factors were not present as of the date of the letter of transmittal accompanying thisreport. The consultant is not obligated to predict future political, economic or social trends.Information Furnished by Others - In preparing the report, the consultant was required to rely oninformation furnished by other individuals or found in previously existing records <strong>and</strong>/or documents.Unless otherwise indicated, such information is presumed to be reliable. However, no warranty,either express or implied, is given by the consultant for the accuracy of such information <strong>and</strong> theconsultant assumes no responsibility for information relied upon later found to have been inaccurate.The consultant reserves the right to make such adjustments to the analyses, opinions <strong>and</strong>conclusions set forth in this report as may be required by consideration of additional data or morereliable data that may become available.Hidden Conditions - The consultant assumes no responsibility for hidden or unapparent conditionsof the properties, subsoil, ground water or structures. No responsibility is assumed for arranging forengineering, geologic or environmental studies that may be required to discover such hidden orunapparent conditions.Hazardous Materials - The consultant has not been provided any information regarding thepresence of any material or substance on or in any portion of the subject property, which material orsubstance possesses or may possess toxic, hazardous <strong>and</strong>/or other harmful <strong>and</strong>/or dangerouscharacteristics. Unless otherwise stated in the report, the consultant did not become aware of thepresence of any such material or substance during the consultant's inspection of the subjectproperty. However, the consultant is not qualified to investigate or test for the presence of suchmaterials or substances. The consultant assumes no responsibility for the presence of any suchsubstance or material on or in the subject property, nor for any expertise or engineering knowledgerequired to discover the presence of such substance or material. Unless otherwise stated, this reportassumes the subject property is in compliance with all federal, state <strong>and</strong> local environmental laws,regulations <strong>and</strong> rules.Zoning <strong>and</strong> L<strong>and</strong> Use - Unless otherwise stated, the subject property is assumed to be in fullcompliance with all applicable zoning <strong>and</strong> l<strong>and</strong> use regulations <strong>and</strong> restrictions.Licenses <strong>and</strong> Permits - Unless otherwise stated, the property is assumed to have all requiredlicenses, permits, certificates, consents or other legislative <strong>and</strong>/or administrative authority from anylocal, state or national government or private entity or organization that have been or can beobtained or renewed for any use on which the performance estimates contained in this report arebased.Engineering Survey - No engineering survey has been made by the consultant. Except asspecifically stated, data relative to size <strong>and</strong> area of the subject property was taken from sourcesconsidered reliable <strong>and</strong> no encroachment of the subject property is considered to exist.Subsurface Rights - No opinion is expressed as to the value of subsurface oil, gas or mineral rightsor whether the property is subject to surface entry for the exploration or removal of such materials,except as is expressly stated.Maps, Plats <strong>and</strong> Exhibits - Maps, plats <strong>and</strong> exhibits included in this report are for illustration only toserve as an aid in visualizing matters discussed within the report. They should not be considered assurveys or relied upon for any other purpose, nor should they be removed from, reproduced or usedapart from the report.
STATEMENT OF ASSUMPTIONS AND LIMITING CONDITIONS(Continued)Legal Matters - No opinion is intended to be expressed for matters which require legal expertise orspecialized investigation or knowledge beyond that customarily employed by real estate consultants.Right of Publication - Possession of this report, or a copy of it, does not carry with it the right ofpublication. Without the written consent of the consultant, this report may not be used for anypurpose by any person other than the party to whom it is addressed. In any event, this report maybe used only with properly written qualification <strong>and</strong> only in its entirety for its stated purpose.Archeological Significance - No investigation has been made by the consultant <strong>and</strong> no informationhas been provided to the consultant regarding potential archeological significance of the subjectproperty or any portion thereof. This report assumes no portion of the subject property hasarcheological significance.Compliance with the Americans with Disabilities Act - The Americans with Disabilities Act("ADA") became effective January 26, 1992. It is assumed that the property will be in directcompliance with the various detailed requirements of the ADA.Definitions <strong>and</strong> Assumptions - The definitions <strong>and</strong> assumptions upon which our analyses, opinions<strong>and</strong> conclusions are based are set forth in appropriate sections of this report <strong>and</strong> are to be part ofthese general assumptions as if included here in their entirety.Utilization of the L<strong>and</strong> <strong>and</strong>/or Improvements - It is assumed that the utilization of the l<strong>and</strong> <strong>and</strong>/orimprovements is within the boundaries or property described herein <strong>and</strong> that there is noencroachment or trespass.Dissemination of Material - Neither all nor any part of the contents of this report shall bedisseminated to the general public through advertising or sales media, public relations media, newmedia or other public means of communication without the prior written consent <strong>and</strong> approval of theconsultant(s).Distribution <strong>and</strong> Liability to Third Parties - The party of whom this report was prepared maydistribute copies of this report only in its entirety to such third parties as may be selected by the partyfor whom this report was prepared; however, portions of this report shall not be given to third partieswithout our written consent. Liability to third parties will not be accepted.Use in Offering Materials - This report, including all cash flow forecasts, market surveys <strong>and</strong> relateddata, conclusions, exhibits <strong>and</strong> supporting documentation may not be reproduced or referencesmade to the report or to <strong>PKF</strong> Consulting in any sale offering, prospectus, public or private placementmemor<strong>and</strong>um, proxy statement or other document ("Offering Material") in connection with a merger,liquidation or other corporate transaction unless <strong>PKF</strong> Consulting has approved in writing the text ofany such reference or reproduction prior to the distribution <strong>and</strong> filing thereof.Limits to Liability - <strong>PKF</strong> Consulting cannot be held liable in any cause of action resulting in litigationfor any dollar amount which exceeds the total fees collected from this individual engagement.Legal Expenses - Any legal expenses incurred in defending or representing ourselves concerningthis assignment will be the responsibility of the client.
ADDENDUM CQUALIFICATIONS OF THE CONSULTANTS
PROFESSIONAL HISTORYQUALIFICATIONS OFCHRISTOPHER A. KRAUS, MAISENIOR VICE PRESIDENT2003 -Present <strong>PKF</strong> Consulting, Bozeman, MontanaPractice Leader <strong>and</strong> Senior Vice President1997 -2003 <strong>PKF</strong> Consulting, San FranciscoVice PresidentPrior1992 - 1997 Winegardner <strong>and</strong> Hammons, Inc. – Cincinnati, OhioGeneral Manager: various hotels throughout MidwestAREAS OF EXPERTISE Preparation of market feasibility studies for hotels,resorts, conference centers, golf courses, vacationownership developments, <strong>and</strong> related facilities includingestimated financial income statements.Preparation of full narrative appraisals of lodgingproperties <strong>and</strong> related facilities focusing on the valuationof projected operating income. Skills include fee simple,leasehold, <strong>and</strong> leased fee estate interest valuation.Operational planning <strong>and</strong> evaluation of hospitality industryactivities. Extensive experience in the pre-opening <strong>and</strong>on-going daily operation of hotels, motels, resorts,restaurants, golf courses, <strong>and</strong> conference centers.Litigation support analysis involving the valuation of hotelassets <strong>and</strong> real estate valuations.Preparation of offering memor<strong>and</strong>ums for the potentialsale of l<strong>and</strong> <strong>and</strong> hospitality assets.REPRESENTATIVEPROJECTS<strong>Market</strong> feasibility analysis utilized in support of thedevelopment of a proposed $180 million mixed-use FourSeasons Resort, which contains a 120-room luxuryhotel, whole ownership condominiums, <strong>and</strong> vacationownership units, located in Vail, Colorado.Negotiation of a DDA (Disposition <strong>and</strong> DevelopmentAgreement) for the sale of l<strong>and</strong> to be utilized for a ResortDevelopment adjacent to two 18-hole golf courses inMonterey, California to include a 330-room MarriottResort, 170-unit Vacation Ownership development, <strong>and</strong>125 residential lots.
QUALIFICATIONS OFCHRISTOPHER A. KRAUS, MAIREPRESENTATIVEPROJECTS(Continued)<strong>Market</strong> feasibility analysis utilized in support of thedevelopment of a proposed $130 million luxury hotel <strong>and</strong>whole ownership condominium development indowntown Seattle, Washington.<strong>Market</strong> feasibility analysis utilized in support of thedevelopment of a 500-room convention center hotellocated in downtown Sacramento collateralized by a$90.0 million bond offering.Valuation of the Pebble Beach Company for Bank ofAmerica, the lender on the $800 million acquisition. ThePebble Beach Company includes three hotels, four golfcourses, retail, <strong>and</strong> l<strong>and</strong> being held for futuredevelopment.<strong>Market</strong> study <strong>and</strong> valuation of the proposed 379-roomMontalcino Resort <strong>and</strong> Vacation Ownershipdevelopment to be located in Napa Valley, California.The to be built facility will include an 18-hole signaturegolf course <strong>and</strong> a 16,000 square foot spa facility.Ongoing operational review <strong>and</strong> asset management of anewly constructed 500-room convention center hotellocated in Sacramento, California.Valuation of the to be built 350-room Ritz-Carlton Resortlocated at Lake Las Vegas in Henderson, Nevada. Thisdevelopment is the premier hotel facility in the masterplannedLake Las Vegas development.<strong>Market</strong> positioning study for a proposed hotel <strong>and</strong>signature golf course within a 2,000-acre, masterplanneddevelopment located at Punta Colorada in LaPaz, Baja California Sur, Mexico.Detailed review of food <strong>and</strong> beverage operations,including profitability analysis <strong>and</strong> review of memberservices for a private country club located in Oakl<strong>and</strong>,California.<strong>Market</strong> positioning study <strong>and</strong> valuation of theChardonnay Golf Club located in Napa Valley, California.
QUALIFICATIONS OFCHRISTOPHER A. KRAUS, MAIREPRESENTATIVEPROJECTS(Continued)<strong>Market</strong> dem<strong>and</strong> analysis for more than 50 limitedservice,extended-stay, <strong>and</strong> full-service lodgingproperties located throughout the San Francisco BayArea.Appraisal of more than 60 full-service <strong>and</strong> limited-servicehotels <strong>and</strong> resorts located throughout the United States.EDUCATIONCornell University, Ithaca, New YorkBachelor of Science, School of <strong>Hotel</strong> AdministrationSpecialty in <strong>Hotel</strong> Operations <strong>and</strong> FinanceAppraisal InstituteCompleted All Courses Required for DesignatedMembershipPROFESSIONALACTIVITIESGuest speaker at various industry seminarsPROFESSIONALMEMBERSHIPSTreasurer – Northern California Chapter of the Cornell<strong>Hotel</strong> Society (1999 to 2006)The Appraisal Institute - Designated MemberCertified General Real Estate Appraiser:State of California, Certificate AG029222State of Montana, Certificate 672RAGState of Washington Certificate 1101672State of Wyoming, Permit Number 597
QUALIFICATIONS OFCATHERINE E. BOLSTADVICE PRESIDENTPROFESSIONAL HISTORYPresentPrior<strong>PKF</strong> Consulting USA, San Francisco, CAAssociateHilton <strong>Hotel</strong>s, Hilton & Towers, San Francisco, CASales & <strong>Market</strong>ing/Public RelationsColliers International <strong>Hotel</strong>s, San Francisco, CAAnalystTasteBuds, Inc., Los Angeles, CAAnalystEDUCATIONUniversity of San Francisco, San Francisco,CaliforniaSchool of <strong>Business</strong>Hospitality Industry Management <strong>and</strong> FinanceBachelor of Science/Bachelor of Arts, 2006SUMMARY OF REPRESENTATIVEPROJECTS<strong>Market</strong> dem<strong>and</strong> <strong>and</strong> feasibility analysis for aproposed hotel located in West Sacramento,California<strong>Market</strong> dem<strong>and</strong> <strong>and</strong> feasibility analysis for aproposed hotel located in Palo Alto, California.Appraisal for a proposed hotel located inCottonwood, California<strong>Market</strong> dem<strong>and</strong> <strong>and</strong> feasibility analysis for aproposed hotel located in Walnut Creek,California.Appraisal for a proposed hotel located in NorthNatomas/Sacramento, CaliforniaAppraisal for the Napa Valley Lodge located inYountville, California
<strong>Market</strong> dem<strong>and</strong> <strong>and</strong> feasibility analysis for theEmbassy Suites Denver – Aurora located inDenver, ColoradoAppraisal for the <strong>Hotel</strong> Mark Twain located inSan Francisco, California<strong>Market</strong> dem<strong>and</strong> <strong>and</strong> feasibility analysis for theHomewood Suites Oakl<strong>and</strong> – Waterfront locatedin Oakl<strong>and</strong>, California<strong>Market</strong> dem<strong>and</strong> <strong>and</strong> feasibility analysis for theproposed Westin Jack London Square to belocated in Oakl<strong>and</strong>, CaliforniaAppraisal for the proposed Hilton Garden Innlocated in Billings, MontanaAppraisal for the Best Western Creekside Innlocated in Bishop, CaliforniaAppraisal for the proposed Montalcino Resortlocated in Napa, CaliforniaAppraisal for the FountainGrove Inn located inSanta Rosa, CaliforniaAppraisal for the Lodge at Calistoga located inCalistoga, CaliforniaAppraisal for the Calistoga Spa Hot Springslocated in Calistoga, CaliforniaAppraisal for the Holiday Inn Walnut Creek locatedin Walnut Creek, CaliforniaAppraisal for the Holiday Inn Concord located inConcord, CaliforniaAppraisal for the Sheraton Petaluma located inPetaluma, California<strong>Market</strong> dem<strong>and</strong> analysis for the Galleria Park<strong>Hotel</strong> located in San Francisco, CaliforniaAppraisal for the proposed SpringHill Suiteslocated in Napa, California
Appraisal for the Yountville Inn located inYountville, CaliforniaAppraisal for the <strong>Hotel</strong> Abrego located inMonterey, CaliforniaAppraisal for the Pacific Gardens Inn located inPacific Grove, CaliforniaAppraisal for the Meritage Resort <strong>and</strong> Spa locatedin Napa, CaliforniaAppraisal of the Residence Inn Downtown atCapitol Park located in Sacramento, CaliforniaAppraisal for the Four Points by Sheraton locatedin Natomas/Sacramento, CaliforniaAppraisal for the proposed Hampton Inn & Suiteslocated in Spokane Valley, WashingtonAppraisal for the Hyatt Regency located inSacramento, CaliforniaAppraisal for the Holiday Inn Express located inMill Valley, CaliforniaAppraisal for the proposed <strong>Hotel</strong> Adelaide to belocated in Teton Village, WyomingAppraisal of the Four Seasons Resort located inScottsdale, ArizonaAppraisal of the Vintage Estate located inYountville, California<strong>Market</strong> dem<strong>and</strong> analysis for a proposed interminalWestin <strong>Hotel</strong> to be located at the DenverInternational Airport<strong>Market</strong> dem<strong>and</strong> analysis for a proposed resort tobe located in Healdsburg, California<strong>Market</strong> dem<strong>and</strong> analysis for a proposed hotel <strong>and</strong>conference center to be located in Roseville,California
ADDENDUM DCOPY OF THE ENGAGEMENT LETTER
Sent via email to: patrick.heck@flydenver.comNo hardcopy to followJune 6, 2012Mr. Patrick HeckChief <strong>Financial</strong> OfficerDenver International Airport201 West Colfax AvenueDenver, CO 80202Re:Proposed Westin Denver International Airport – Denver, Colorado2012 Update <strong>Analysis</strong>Dear Mr. Heck:Pursuant to our recent discussions with Mr. Mark Tobin of HREC DevelopmentResources, we are pleased to submit this proposal to perform an updated study onthe potential market dem<strong>and</strong> <strong>and</strong> prepare a statement of the estimated annualoperating results associated with the development of a +/- 516 room Westin hotel(the “<strong>Hotel</strong>”) to be located at the Denver International Airport (“<strong>DIA</strong>”) in Denver,Colorado.A. IntroductionAs we underst<strong>and</strong> it, the City <strong>and</strong> County of Denver Colorado in conjunction withthe Denver International Airport Authority are working with Starwood <strong>Hotel</strong>s <strong>and</strong>Resorts <strong>and</strong> Mortenson Construction to develop a 516 room Westin hotel at <strong>DIA</strong>.We further underst<strong>and</strong> that the development of the hotel would be financed throughthe sale of tax exempt bonds as a registered security offering. As a component ofthe offering circular, you require an evaluation of the market <strong>and</strong> economic potentialof the proposed hotel. In order to assist you in evaluating the future marketperformance <strong>and</strong> prepare a statement of the estimated annual operating results ofthe proposed <strong>Hotel</strong>, we propose to perform a study that would encompass thefollowing:• Evaluate the appropriateness of the site for the development of the plannedhotel facility;<strong>PKF</strong> Consulting USA | 50 California Street, 19 th Floor | San Francisco, CA 94111TEL: 415 788 3102 | FAX: 415 433 7844 | www.pkfc.com
Mr. Patrick HeckJune 14, 2012• Analyze the current <strong>and</strong> future market dem<strong>and</strong> for upscale full servicelodging accommodations in the local <strong>and</strong> regional market areas;• Review <strong>and</strong> evaluate existing plans <strong>and</strong> provide key planning criteria as tothe sizing, concept, amenities to be provided, <strong>and</strong> timing of the development;• Develop a forecast of the likely occupancy levels <strong>and</strong> average daily roomrates (“ADR”) the <strong>Hotel</strong> could reasonably achieve for its first ten-years ofoperation;• Develop a statement of estimated annual operating results for the proposedproject for its first ten years of operation. This statement would reflect allpotential revenues <strong>and</strong> expenses associated with ongoing operations;• At the appropriate time, prepare a formal report on the market <strong>and</strong> financialperformance of the proposed development. This report would be suitable forinclusion in the tax exempt bond offering circular presentation that would bedistributed to third parties for the purpose of securing mortgage financing<strong>and</strong>/or equity participation. This report would also be suitable for use in thenegotiation of a lease, management or franchise agreement, as well as forpresentation to representatives of local government agencies.The work program for the study will be concerned with the determination of current<strong>and</strong> potential future dem<strong>and</strong> for hotel rooms, assessment of the existing <strong>and</strong>potential future competitive hotel supply, <strong>and</strong> the share of the market that couldreasonably be attained by the subject facility.It should be noted that <strong>PKF</strong> Consulting USA (“<strong>PKF</strong> Consulting”) performed ananalysis of the potential market performance <strong>and</strong> prepared a statement of theestimated annual operating results for this project in December 2009, October 2010<strong>and</strong> again in the summer of 2011. For this updated analysis, the scope of work willbe identical to that performed in these prior studies, but updated reflect not only thechange in market conditions since 2011, but also the revised development programof the proposed <strong>Hotel</strong>.B. <strong>PKF</strong> Consulting USAAs a point of background, we would like to provide you with a brief overview of ourFirm. <strong>PKF</strong> Consulting USA (“<strong>PKF</strong>”) is a division of Colliers International(NASDAQ:FSRV), the third largest real estate services firm in the World. <strong>PKF</strong> is anational firm of management consultants, appraisers, real estate brokers <strong>and</strong>industry specialists who provide a full range of services to the hospitality <strong>and</strong>tourism industries. Headquartered in San Francisco, the Firm has offices inBoston, New York, Philadelphia, Portl<strong>and</strong>, ME, Atlanta, Miami, Washington, D.C.,- 2 -
Mr. Patrick HeckJune 14, 2012Houston, Dallas, Indianapolis, Los Angeles, Seattle, Sacramento, <strong>and</strong> Bozemanwith nearly 100 professionals <strong>and</strong> support staff.Our Firm is comprised of three integrated divisions which provide consulting,brokerage <strong>and</strong> research services to the hospitality industry.1. ConsultingOur consulting group provides advisory services <strong>and</strong> industry expertise to help ourclients in planning, developing, managing, financing, problem-solving, improvingoperations, <strong>and</strong> valuing hotels <strong>and</strong> other hospitality assets. Our engagementsrange from hotel market <strong>and</strong> financial feasibility studies to investment structuring,<strong>and</strong> from hotel appraisals to asset management.Our consulting group is constantly providing clients both large <strong>and</strong> small with themost constructive <strong>and</strong> valuable advice in the industry, performing feasibility <strong>and</strong>market studies, acquisition due diligence <strong>and</strong> valuations involving hotels, resorts,restaurants, golf courses, <strong>and</strong> a variety of mixed-use developments <strong>and</strong> otherhospitality products. We have the distinct advantage of being the only hospitalityconsulting firm with its own, proprietary database of U.S. hotel financial statistics.2. Brokerage<strong>PKF</strong>’s brokerage group, Colliers International <strong>Hotel</strong>s (“CIH”), serves the investmentmarket primarily as exclusive agents for owners/sellers managing the sale <strong>and</strong>disposition process. The team members of CIH have extensive backgrounds inhotel <strong>and</strong> resort transactions as well backgrounds in hotel consulting <strong>and</strong>operations. CIH’s presentation of prospective hotel investments reflects a thoroughunderst<strong>and</strong>ing of hotels, their br<strong>and</strong>ing/affiliations, management issues, operatingmargins, market dynamics, <strong>and</strong> capitalization.Our hotel brokerage team has been retained for other services that include specificbuyer-representation assignments, RFPs (Request for Proposals) for managementorganizations, executing ground leases, development financing, joint venturepartnerships, <strong>and</strong> l<strong>and</strong> sales. The scope of our business includes all tiers of thelodging industry including hotels <strong>and</strong> resorts, vacation-ownership, residential/hotelmixed-use, conference centers, <strong>and</strong> recreational facilities.Because of its close working relationship with the consulting <strong>and</strong> research groups ofColliers <strong>PKF</strong>, our dedicated lodging brokerage platform offers clients anunparalleled level of market knowledge with a proven track record of sales <strong>and</strong>marketing successes.3. Research<strong>PKF</strong> Hospitality Research owns the database for Trends® in the <strong>Hotel</strong> Industry, thestatistical review of U.S. hotel operations which first appeared in 1935 <strong>and</strong> has- 3 -
Mr. Patrick HeckJune 14, 2012been published every year since. <strong>PKF</strong>’s professionals use the Trends® databaseto assist their clients in making informed decisions. In addition, the Trends® data isused to produce custom financial reports for clients that enable them to benchmarkhotel revenues, expenses, <strong>and</strong> profits.Beginning in 2007, <strong>PKF</strong> unveiled its powerful <strong>Hotel</strong> Horizons®, an economicsbasedhotel forecasting model that projects five years of supply, dem<strong>and</strong>,occupancy, ADR, <strong>and</strong> RevPAR for the U.S. lodging industry. <strong>Hotel</strong> Horizons ®reports are published on a quarterly basis for 50 markets <strong>and</strong> six national chainscales.With a long-st<strong>and</strong>ing tradition of tracking <strong>and</strong> forecasting the lodging industry, ourResearch Group has the technical capacity to conduct custom research, theanalytical skills to interpret the data, <strong>and</strong> the access necessary to gatherconfidential performance information from the industry.4. <strong>PKF</strong> Consulting USA Services• Asset Management <strong>and</strong> Management Company Selection• Real Estate Appraisals <strong>and</strong> <strong>Business</strong> Valuation• <strong>Market</strong> <strong>and</strong> <strong>Financial</strong> Feasibility Studies• Litigation Support <strong>and</strong> Expert Testimony• Acquisition Due Diligence• Operational Studies• Tourism <strong>and</strong> Recreational Studies• Resort <strong>and</strong> Recreation Services• Conference, Convention, <strong>and</strong> Public Assembly Facilities• <strong>Financial</strong> Benchmarking• Econometric Forecasting• Custom Research• Transaction (brokerage) Advisory Services• Development Financing• Property Tax Appeals5. Local <strong>Market</strong> KnowledgeIn addition to our long-st<strong>and</strong>ing expertise in the hotel industry, we would bring toyou in this engagement substantial familiarity with the Denver area hotel market aswell as the general market for “in terminal” airport hotels throughout the UnitedStates (e.g. Hilton Chicago O’Hare, Hilton Boston Logan, Houston Airport Marriott,Hyatt Regency Orl<strong>and</strong>o, Philadelphia Airport Marriott, Westin Detroit Metro, HyattRegency Pittsburgh, Gr<strong>and</strong> Hyatt DFW, Tampa Airport Marriott, Sheraton BradleyAirport, etc).- 4 -
Mr. Patrick HeckJune 14, 2012In order to give you an underst<strong>and</strong>ing of the depth of our experience, attached foryour review is a partial listing of existing <strong>and</strong> proposed hotels, resorts <strong>and</strong> othertypes of properties our office has evaluated over the past several years.Given the historical role of <strong>PKF</strong> in the hospitality <strong>and</strong> real estate industries, <strong>and</strong> ourknowledge of the local market, we are of the opinion that there is no firm that canprovide the services available through us. More background <strong>and</strong> information on ourFirm can be obtained from our web site at www.pkfc.com.C. Proposed Work Program1. Introductory MeetingThe first phase of our engagement will involve meeting with you <strong>and</strong> yourassociates for the purpose of underst<strong>and</strong>ing your goals <strong>and</strong> objectives for thisproject, as well as to review in detail any preliminary development programming youmay have for this development.2. Site <strong>Analysis</strong>Since the location of a hotel development within its market is of major importance tothe success of a project, we will analyze <strong>and</strong> evaluate the following factorsregarding the subject’s location <strong>and</strong> possible advantages/disadvantages incomparison with potential competitors:• Accessibility of the transportation network <strong>and</strong> dem<strong>and</strong> generators• Visibility from various access points• Ambiance of the area as it might impact dem<strong>and</strong>• Relationship to dem<strong>and</strong> sources <strong>and</strong> attractions• Climate <strong>and</strong> seasonality which may impact dem<strong>and</strong>3. Area ReviewWe will gather <strong>and</strong> analyze relevant statistical data regarding the local <strong>and</strong> regionalmarket area to determine whether the economic environment appears suitable forthe project. We will examine possible correlation between key economic factors<strong>and</strong> the dem<strong>and</strong> for hotel rooms <strong>and</strong> will use available forecasts of these indicatorsin our evaluation of potential future dem<strong>and</strong>.4. Primary ResearchWe will perform primary market research within the local market. This will includeinterviews with key dem<strong>and</strong> generators, inspection <strong>and</strong> evaluation of competitive<strong>and</strong> comparable facilities <strong>and</strong> discussions with executives knowledgeable about thearea’s lodging market. Among those whom we may conduct such interviews are:- 5 -
Mr. Patrick HeckJune 14, 2012• Owners <strong>and</strong> managers of potentially competitive hotels in the <strong>DIA</strong> area aswell as comparable “in terminal” hotels located at other major airports• Appropriate city <strong>and</strong> county officials• Major employers in the market area• Management of local tourist attractions• Officials in tourism, development, <strong>and</strong> transportation• Bankers, editors, <strong>and</strong> development-organization representatives• Convention Bureau authorities• Redevelopment Agency officials• Local Real Estate professionals5. Supply <strong>and</strong> <strong>Dem<strong>and</strong></strong> EstimatesOn the basis of the foregoing analysis, we will estimate potential growth in both thedem<strong>and</strong> for, <strong>and</strong> the supply of lodging facilities in the competitive market area. Wewill then evaluate each of the principal segments of dem<strong>and</strong> <strong>and</strong> describe theircharacteristics in this particular market <strong>and</strong> their historical performance. Then wewill estimate growth rates in dem<strong>and</strong> for each of these market segments <strong>and</strong>project the anticipated future dem<strong>and</strong>.The next step is an estimate of the competitive supply, including historical growthtrends <strong>and</strong> potential additions to the supply. We will evaluate the competitivepotential of proposed or rumored projects with respect to your development, <strong>and</strong>estimate expected performance of the competitive supply over the projection periodfor the subject property.6. Facilities RecommendationsWe will review plans you may have for the project <strong>and</strong> prepare recommendationsfor facilities that, in our opinion, will best meet demonstrated market dem<strong>and</strong>,including:• Concept <strong>and</strong> quality level of the property;• Number, size <strong>and</strong> mix of hotel rooms;• Appropriate franchise (“br<strong>and</strong>”) affiliations (if appropriate);• Sizing of restaurant <strong>and</strong> banquet <strong>and</strong> meeting space; <strong>and</strong>,• Related services <strong>and</strong> amenities to be provided, including parking,recreation <strong>and</strong> other facilities.These recommendations can provide you with background for a design program<strong>and</strong> will serve as the basis for our estimate of operating results.- 6 -
Mr. Patrick HeckJune 14, 20127. <strong>Market</strong> Share EstimatesAs a starting point for our estimate of the proposed hotel’s operating performance,we will relate the property’s size to the competitive supply, both existing <strong>and</strong>potential. This ratio, called fair share, is then related to projected competitivedem<strong>and</strong> <strong>and</strong> adjusted to reflect the share of the market which we would reasonablyexpect the property to capture in its first five years of operation based onidentifiable attributes dem<strong>and</strong>ed in the market such as: location, price, quality, <strong>and</strong>amenities. Based on this analysis, we will develop our projection of the potentialoccupancy <strong>and</strong> average room rate the hotel could achieve over its first five years ofoperation.8. Projected Operating ResultsUsing our market research as a basis, we would develop a detailed cash flowforecast for the first ten years of operation of the proposed hotel. This forecastwould include all revenues <strong>and</strong> expenses <strong>and</strong> result in a “bottom line” of incomebefore depreciation, amortization, interest, <strong>and</strong> taxes on income (“EBITDA”).Since the estimated operating results will be based on estimates <strong>and</strong> assumptions,which are subject to uncertainty <strong>and</strong> variation, we will not represent them as resultsthat will actually be achieved. The estimated operating results will be used toevaluate the overall feasibility of the project.9. Formal Report PresentationAt the conclusion of our foregoing analysis, we will prepare a detailed reportoutlining our conclusions <strong>and</strong> recommendations concerning the proposed hoteldevelopment. The report will be presented in a format generally acceptable tomajor sources of debt <strong>and</strong> equity financing <strong>and</strong> franchise <strong>and</strong> managementorganizations. Furthermore, if required, the report will be designed for inclusion inan Offering Memor<strong>and</strong>um (“OM”) associated with a bond offering to finance thehotel. Though the exact format of the reports will evolve as the engagementprogresses, the following probable section headings provide an outline of theexpected final reports.• Introduction (Project Concept <strong>and</strong> Study Methodology)• Summary of Conclusions <strong>and</strong> Recommendations• Area Economic/Demographic Review• Site Location Evaluation• Competitive Supply <strong>and</strong> <strong>Dem<strong>and</strong></strong>• Recommended Facilities• <strong>Market</strong> Position - Subject Property• Statement of Estimated Annual Operating Result- 7 -
Mr. Patrick HeckJune 14, 2012D. Anticipated Delivery DateWe should be able to commence the engagement within approximately two weeksof receiving your authorization to proceed. Barring unforeseen circumstances, weenvision completing our market <strong>and</strong> cash flow projections within approximately twoadditional weeks. The formal report will require an additional one to two weeks tocomplete, but per your request, a draft copy of our report will be provided to you nolater than August 1, 2012.E. Professional FeesOur fees are commensurate with services rendered <strong>and</strong> are based on timeexpended by our professionals, charged at our normal billing rates as indicatedbelow, <strong>and</strong> are not in any way contingent upon the results of our work. Our normalhourly billing rates at this time are as follows.Executive <strong>and</strong> Senior Vice PresidentsVice PresidentsAssociatesConsultants$350 - $500$250 - $325$175 - $225$125 - $150Given the nature of this assignment, our fees will be charged on a per diem basis atthe billing rates stated above for all professional time associated with the project,from commencement of the assignment until completion, including all meetings,revisions, <strong>and</strong> updates. While not limited to this amount, our estimated fees tocomplete the full updated analysis <strong>and</strong> formal report would be between $30,000<strong>and</strong> $35,000. It should be noted that this professional fee does not include the timeassociated with meetings with bond underwriters <strong>and</strong> legal counsel, our review ofthe offering circular, <strong>and</strong> updates to our analysis. Our experience in other projectsof this type is that the additional fee for this “follow-up” work typically ranges frombetween $20,000 <strong>and</strong> $30,000. Accordingly, our total professional fee for thisengagement may range from between $50,000 <strong>and</strong> $65,000.Should a representative of <strong>PKF</strong> Consulting be required to attend committeemeetings or presentations, our fees will continue to be billed to you on a per diembasis. As a point of reference, my billing rate is $350 per hour, <strong>and</strong> the averagebilling rate for a consultant is approximately $225 per hour.In addition to our professional fees, we require reimbursement for any out-of-pocketexpenses incurred in the performance of the assignment. Such expenses mayinclude transportation <strong>and</strong> lodging costs, out-of-pocket expenses incurred by uswhile in the field, supplies, <strong>and</strong> report printing costs.- 8 -
ADDENDUM ESENSITIVITY ANALYSIS
August 28, 2012Mr. Patrick HeckDeputy Chief <strong>Financial</strong> OfficerDenver International Airport201 West Colfax AvenueDenver, Colorado 80202Re:Sensitivity <strong>Analysis</strong> – Alternative ForecastThe Westin Denver International Airport – Denver, ColoradoDear Mr. Heck:Pursuant to your recent request, we have provided an alternate, more conservativestatement of estimated annual operating results for the proposed 519-room Westinhotel (the “Subject”) to be located at the south terminal of the Denver InternationalAirport (“<strong>DIA</strong>”) in Denver, Colorado. As we discussed, this sensitivity analysis hasbeen prepared at the specific request of representatives of the <strong>DIA</strong> as anaddendum to our actual forecast for the proposed hotel contained in this report.Accordingly, while the numbers presented in this addendum letter reflect a moreconservative level of performance for the Subject, they do not reflect the actualconclusions contained in <strong>PKF</strong> Consulting’s formal report dated September 18,2012.Specifically, in modifying our forecast, we have made the following changes: Lowered our “hypothetical” ADR, stated in $2012 from $180 to $175; Reduced our assumed rate of ADR growth between 2013 <strong>and</strong> 2016; <strong>and</strong>, Modified the operating expenses that are associated with the decrease inrevenues.A summary of the variance in the average daily rate <strong>and</strong> net operating incomebetween our original (baseline) <strong>and</strong> revised forecast is presented in the followingtwo tables. We have attached our revised statement of estimated annual operatingresults to the end of this letter.<strong>PKF</strong> Consulting USA | 50 California Street, 19 th Floor | San Francisco, CA 94111TEL: 415 788 3102 | FAX: 415 433 7844 | www.pkfc.com
The Westin Denver International AirportDenver International AirportWestin Denver International AirportProjected PerformanceBaseline ProjectionHypothetical <strong>Market</strong> Introductory Actual SubjectYear ADR Growth Discount ADR Occupancy2012 $180 -2013 $193 7.0%2014 $205 6.0%2015 $215 5.0% 3.0% $209 68%2016 $224 4.0% 0.0% $224 72%2017 $231 3.0% 0.0% $231 74%2018 $238 3.0% 0.0% $238 74%2019 $245 3.0% 0.0% $245 74%Conservative ProjectionHypothetical <strong>Market</strong> Introductory Actual SubjectYear ADR Growth Discount ADR Occupancy2012 $175 -2013 $184 5.0%2014 $191 4.0%2015 $197 3.0% 3.0% $191 68%2016 $203 3.0% 0.0% $203 72%2017 $209 3.0% 0.0% $209 74%2018 $215 3.0% 0.0% $215 74%2019 $221 3.0% 0.0% $221 74%Westin Denver International AirportProjected PerformanceBaseline ConservativeYear NOI NOI Difference2015 $5,839,000 $4,907,000 -16.0%2016 $17,314,000 $14,550,000 -16.0%2017 $17,997,000 $15,052,000 -16.4%2018 $17,178,000 $14,164,000 -17.5%2019 $17,046,000 $13,934,000 -18.3%2020 $16,485,000 $13,440,000 -18.5%2021 $16,503,000 $13,367,000 -19.0%2022 $17,022,000 $13,760,000 -19.2%2023 $16,972,000 $13,622,000 -19.7%2024 $17,447,000 $13,974,000 -19.9%- 2 -
The Westin Denver International AirportDenver International AirportShould you have any questions, or if we can be of further assistance, please do nothesitate to contact us.Yours sincerely,<strong>PKF</strong> Consulting USABy: Christopher A. Kraus, MAISenior Vice Presidentchris.kraus@pkfc.com | 406.582.8189By: Catherine E. BolstadVice Presidentcatherine.bolstad@pkfc.com | 415.288.7834- 3 -
The Westin Denver International AirportDenver International AirportThe Westin Denver International AirportProjected Operating ResultsCalendar Years2015 2016 2017 2018 2019Number of Units: 216 519 519 519 519Number of Annual Rooms Available: 78,931 189,435 189,435 189,435 189,435Number of Rooms Occupied: 53,670 136,390 140,180 140,180 140,180Annual Occupancy: 68.0% 72.0% 74.0% 74.0% 74.0%Average Daily Rate: $191.00 $203.00 $209.00 $215.00 $221.00Revenue Per Available Room: $129.88 $146.16 $154.66 $159.10 $163.54Amount Ratio Amount Ratio Amount Ratio Amount Ratio Amount RatioRevenuesRooms $10,251,000 66.0% $27,687,000 66.7% $29,298,000 66.7% $30,139,000 66.7% $30,980,000 66.6%Food & Beverage 4,985,000 32.1% 13,048,000 31.4% 13,813,000 31.4% 14,227,000 31.5% 14,654,000 31.5%Other Operated Departments 176,000 1.1% 461,000 1.1% 488,000 1.1% 502,000 1.1% 517,000 1.1%Rentals <strong>and</strong> Other Income 117,000 0.8% 307,000 0.7% 325,000 0.7% 335,000 0.7% 345,000 0.7%Total Revenues 15,529,000 100.0% 41,503,000 100.0% 43,924,000 100.0% 45,203,000 100.0% 46,496,000 100.0%Departmental ExpensesRooms 2,572,000 25.1% 6,537,000 23.6% 6,825,000 23.3% 7,030,000 23.3% 7,241,000 23.4%Food & Beverage 3,355,000 67.3% 8,576,000 65.7% 8,979,000 65.0% 9,248,000 65.0% 9,525,000 65.0%Other Operated Departments 141,000 80.1% 368,000 79.8% 390,000 79.9% 402,000 80.1% 414,000 80.1%Total Departmental Expenses 6,068,000 39.1% 15,481,000 37.3% 16,194,000 36.9% 16,680,000 36.9% 17,180,000 36.9%Departmental Profit 9,461,000 60.9% 26,022,000 62.7% 27,730,000 63.1% 28,523,000 63.1% 29,316,000 63.1%Undistributed ExpensesAdministrative & General 1,337,000 8.6% 3,383,000 8.2% 3,514,000 8.0% 3,618,000 8.0% 3,725,000 8.0%<strong>Market</strong>ing 1,347,000 8.7% 3,330,000 8.0% 3,429,000 7.8% 3,532,000 7.8% 3,638,000 7.8%Property Operation <strong>and</strong> Maintenance 662,000 4.3% 1,636,000 3.9% 1,685,000 3.8% 1,735,000 3.8% 1,787,000 3.8%Utility Costs 591,000 3.8% 1,460,000 3.5% 1,504,000 3.4% 1,549,000 3.4% 1,596,000 3.4%Total Undistributed Operating Expenses 3,937,000 25.4% 9,809,000 23.6% 10,132,000 23.1% 10,434,000 23.1% 10,746,000 23.1%Gross Operating Profit 5,524,000 35.6% 16,213,000 39.1% 17,598,000 40.1% 18,089,000 40.0% 18,570,000 39.9%Base Management Fee 285,000 1.8% 728,000 1.8% 1,010,000 2.3% 1,335,000 3.0% 1,374,000 3.0%Fixed ExpensesProperty Taxes 0 0.0% 0 0.0% 0 0.0% 0 0.0% 0 0.0%Insurance 177,000 1.1% 438,000 1.1% 451,000 1.0% 465,000 1.0% 479,000 1.0%Total Fixed Expenses 177,000 1.1% 438,000 1.1% 451,000 1.0% 465,000 1.0% 479,000 1.0%Net Operating Income 5,062,000 32.6% 15,047,000 36.3% 16,137,000 36.7% 16,289,000 36.0% 16,717,000 36.0%FF&E Reserve 155,000 1.0% 415,000 1.0% 878,000 2.0% 1,808,000 4.0% 2,325,000 5.0%Net Operating Income After Reserve $4,907,000 31.6% $14,632,000 35.3% $15,259,000 34.7% $14,481,000 32.0% $14,392,000 31.0%Subordinate FeesSubordinate Management Fee $0 0.0% $82,000 0.2% $207,000 0.5% $317,000 0.7% $458,000 1.0%Subordinate CapEx Reserve $0 0.0% $0 0.0% $0 0.0% $0 0.0% $0 0.0%Total Senior Fees $0 0.0% $82,000 0.2% $207,000 0.5% $317,000 0.7% $458,000 1.0%Net Operating Income After Subordinate Fees $4,907,000 31.6% $14,550,000 35.1% $15,052,000 34.3% $14,164,000 31.3% $13,934,000 30.0%Source: <strong>PKF</strong> Consulting USA Five Months of Operation- 4 -
The Westin Denver International AirportDenver International AirportThe Westin Denver International AirportProjected Operating ResultsCalendar Years2020 2021 2022 20232024Number of Units: 519 519 519 519 519Number of Annual Rooms Available: 189,435 189,435 189,435 189,435 189,435Number of Rooms Occupied: 140,180 140,180 140,180 140,180 140,180Annual Occupancy: 74.0% 74.0% 74.0% 74.0% 74.0%Average Daily Rate: $228.00 $235.00 $242.00 $249.00 $256.00Revenue Per Available Room: $168.72 $173.90 $179.08 $184.26 $189.44Amount Ratio Amount Ratio Amount Ratio Amount Ratio Amount RatioRevenuesRooms $31,961,000 66.7% $32,942,000 66.7% $33,924,000 66.7% $34,905,000 66.7% $35,886,000 66.6%Food & Beverage 15,094,000 31.5% 15,547,000 31.5% 16,013,000 31.5% 16,494,000 31.5% 16,988,000 31.5%Other Operated Departments 533,000 1.1% 549,000 1.1% 565,000 1.1% 582,000 1.1% 600,000 1.1%Rentals <strong>and</strong> Other Income 355,000 0.7% 366,000 0.7% 377,000 0.7% 388,000 0.7% 400,000 0.7%Total Revenues 47,943,000 100.0% 49,404,000 100.0% 50,879,000 100.0% 52,369,000 100.0% 53,874,000 100.0%Departmental ExpensesRooms 7,458,000 23.3% 7,682,000 23.3% 7,912,000 23.3% 8,150,000 23.3% 8,394,000 23.4%Food & Beverage 9,811,000 65.0% 10,105,000 65.0% 10,409,000 65.0% 10,721,000 65.0% 11,042,000 65.0%Other Operated Departments 426,000 79.9% 439,000 80.0% 452,000 80.0% 466,000 80.1% 480,000 80.0%Total Departmental Expenses 17,695,000 36.9% 18,226,000 36.9% 18,773,000 36.9% 19,337,000 36.9% 19,916,000 37.0%Departmental Profit 30,248,000 63.1% 31,178,000 63.1% 32,106,000 63.1% 33,032,000 63.1% 33,958,000 63.0%Undistributed ExpensesAdministrative & General 3,838,000 8.0% 3,954,000 8.0% 4,072,000 8.0% 4,194,000 8.0% 4,318,000 8.0%<strong>Market</strong>ing 3,747,000 7.8% 3,860,000 7.8% 3,976,000 7.8% 4,095,000 7.8% 4,218,000 7.8%Property Operation <strong>and</strong> Maintenance 1,841,000 3.8% 1,896,000 3.8% 1,953,000 3.8% 2,012,000 3.8% 2,072,000 3.8%Utility Costs 1,644,000 3.4% 1,693,000 3.4% 1,744,000 3.4% 1,796,000 3.4% 1,850,000 3.4%Total Undistributed Operating Expenses 11,070,000 23.1% 11,403,000 23.1% 11,745,000 23.1% 12,097,000 23.1% 12,458,000 23.1%Gross Operating Profit 19,178,000 40.0% 19,775,000 40.0% 20,361,000 40.0% 20,935,000 40.0% 21,500,000 39.9%Base Management Fee 1,417,000 3.0% 1,461,000 3.0% 1,505,000 3.0% 1,546,000 3.0% 1,592,000 3.0%Fixed ExpensesProperty Taxes 0 0.0% 0 0.0% 0 0.0% 0 0.0% 0 0.0%Insurance 493,000 1.0% 508,000 1.0% 523,000 1.0% 539,000 1.0% 555,000 1.0%Total Fixed Expenses 493,000 1.0% 508,000 1.0% 523,000 1.0% 539,000 1.0% 555,000 1.0%Net Operating Income 17,268,000 36.0% 17,806,000 36.0% 18,333,000 36.0% 18,850,000 36.0% 19,353,000 35.9%FF&E Reserve 2,877,000 6.0% 2,964,000 6.0% 3,053,000 6.0% 3,142,000 6.0% 3,232,000 6.0%Net Operating Income After Reserve $14,391,000 30.0% $14,842,000 30.0% $15,280,000 30.0% $15,708,000 30.0% $16,121,000 29.9%Subordinate FeesSubordinate Management Fee $472,000 1.0% $487,000 1.0% $502,000 1.0% $515,000 1.0% $531,000 1.0%Subordinate CapEx Reserve $479,000 1.0% $988,000 2.0% $1,018,000 2.0% $1,571,000 3.0% $1,616,000 3.0%Total Senior Fees $951,000 2.0% $1,475,000 3.0% $1,520,000 3.0% $2,086,000 4.0% $2,147,000 4.0%Net Operating Income After Subordinate Fees $13,440,000 28.0% $13,367,000 27.1% $13,760,000 27.0% $13,622,000 26.0% $13,974,000 25.9%Source: <strong>PKF</strong> Consulting USA- 5 -